-
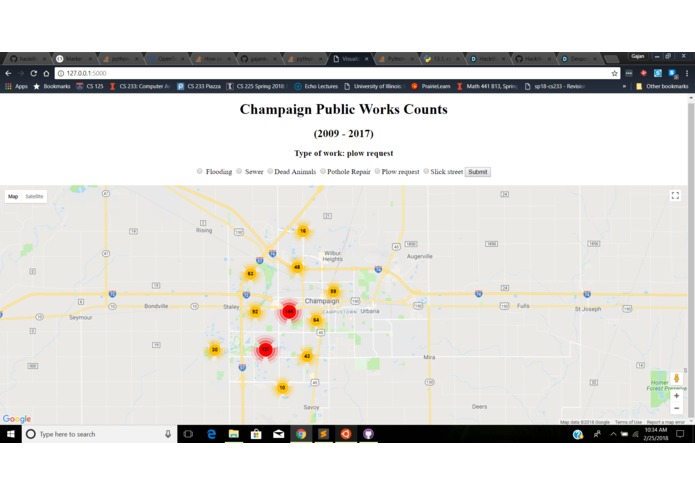
Homescreen
Inspiration
Public service.
What it does
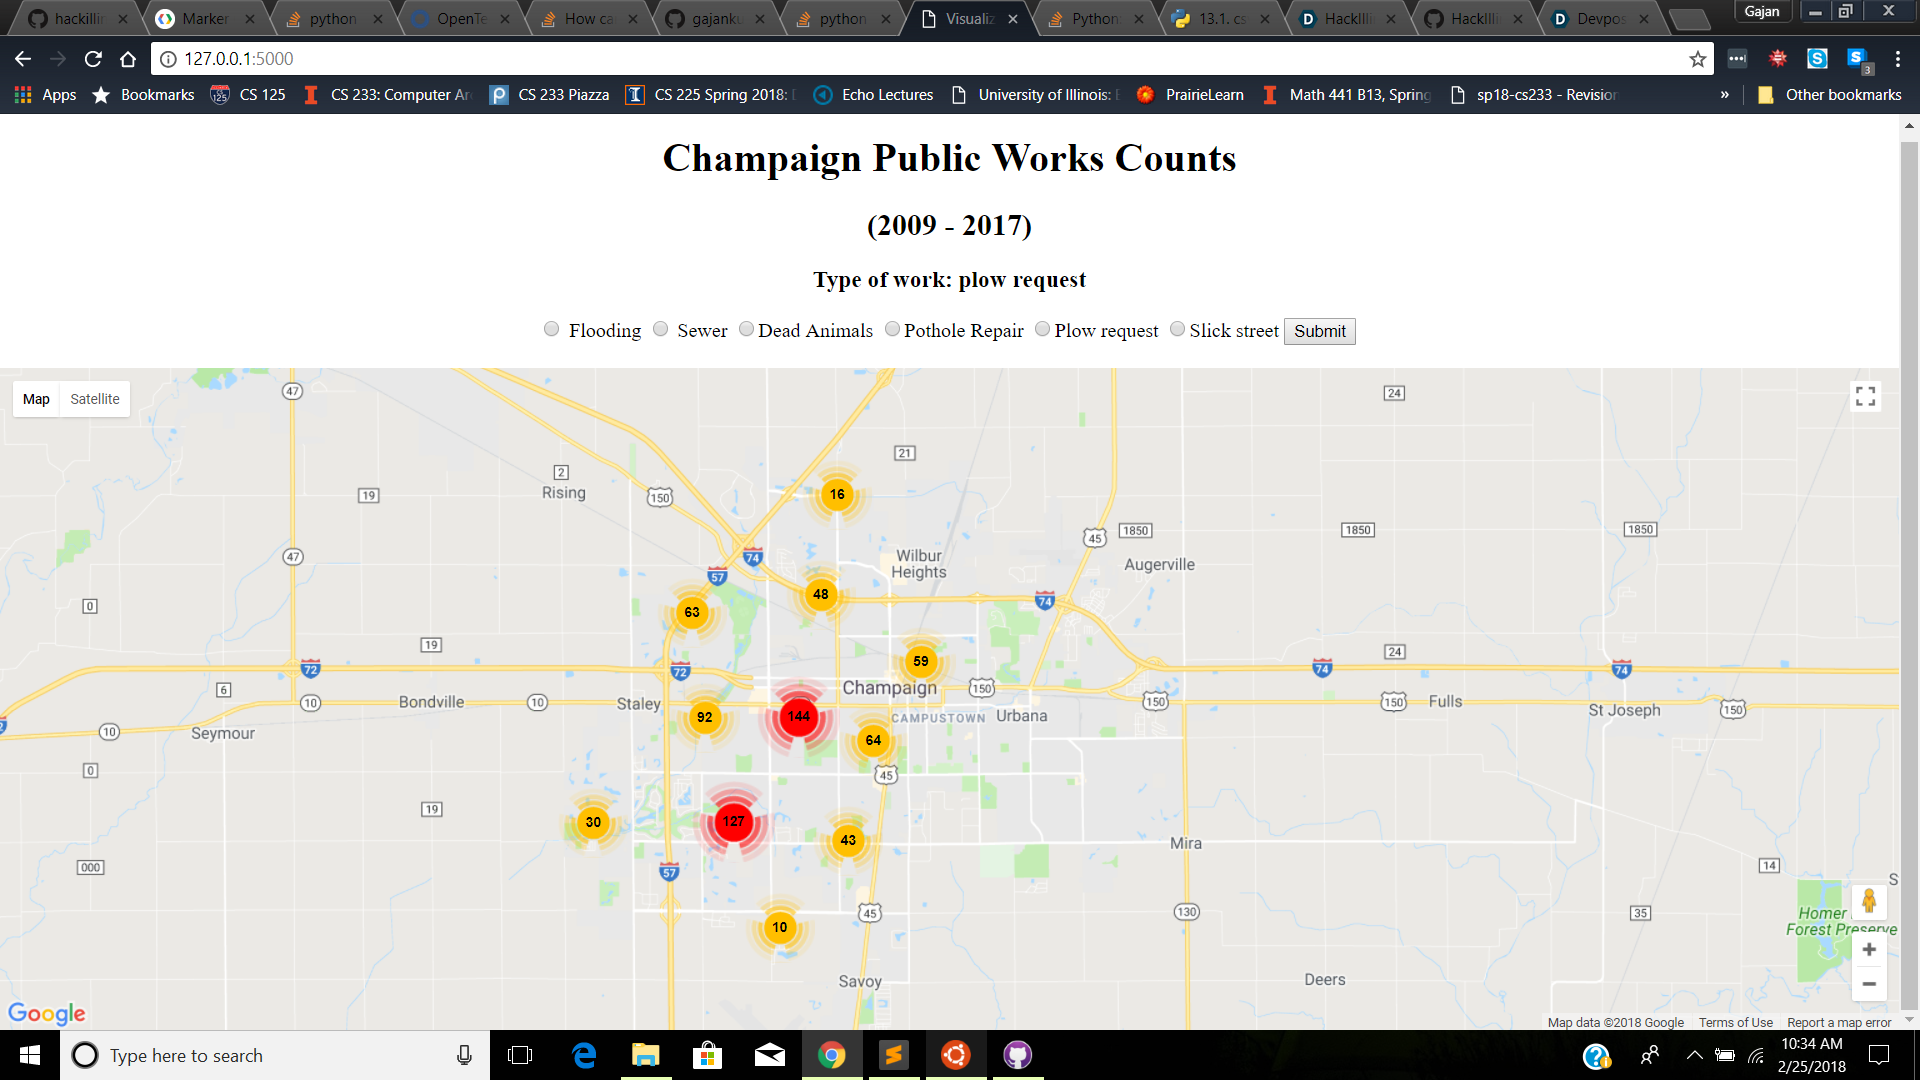
Visualizes public works in Champaign from 2009 to 2017 such as flooding, pothole repairs, plow requests, etc.
How we built it
Flask
Challenges we ran into
The hardest challenge was converting the coordinates used in the city data to coordinates usable by Google Maps.
Accomplishments that we're proud of
Being able to contribute to the public sector and possibly save the city money.
What we learned
Python, Google Maps API
What's next for Champaign Public Works Visualizer
Integrate with municipal services. Develop sensors that can be mounted underneath vehicles to detect potholes, ice conditions, etc. Add labels to the locations and create a way to organize by year.

Log in or sign up for Devpost to join the conversation.