Inspiration
To Contribute to tackle climate change
What it does
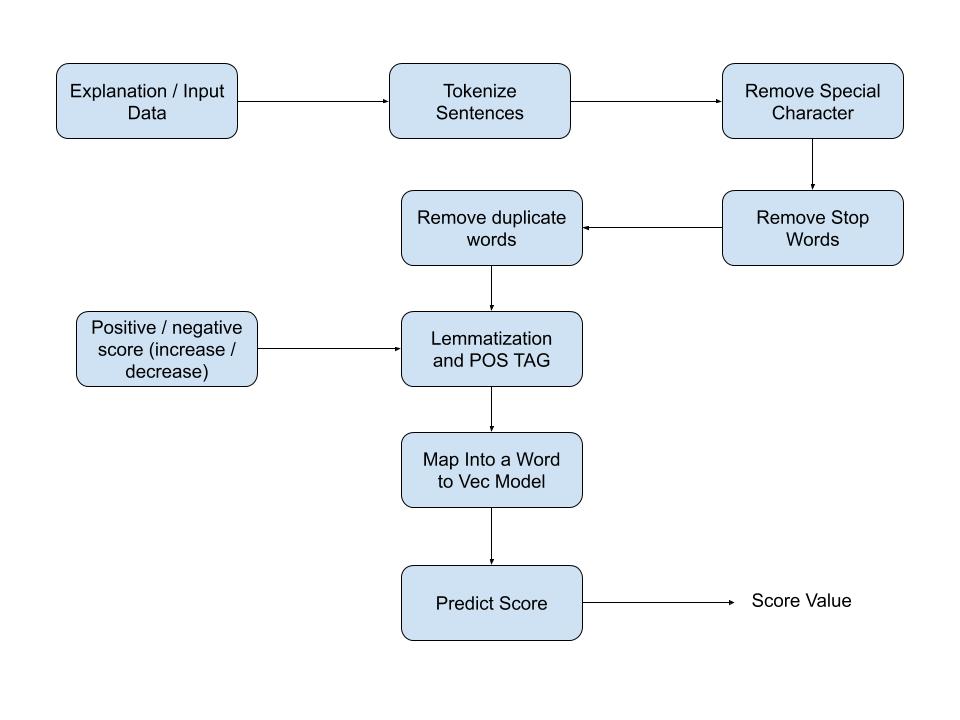
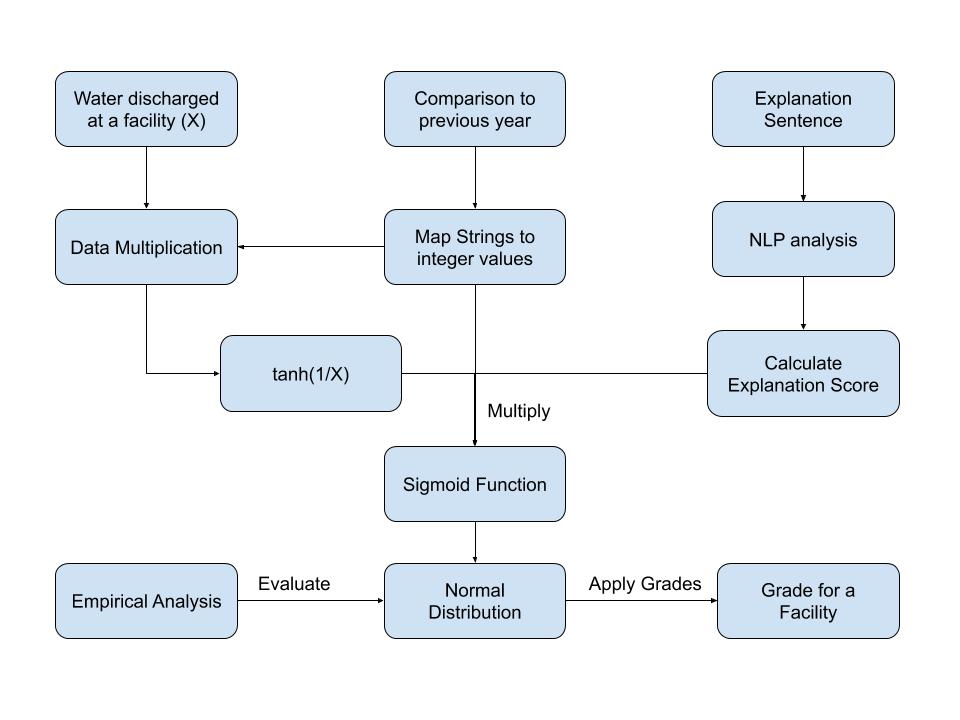
A subset of CPD Dataset has been preprocessed and the water withdrawal values, location of the facility, Comparison to previous year and it’s Explanation are extracted and added to a csv file. The Facilities showing improvement / decline with time ( previous year) are located. A Word to Vector model is used to categorise the trend of the improvement / decline in terms of Explanation and water withdrawal values with high improved accuracy. Based on the predictions, the improvement / declining trend, critical zones are identified and represented in maps.
How I built it
Using Flask and all the powers of python.
Challenges I ran into
The dataset has lot of columns and rows. Preprocessing was difficult.
Accomplishments that I'm proud of
Contributed to identify risk zones
What's next for Challenge 2 - Team Enigma - Risk Analysis for each facility
More comprehensive risk analysis


Log in or sign up for Devpost to join the conversation.