Inspiration
In Physics I, it is possible to follow every equation and still struggle to picture what is actually happening. That gap inspired Chalk: an interactive notebook that helps students explore a concept and gives teachers a way to demonstrate it in class.
We wanted to move beyond getting an answer. What happens when a mass changes? Why does the acceleration decrease? How does a graph explain a limit? Chalk keeps the question, reasoning, and visual model together so learners can investigate those questions.
What it does
Start by typing a question or uploading a photo. Chalk produces a worked solution and an interactive visualization, with the original problem saved alongside the generated work.
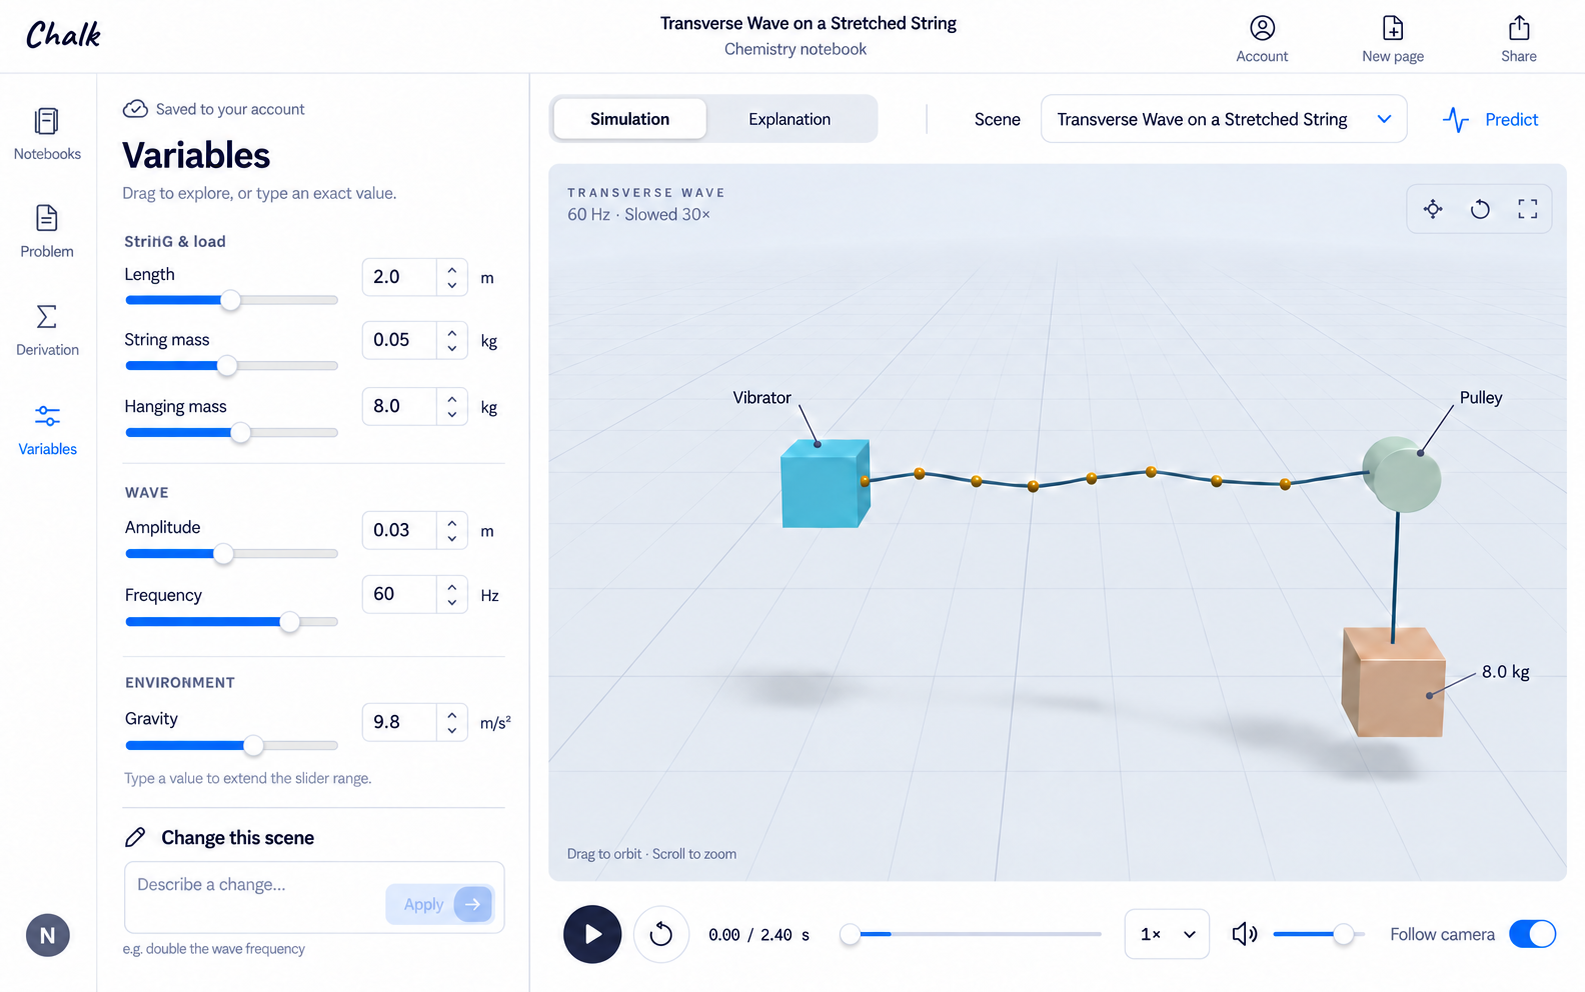
- Explore the model: play, pause, replay, orbit, and zoom into an interactive scene.
- Change the variables: drag a slider or type an exact value and see the model recalculate locally, without asking AI for every adjustment.
- Follow the reasoning: read the derivation and connect its steps to the visualization, with mathematical notation rendered using KaTeX.
- Watch an explanation: generate narrated explanation videos that combine the visual model, equations, and reasoning. Pause, replay, or download them.
- Keep the work: organize questions in physics, chemistry, and mathematics notebooks, with saved simulation versions and explanation videos.
For example, two masses of 3 kg and 2 kg connected by an ideal pulley accelerate at 1.96 m/s². Add 1 kg to both sides and the acceleration falls to 1.40 m/s². The difference in weight is unchanged, but there is more total mass to accelerate. Chalk turns that calculation into something a teacher can demonstrate and a student can experiment with.
The visualization depends on the problem. Physics can use animated systems; mathematics can use graphs and visual reasoning; chemistry can use schematic models. A visual example complements a proof or explanation—it does not replace it.
How we built it
The application uses Next.js, React, and TypeScript. Three.js, React Three Fiber, and Drei render the interactive scenes.
Generation separates the worked solution from the visualization. The AI produces a structured SceneScript JSON specification describing objects, variables, mathematical expressions, camera settings, and a timeline. A fixed renderer interprets that specification rather than running arbitrary AI-generated JavaScript.
Zod validates the scene structure. mathjs parses and evaluates a restricted set of expressions, with checks for unsupported operations, invalid references, non-finite values, and disagreement between numerical answers and the solution. Once generated, the scene's expressions are recalculated in the browser as parameters change.
The solver supports Gemini, OpenCode, and Ollama backends. The local demonstration uses OpenCode with a configured DeepSeek model; the hosted generation path uses Gemini.
Supabase Auth, Postgres, and private Storage keep account data and video artifacts together. Hosted background generation uses Vercel Workflow, and cloud video rendering uses Vercel Sandbox with Python, Manim, FFmpeg, TeX, and speech synthesis. Completed videos are stored in cloud storage and served through authenticated playback access. Dependency snapshots can reuse the renderer environment instead of installing it from scratch for every render.
Challenges we ran into
The biggest challenge was making the written solution, mathematical model, animation, and editable variables agree. A convincing picture is not enough: the controls must change the intended quantities and the formulas must remain valid across the supported range.
Other challenges included rendering long equations and narration without overlapping text, handling symbolic questions that do not have a single numerical answer, preserving generation work across refreshes, retaining previous simulation versions, and making locally generated videos available to the same account on the hosted app.
Accomplishments that we're proud of
We brought the problem statement, derivation, interactive model, variable controls, and narrated explanations into one notebook workflow. The most meaningful interaction is a small one: change a variable, replay the scene, and understand why the outcome changes.
What we learned
Educational visualization requires choosing the right representation for a question. A graph may explain a mathematics problem better than a 3D scene. A chemistry diagram must make its assumptions clear. Validation catches structural and numerical problems, but it does not establish that every AI-generated explanation is scientifically correct.
What's next for Chalk
We want to expand subject-specific visualizations, strengthen scientific verification, improve generation speed and recovery, and add more classroom-focused workflows. We also want to evaluate Chalk with students and teachers to learn which interactions actually improve understanding.
Chalk helps turn “I know the formula” into “I understand what happens when I change this.”
Gallery images are polished promotional interface illustrations used in the launch video. The demo videos show the product and its learning workflow.
Built With
- css
- next.js
- typescript

