BlackRock API: Portfolio Diversity Visualizer
Made by Richard Zhu, Riley Dyer, David Zhu, and Shreyash Sridhar
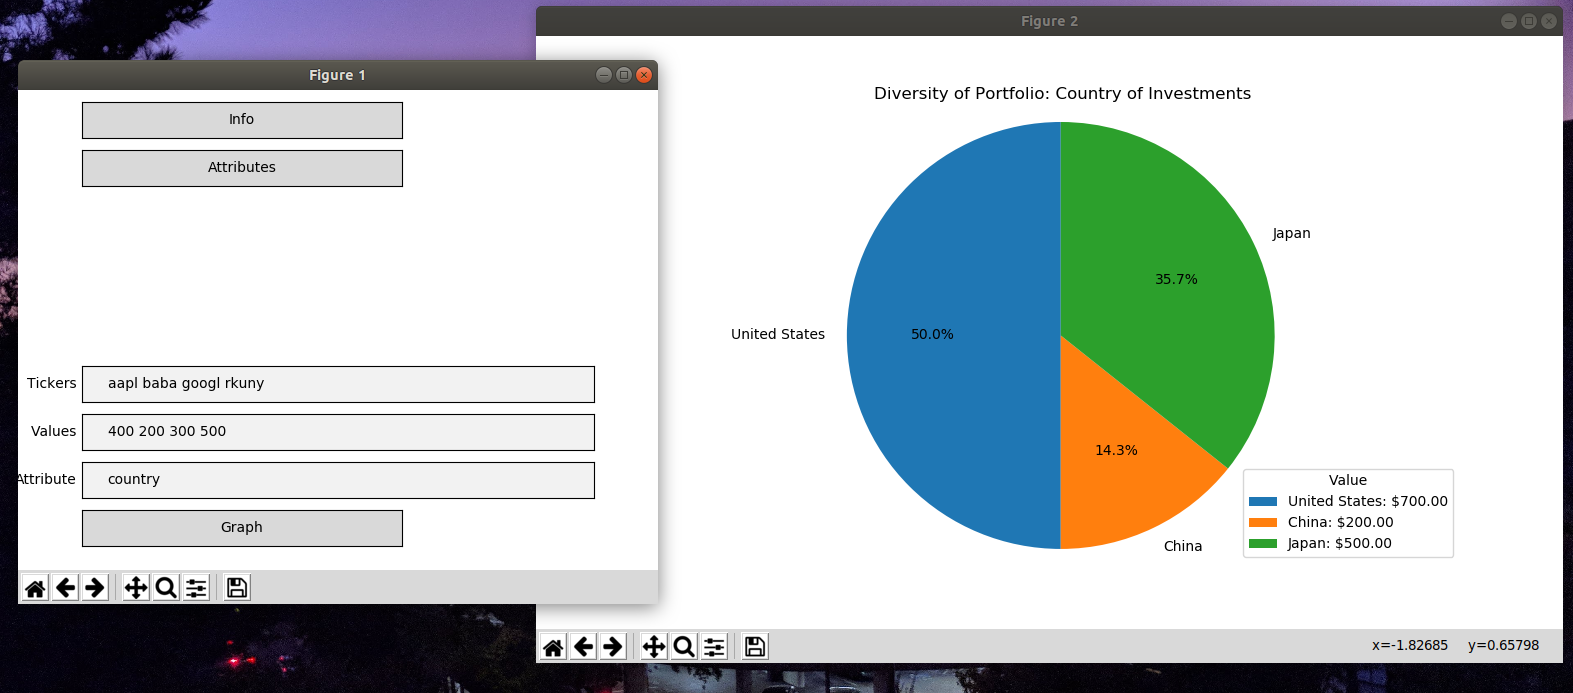
We liked the challenge of utilizing a complex API and the data of a company that handles enormous real life responsibilities. We decided to make a tool that would perform a simple yet helpful function: visualizing the amount of diversity in an investment portfolio. Beyond just examining asset type diversity, the tool can also visualize the variety of industry sectors, countries, and more data about the assets in a portfolio.
Since we lack front-end web app experience, we used MatPlotLib to visualize the data. We used Python to convert strings (The tickers) into a parameter statement to pass into BlackRock's API. Using the JSON object that the API returned, we used list sorting to align user portfolio info with the data requested, in order to be able to categorize security metadata into their correct areas.
For the GUI, we utilized MatPlotLib and its widgets: It's a windowed GUI with text input boxes for the tickers, dollar amounts, and the specific data attribute to examine.
To Use:
Load the GUI by running vis3.py
Resources Used
http://rockthecode.io/api/ https://www.blackrock.com/tools/api-tester/hackathon?apiType=securityData


Log in or sign up for Devpost to join the conversation.