-
-
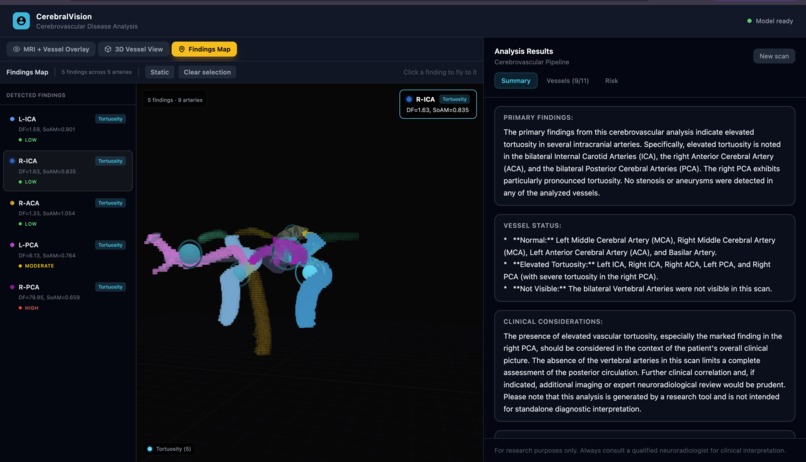
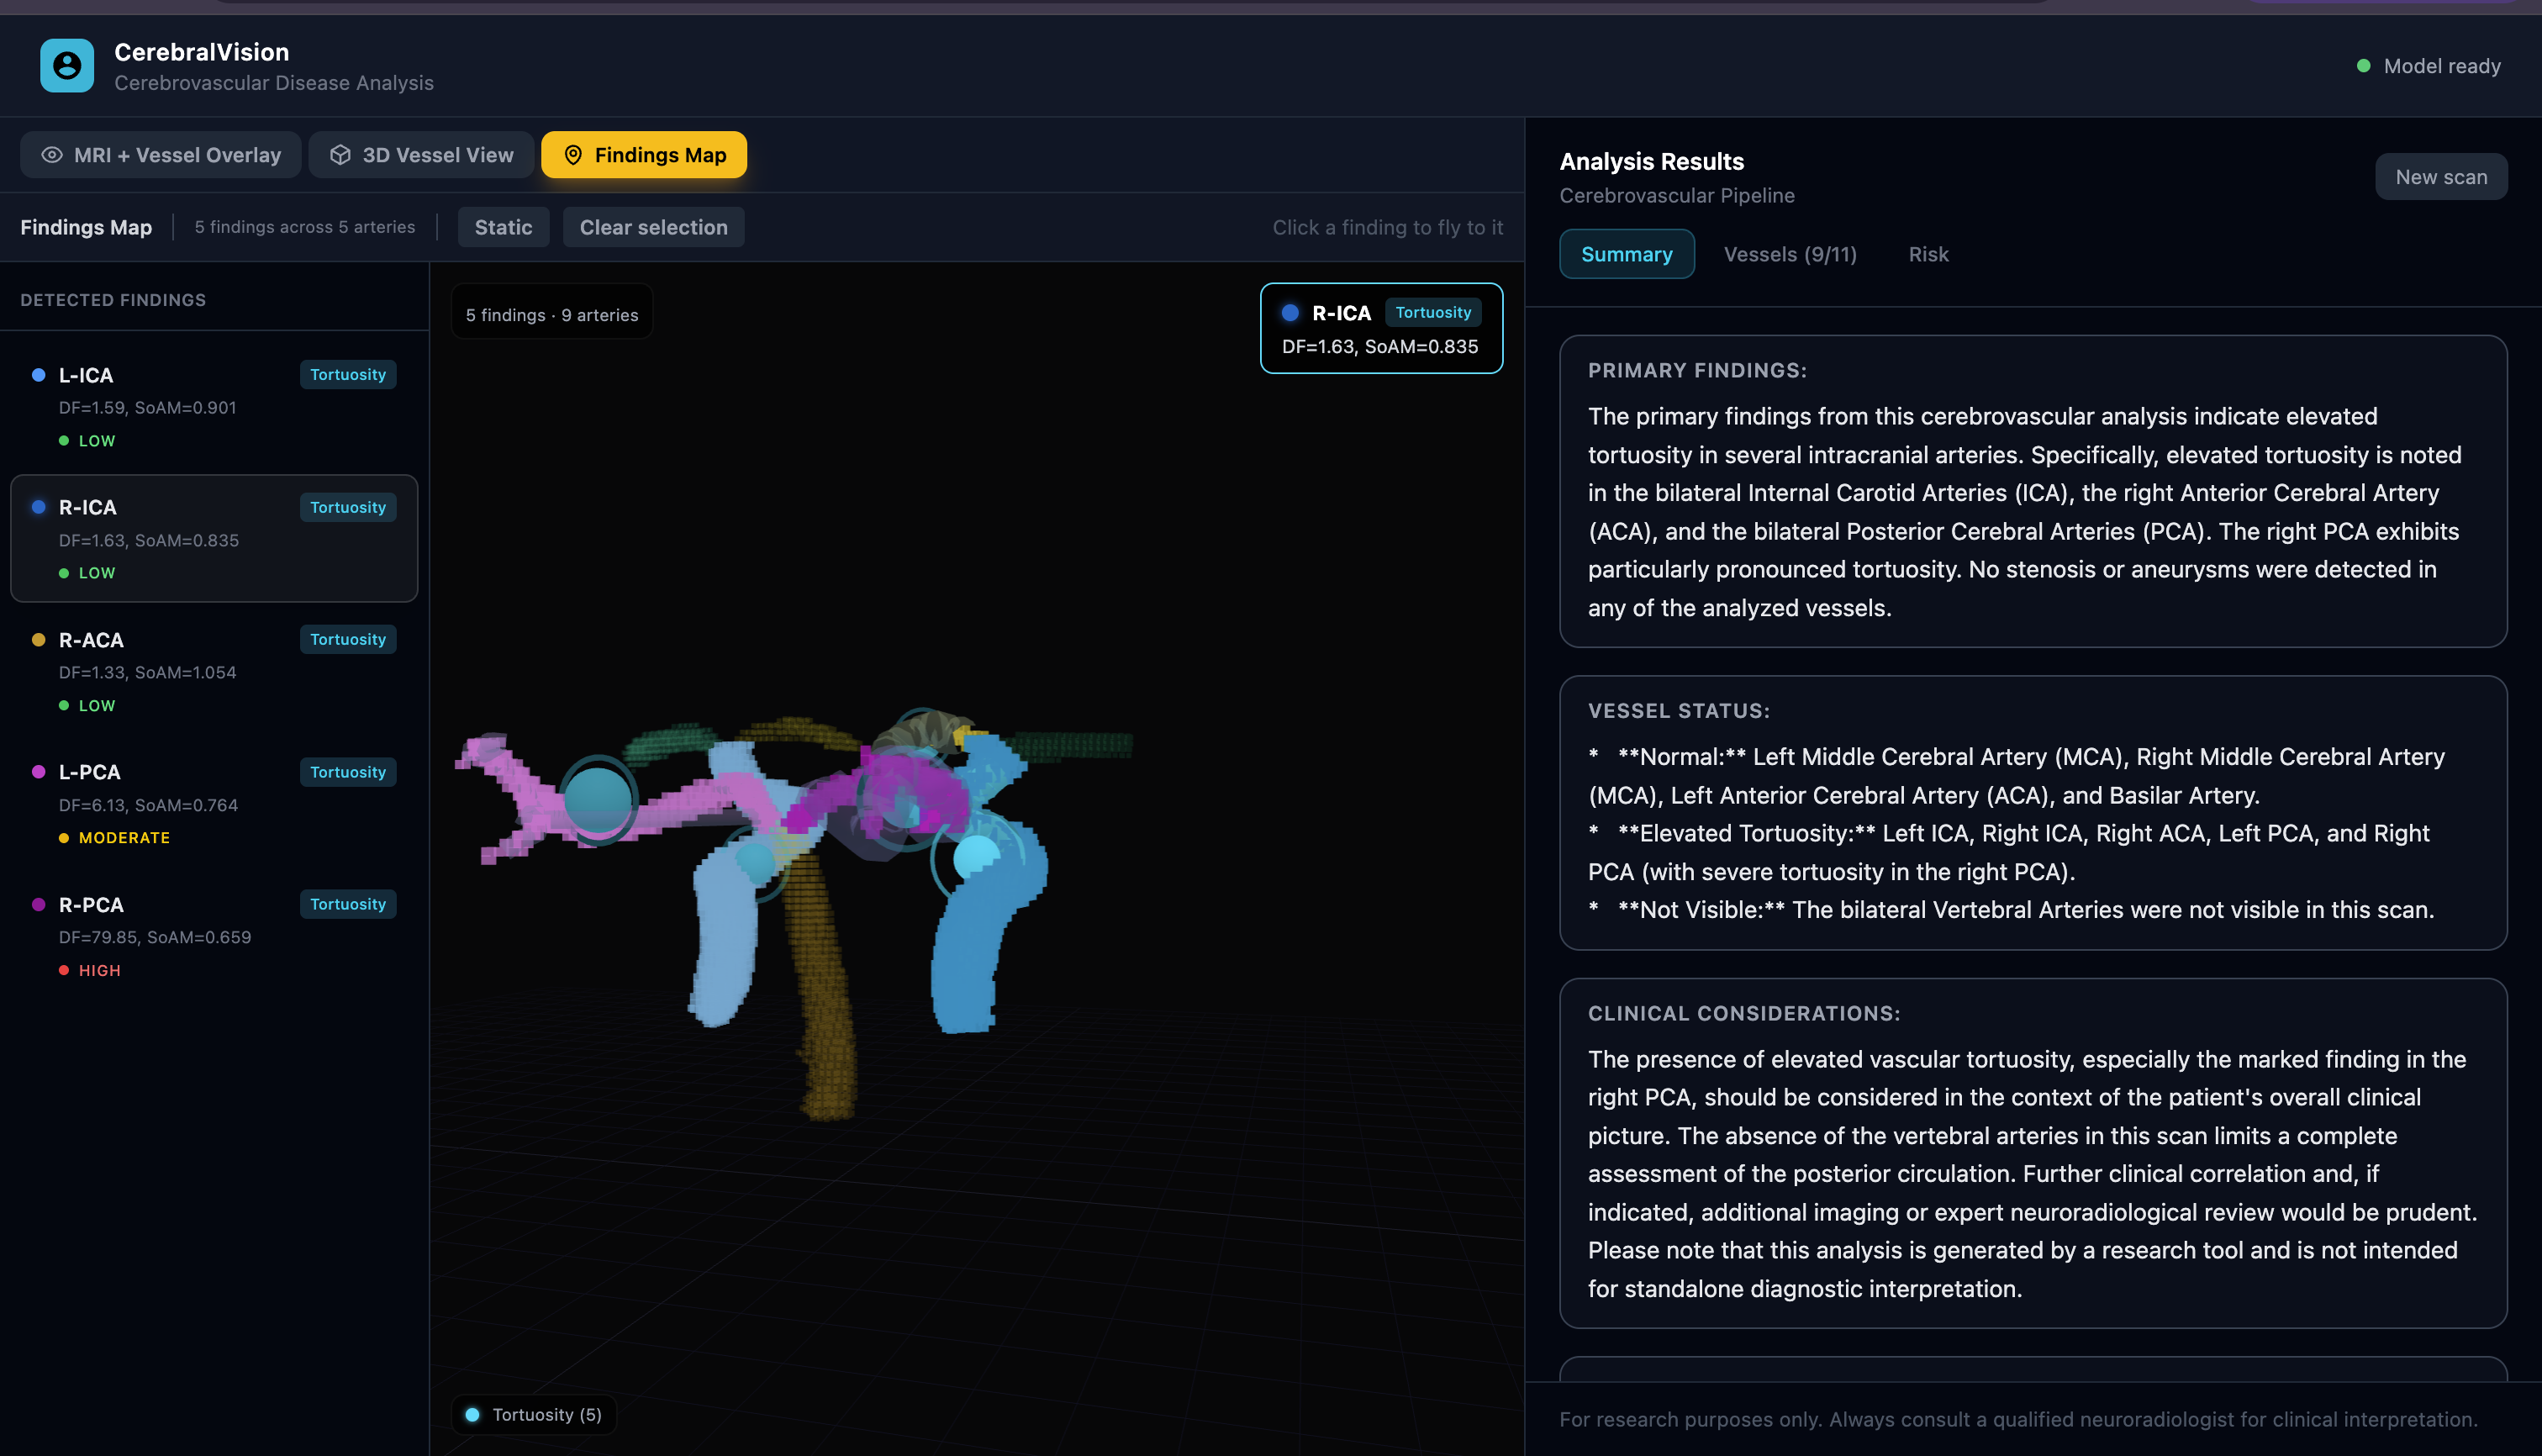
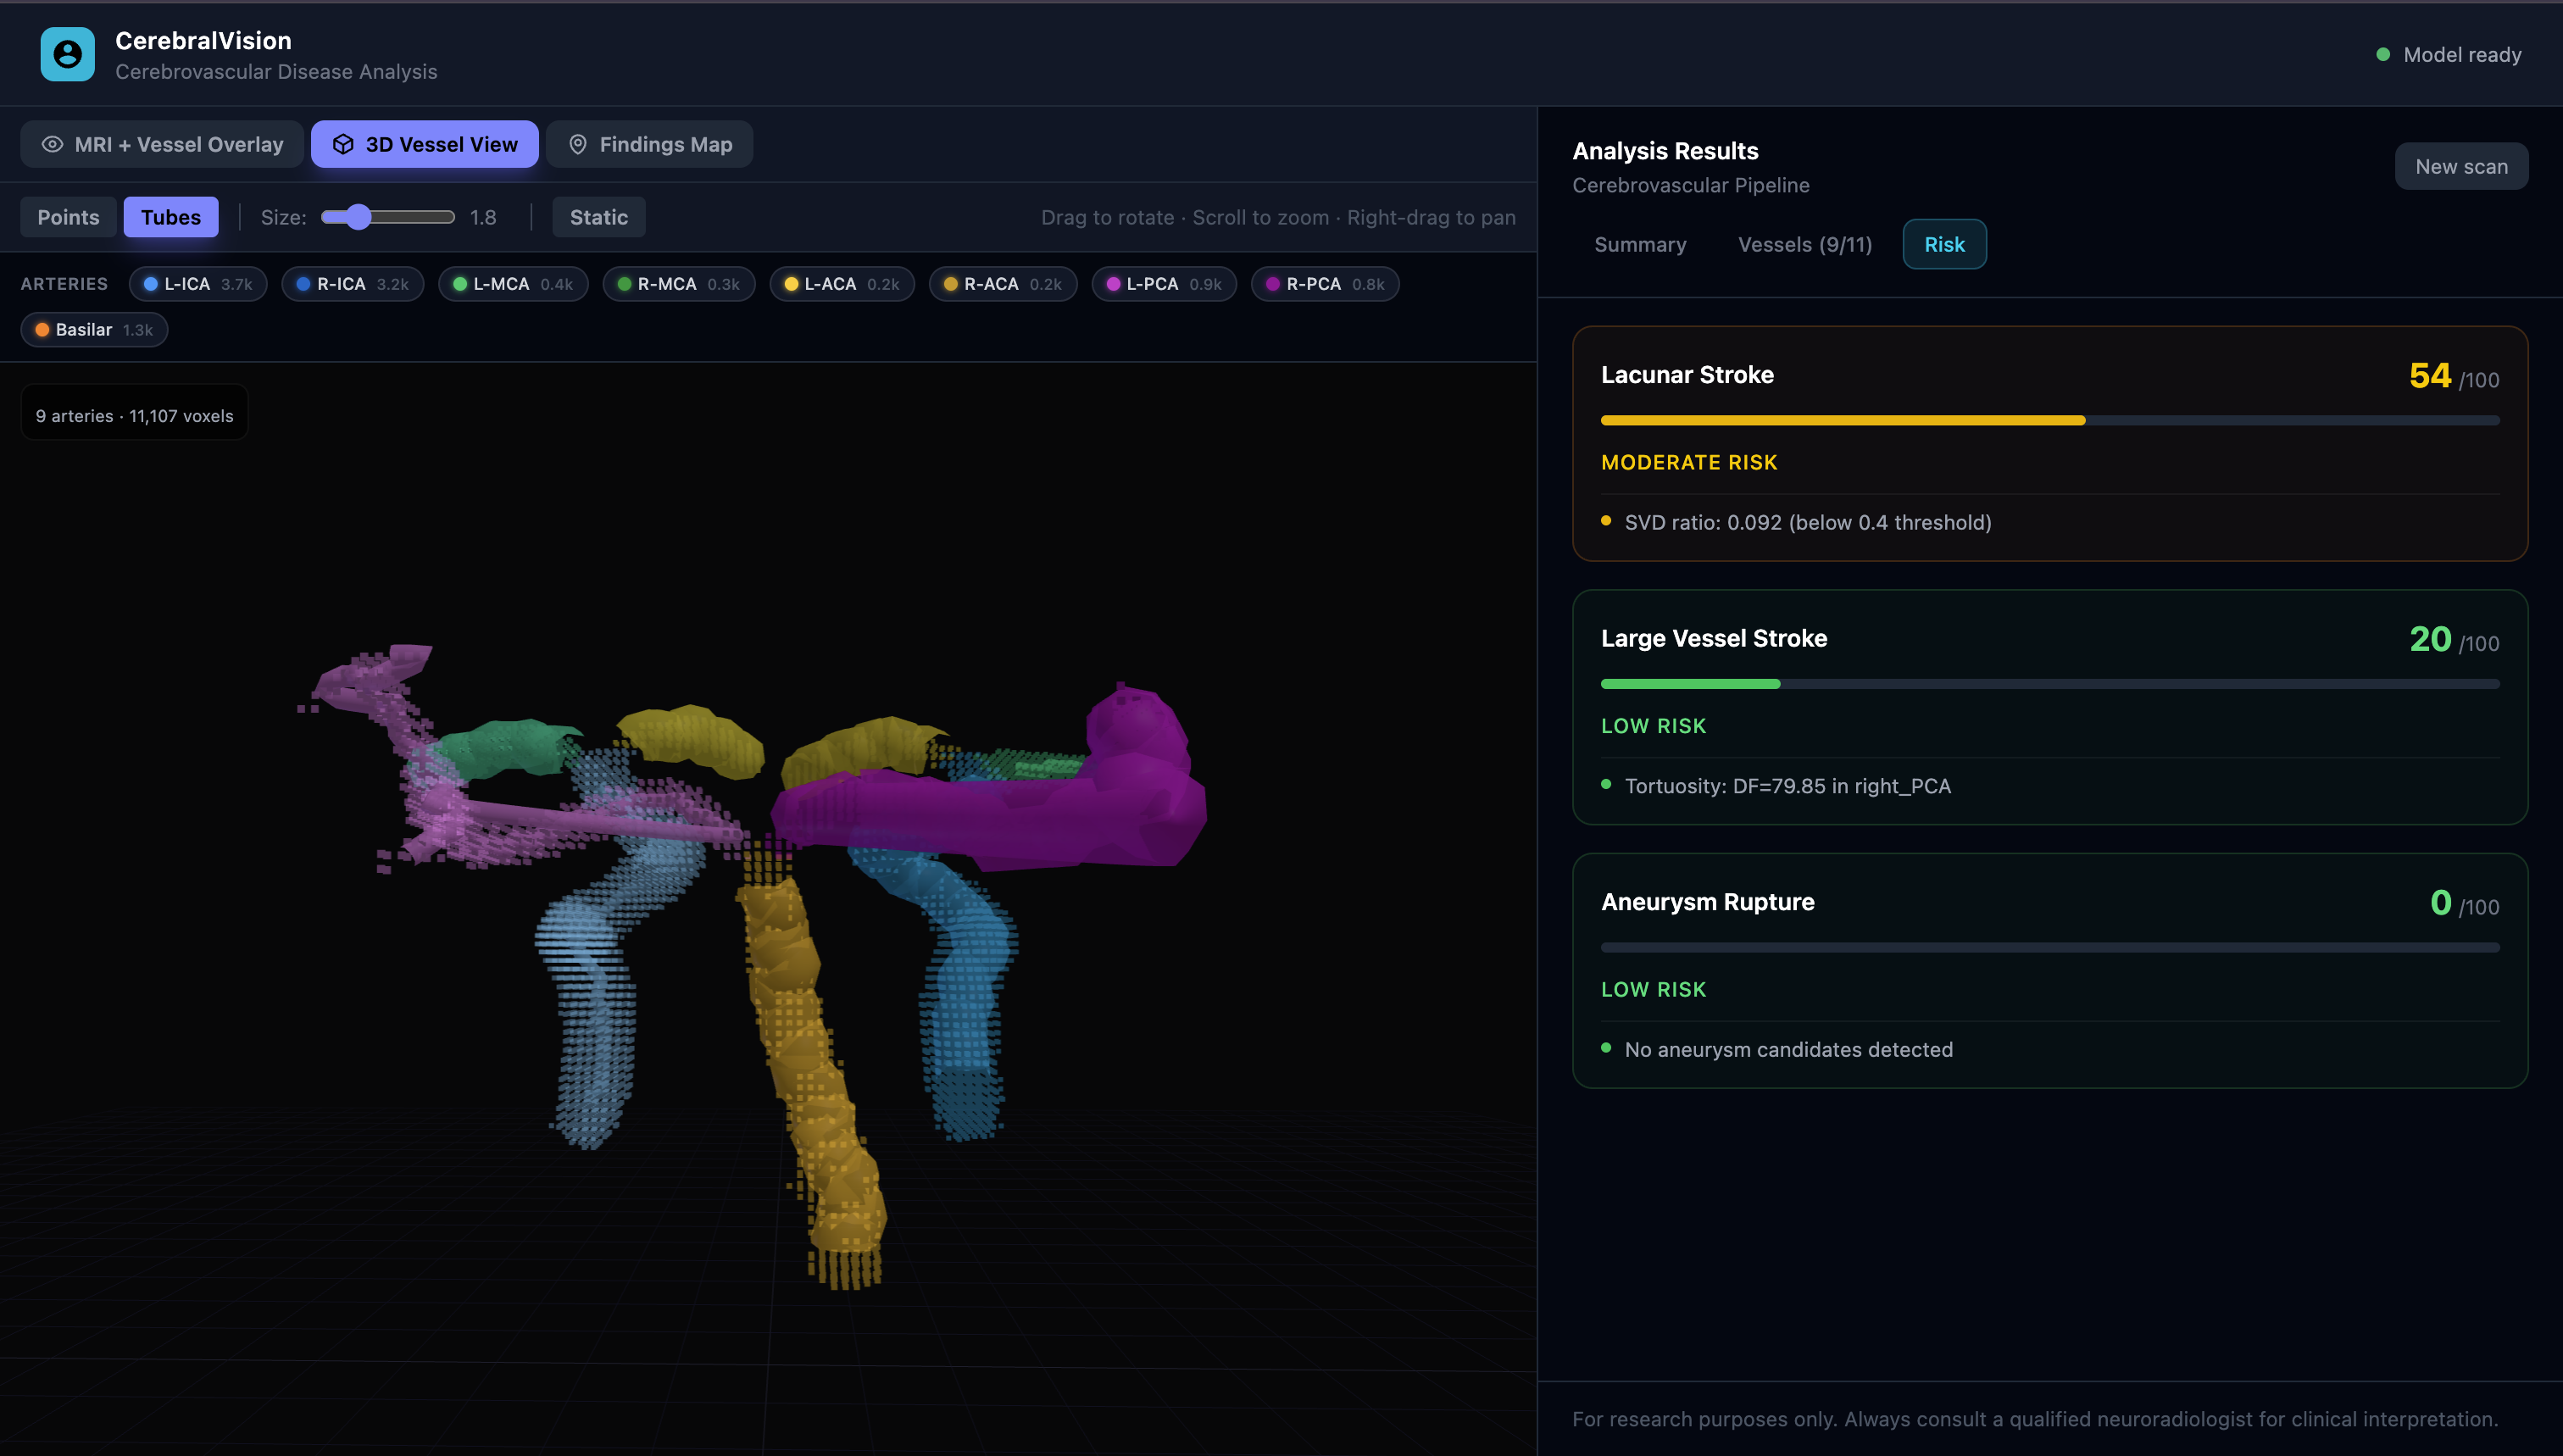
3D Map of Blood Vessels with Gemini AI Assistance
-
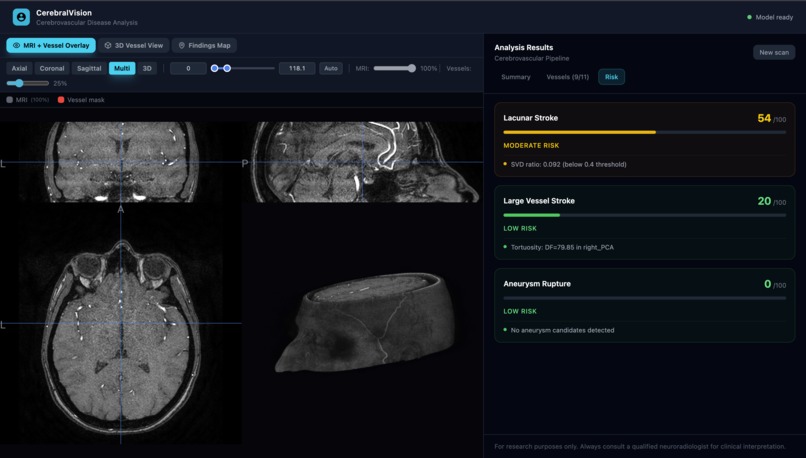
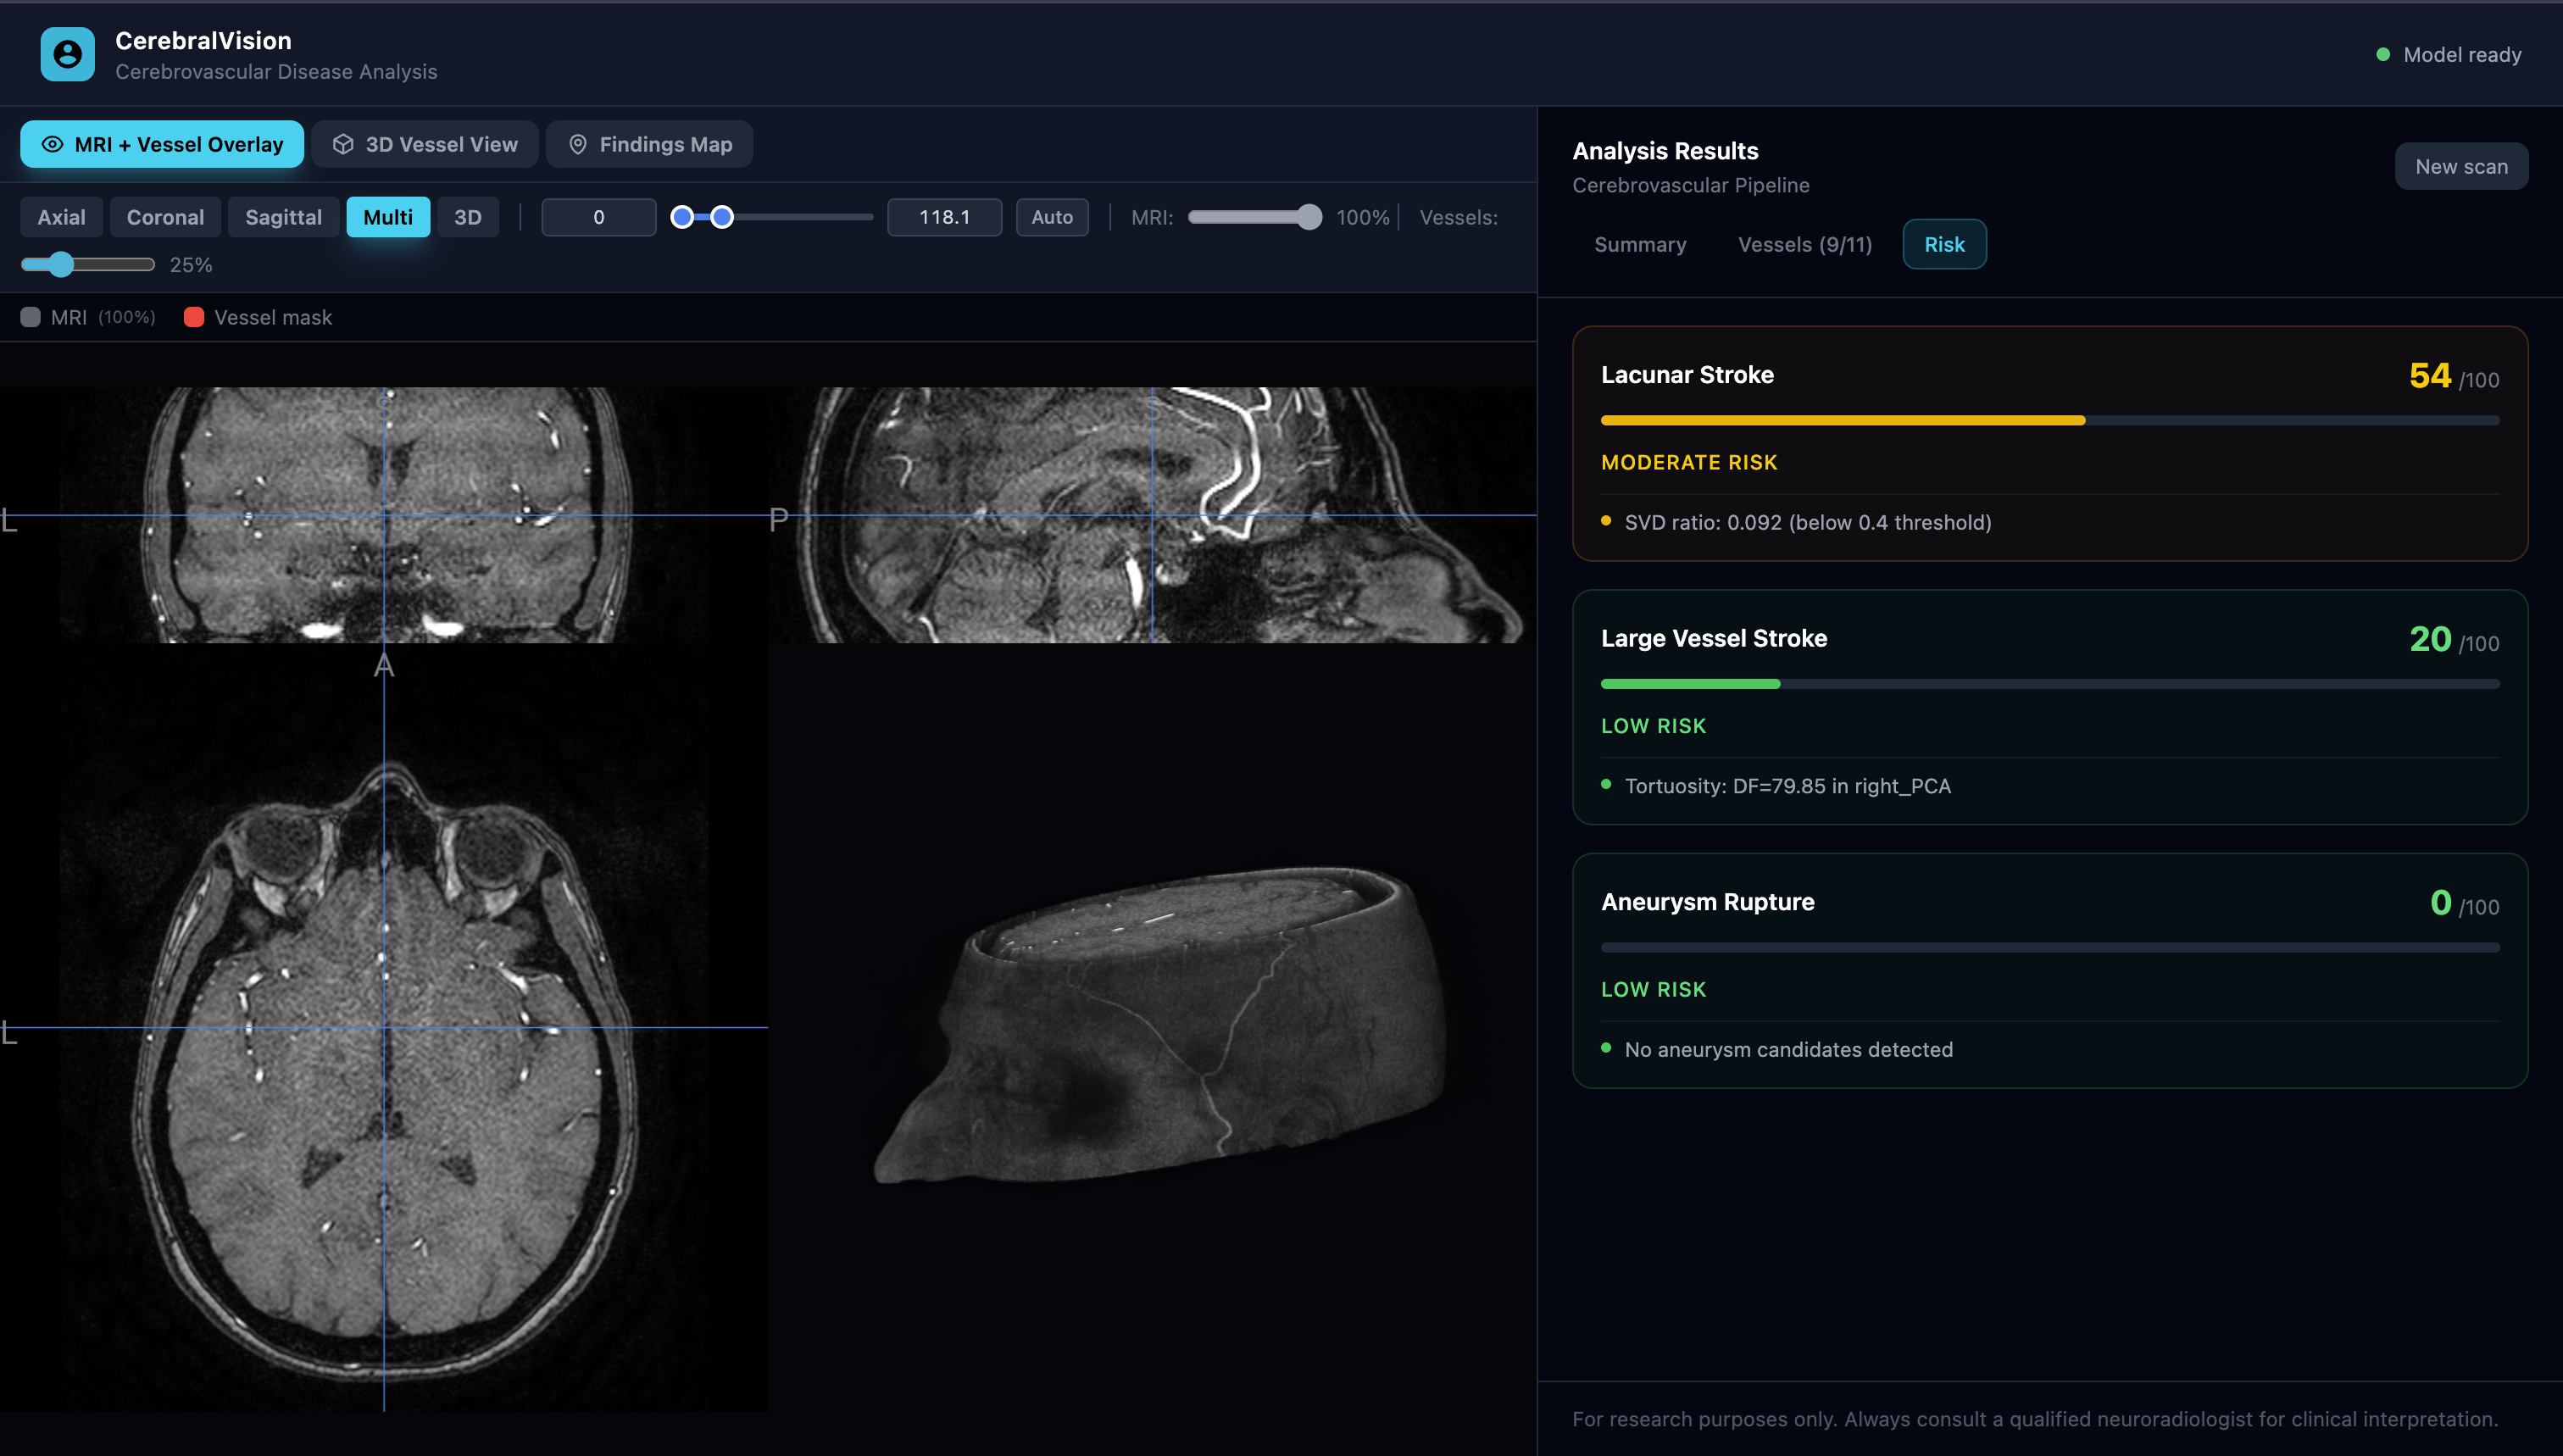
Brain CMRI Demo Scan
-
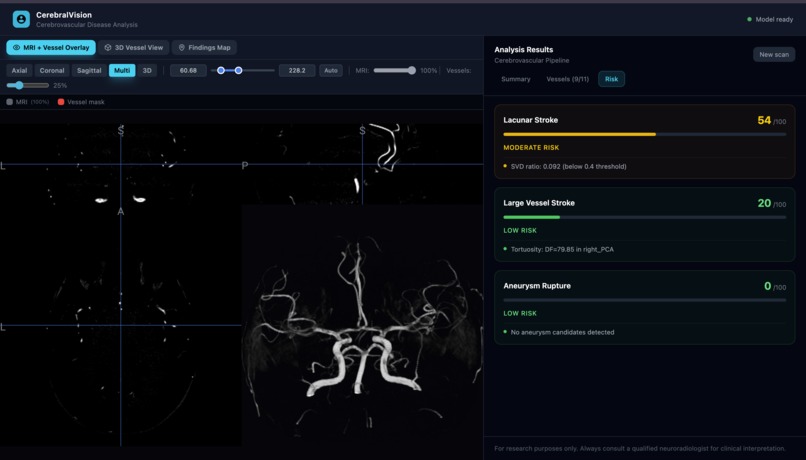
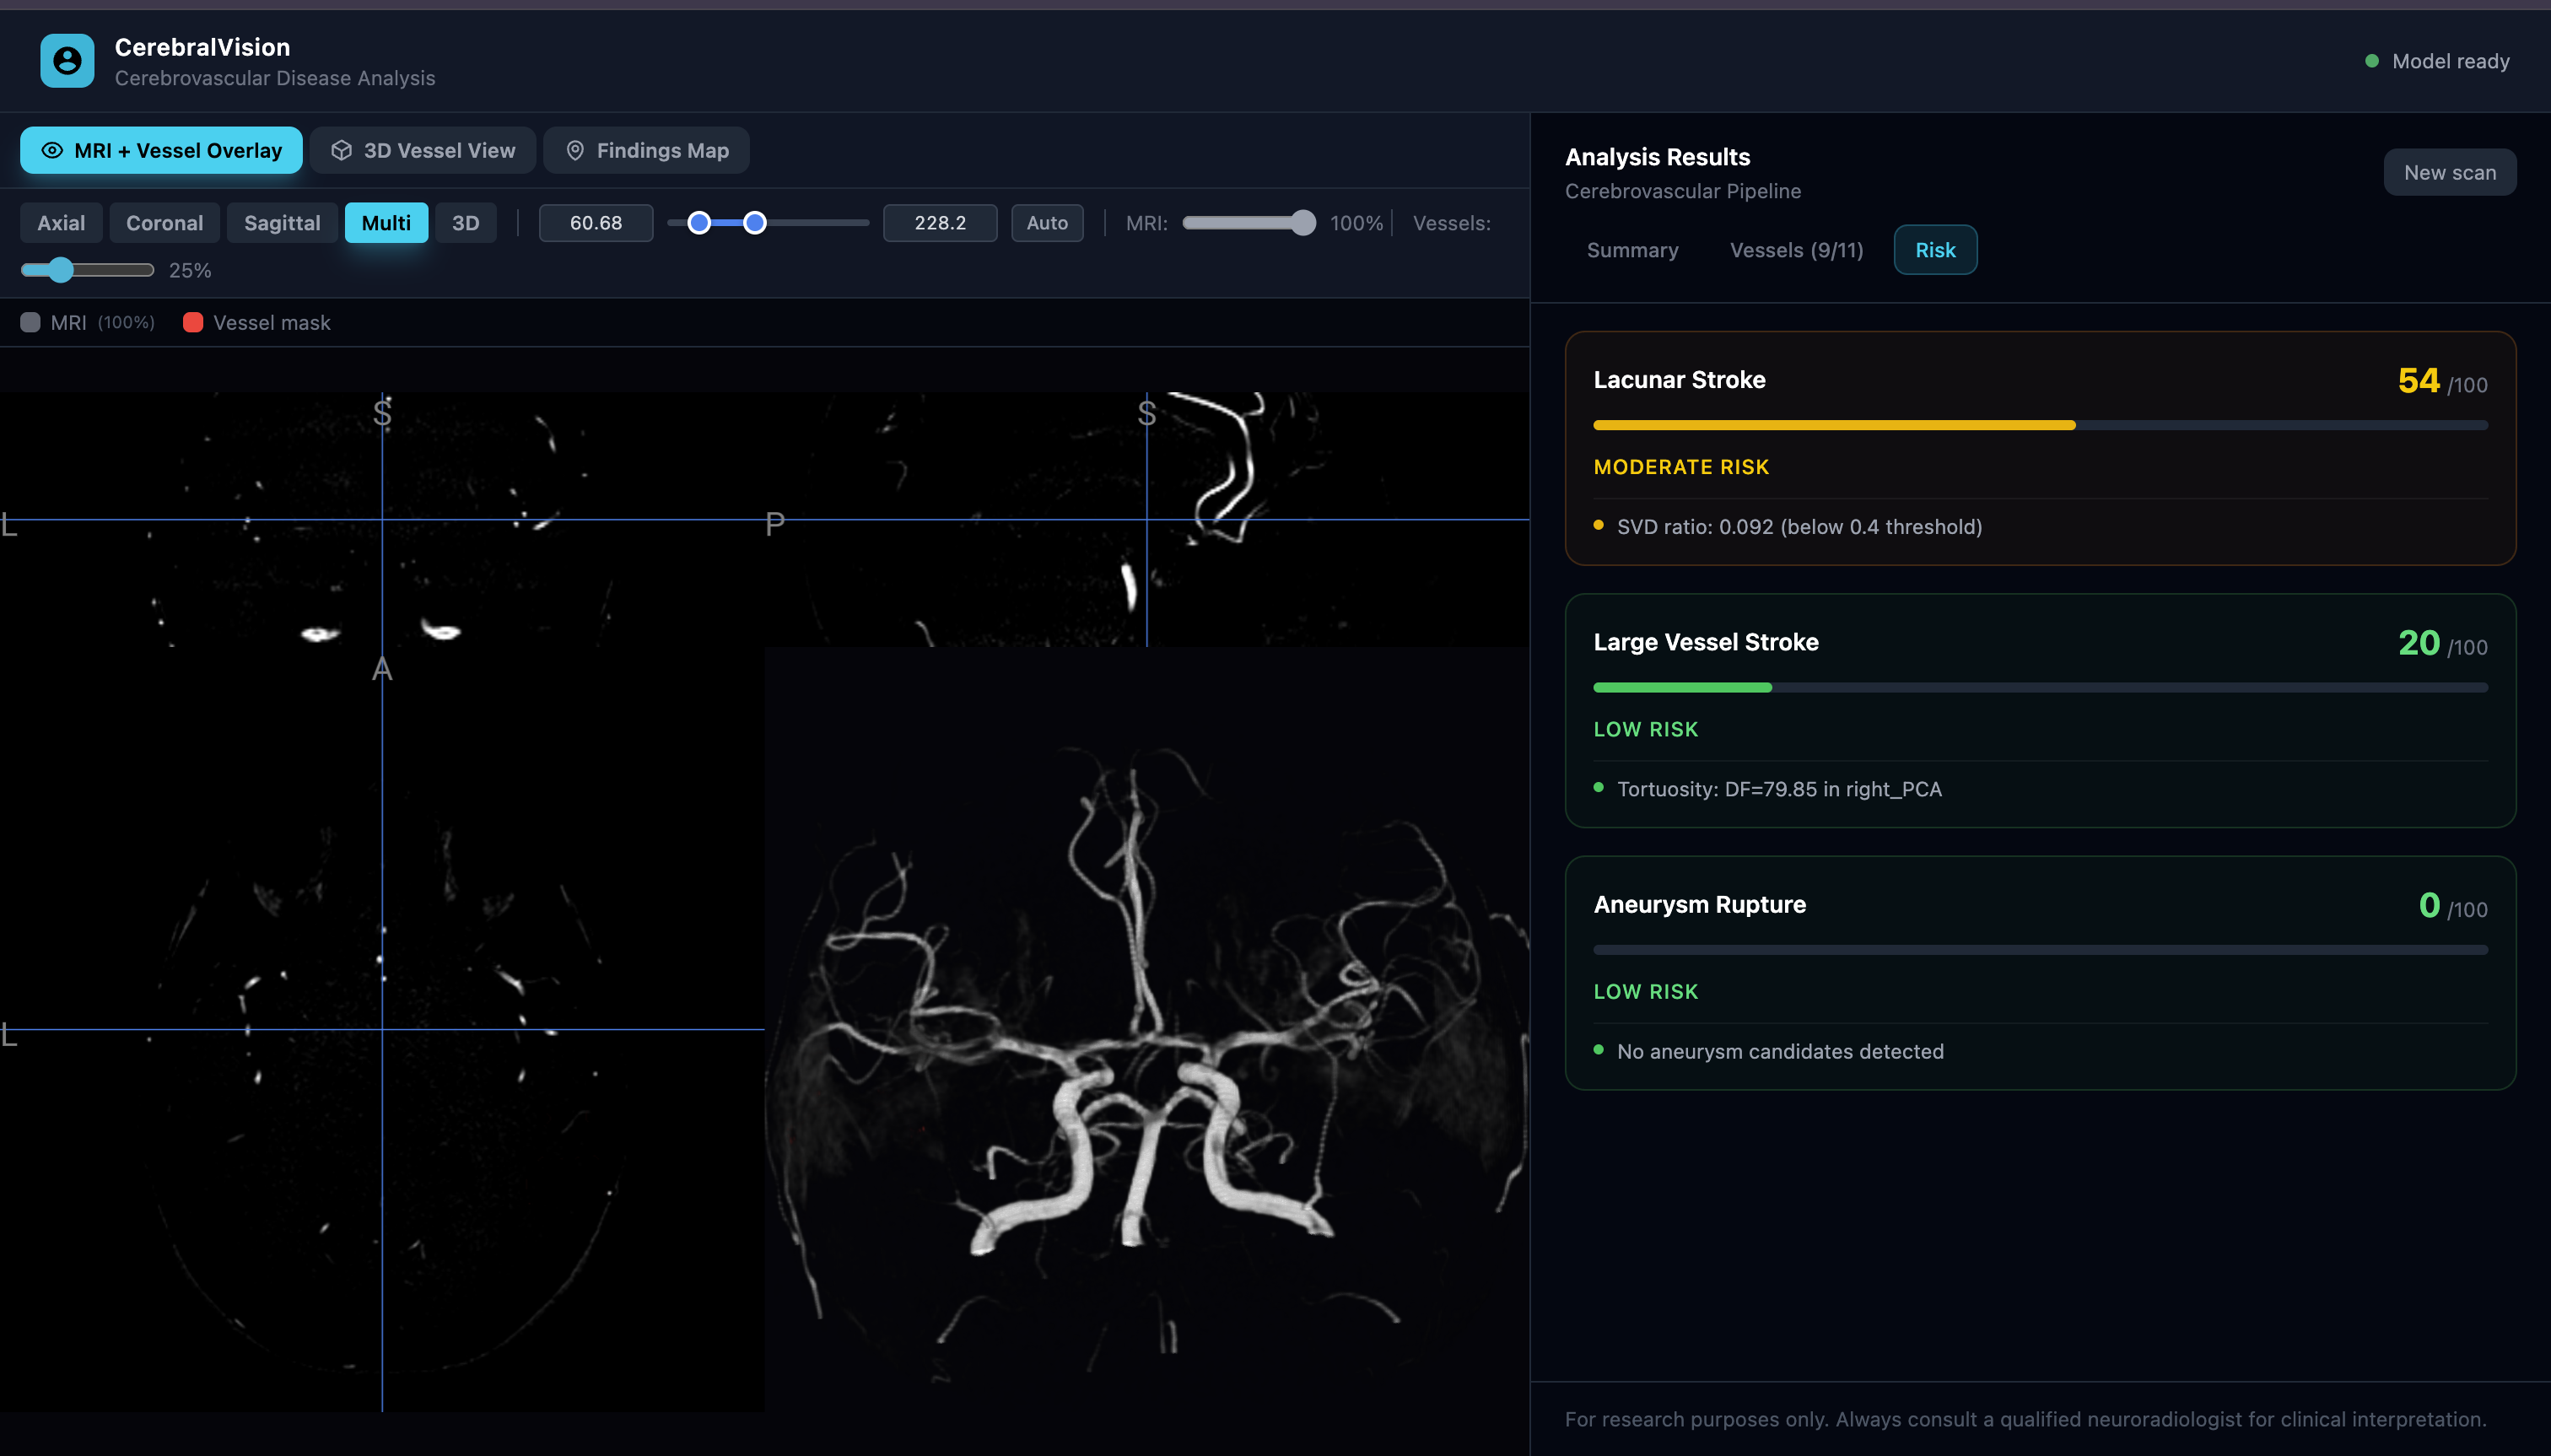
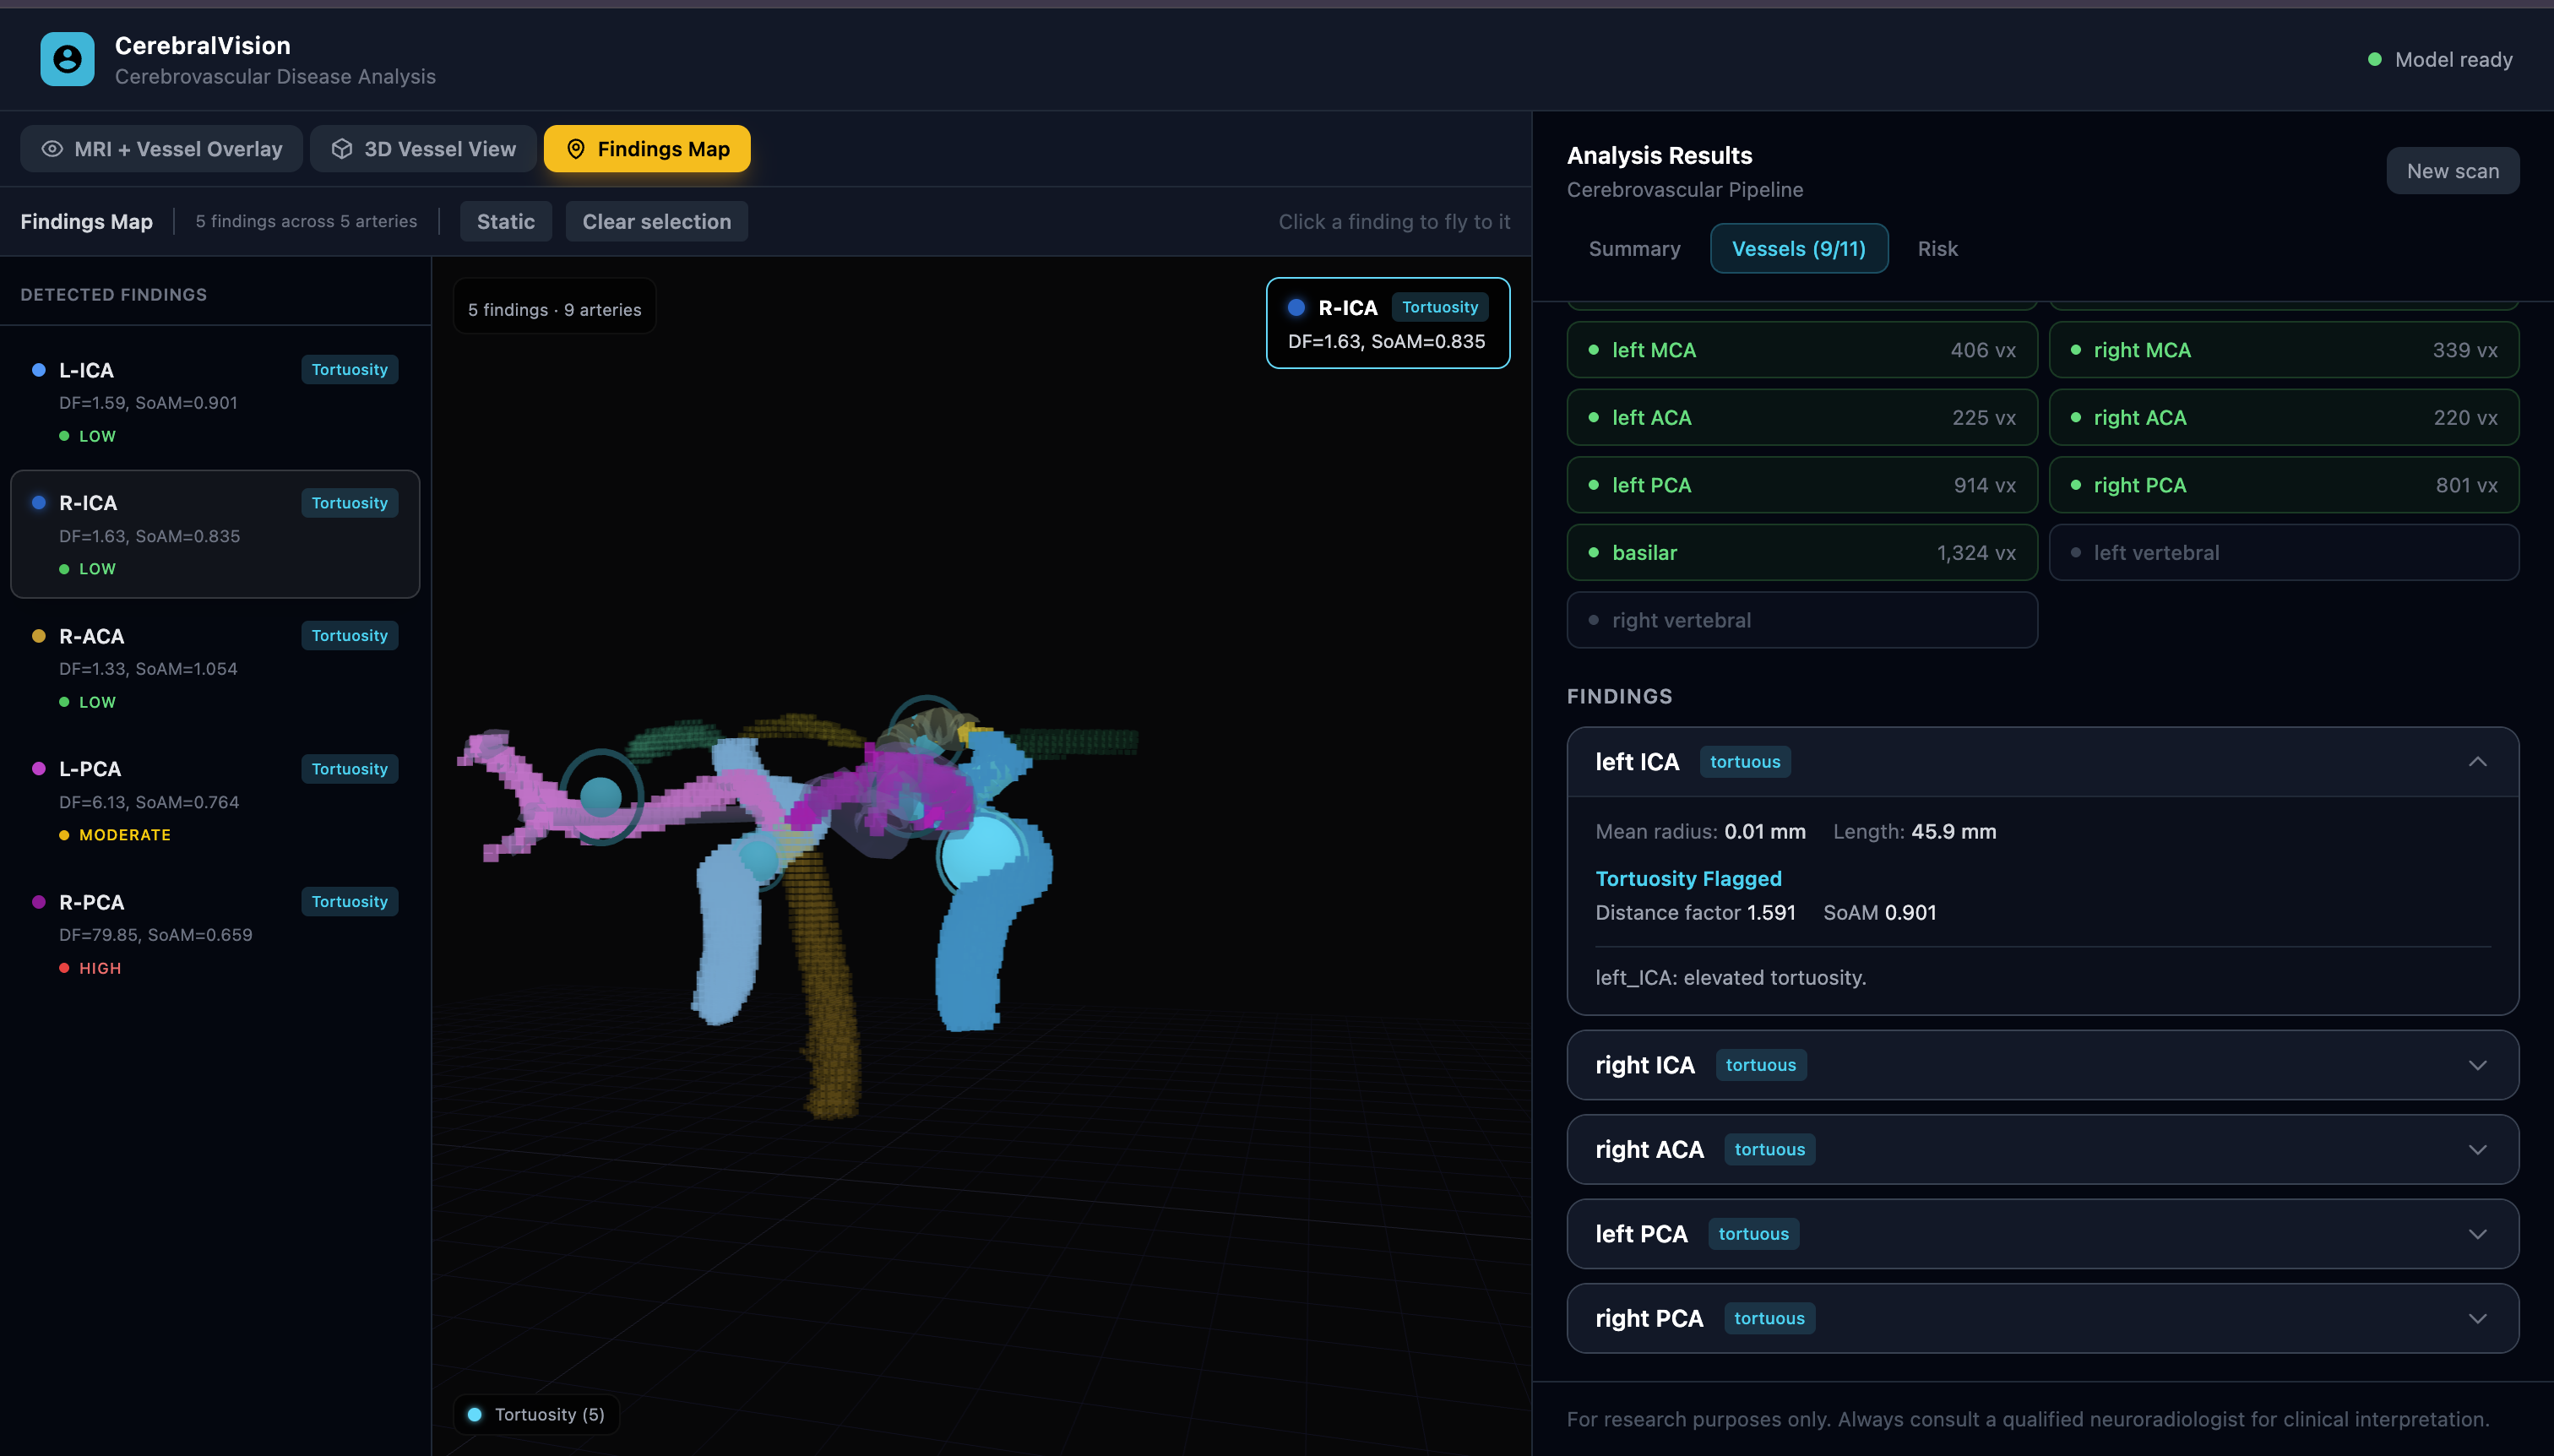
Brain CMRI Scan highlighting affected blood vessels
-
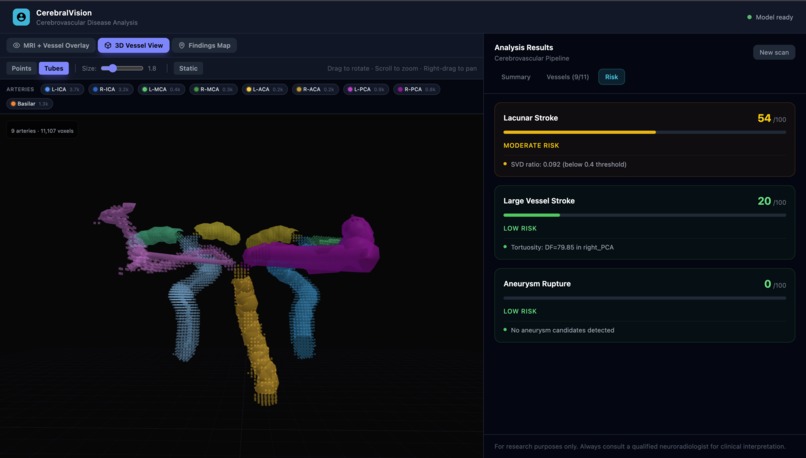
Blood Vessels Risk indicator
-
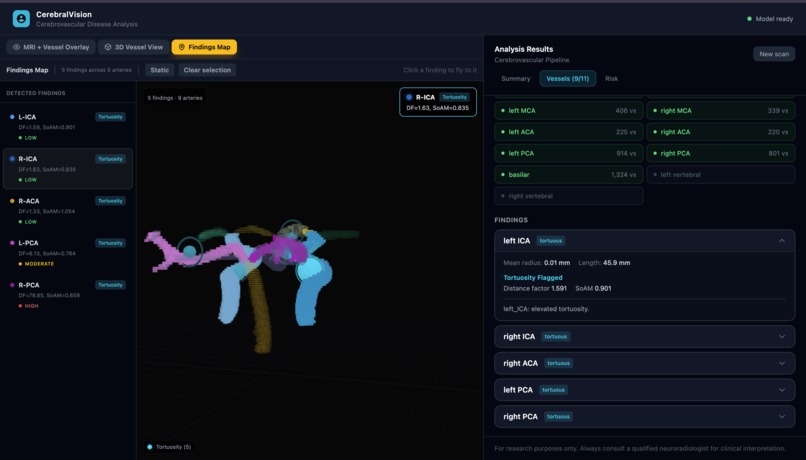
Blood Vessels Labels and detection
Inspiration:
Cerebrovascular disease remains the second leading cause of death globally, claiming seven million lives annually. While the precursors to stroke are often detectable on MRI scans years in advance, identifying these subtle markers is a monumental challenge. A single scan comprises half a billion voxels, yet the critical vessels represent less than one percent of that volume. For radiologists, this is a search for a needle in a digital haystack where the smallest findings are easily overlooked. We developed a solution to automate this search to provide a level of speed and precision that manual review simply cannot sustain.
What it does:
VascuSense is a cerebrovascular imaging analysis platform that transforms raw TOF-MRA neuroimaging data into a high-fidelity map of arterial health. By automating the segmentation and anatomical labeling of the Circle of Willis, the system performs a rigorous geometric analysis to detect critical structural risk features, including arterial stenosis, aneurysm candidates, tortuosity, and occlusions. Each detected anomaly is precisely scored and rendered in a detailed 3D environment, providing clinicians with an intuitive spatial understanding of where risks are located within the vessel tree. This analysis culminates in a generated clinical narrative that translates complex volumetric data into a concise summary of findings, ensuring that subtle warning signs are not only identified but effectively communicated for clinical decision-making.
How we built it:
The VascuSense architecture initiates with taking in .NIfTI data and utilizes the VesselBoost library to execute N4 bias correction, denoising, and high precision segmentation. Once a binary mask is established, the system employs eICAB or atlas based labeling to categorize major arterial segments, which provides the anatomical context required for skeletonization and distance transforms. By calculating the distance to the nearest boundary at each voxel, the system determines the true radius throughout the vessel tree, transforming the data into a queryable graph where nodes represent branch points and edges carry anatomical labels. The platform then grades arterial stenosis via the NASCET method by calculating narrowing as a percentage relative to a healthy distal segment. It further quantifies tortuosity through both the Distance Factor, defined as the ratio of actual path length to Euclidean distance, and the Sum of Angles Metric, which measures the cumulative angular change along the vessel. To assess small vessel disease, the system maps the data into the Montreal Neurological Institute coordinate system to evaluate vessel density within standardized regions of interest as a diagnostic proxy. Ultimately, these clinical features are synthesized into visual axial and coronal overlays and a Gemini API generated analysis. Subsequently, the system outputs probabilities for large vessel stroke, lacunar events, and aneurysm rupture.
Challenges we ran into:
Defining the correct json schema for communication between frontend and backend
Difficulty rendering the MRI since we had to write an algorithm that takes the slices and combine them into a 3D rendering
Trying to understand the biological aspect of this project, and evaluating what each metrics tell you before starting to build the data pipeline & processing. Without thorough understanding, we would be working in the blind and not know the structure of how data would be communicated between each module
Getting the local packages running. E.g. eICAP package installation reqauirements took a lot of debugging
Trying to build a deployable backend without knowing the computational complexity & took us a long time before we realize that we could create a mock json response (adhering to the schema), which contains real masking data from the data pipeline, and parsing the json data in the frontend instead of having to call the backend, since it took a very long time to run a predictive computational model on a CPU.
Accomplishments that we're proud of:
We were able to build a functional prototype from real MRI data that has been processed through the data computational pipeline in the backend. The backend was structured so that it would be easier to scale and deploy to GPU VMs in the future. Finally, we were able to render the masked data through three.js and were able to achieve in-depth analysis, which has similar findings to the labels of the sample MRI image derived from the dataset.
What we learned:
- Always test and find out the computational complexity / processing time of a pre-trained model before deciding on a communications protocol. E.g. Websocket would've been better for algorithms with higher processing time.
- It is very essential to understand the metrics, and how the data is manipulated through each stage of the data processing pipeline. This would give a clear intuitive view of how we can manipulate and extrapolate meaningful information from the data for further analysis.
- Always write out the software architecture with the team before starting to code. It is very important to explore libraries & concept, then come up with a solid schema for both frontend and backend to adhere to.
What's next for Cerebrovascular arterial blood vessel analysis:
Future developments will focus on rendering masked vessels directly onto the MRI volume using interactive controls to provide clinicians with comprehensive radiological context rather than an isolated 3D model. We'd like to establish a backend on a GPU-backed virtual machine since inference times must be reduced to support real-time diagnostic workflows. Furthermore, we aim to validate our anomaly scoring protocols against gold standard annotated datasets and explore the capacity of graph representations to facilitate longitudinal analysis. By tracking subtle shifts in vessel geometry across sequential scans, the platform could eventually monitor the progression of vascular disease over time.


Log in or sign up for Devpost to join the conversation.