-
-
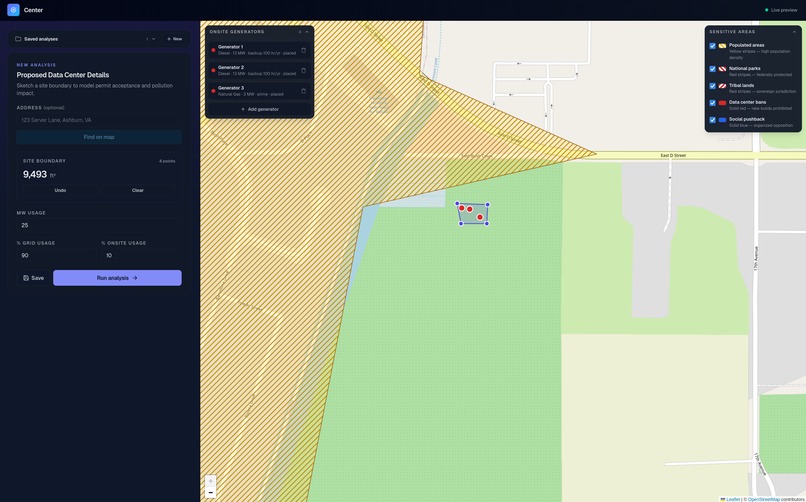
A 25 MW data center with three generators (two onsite, one backup) modeled in Centr.
-

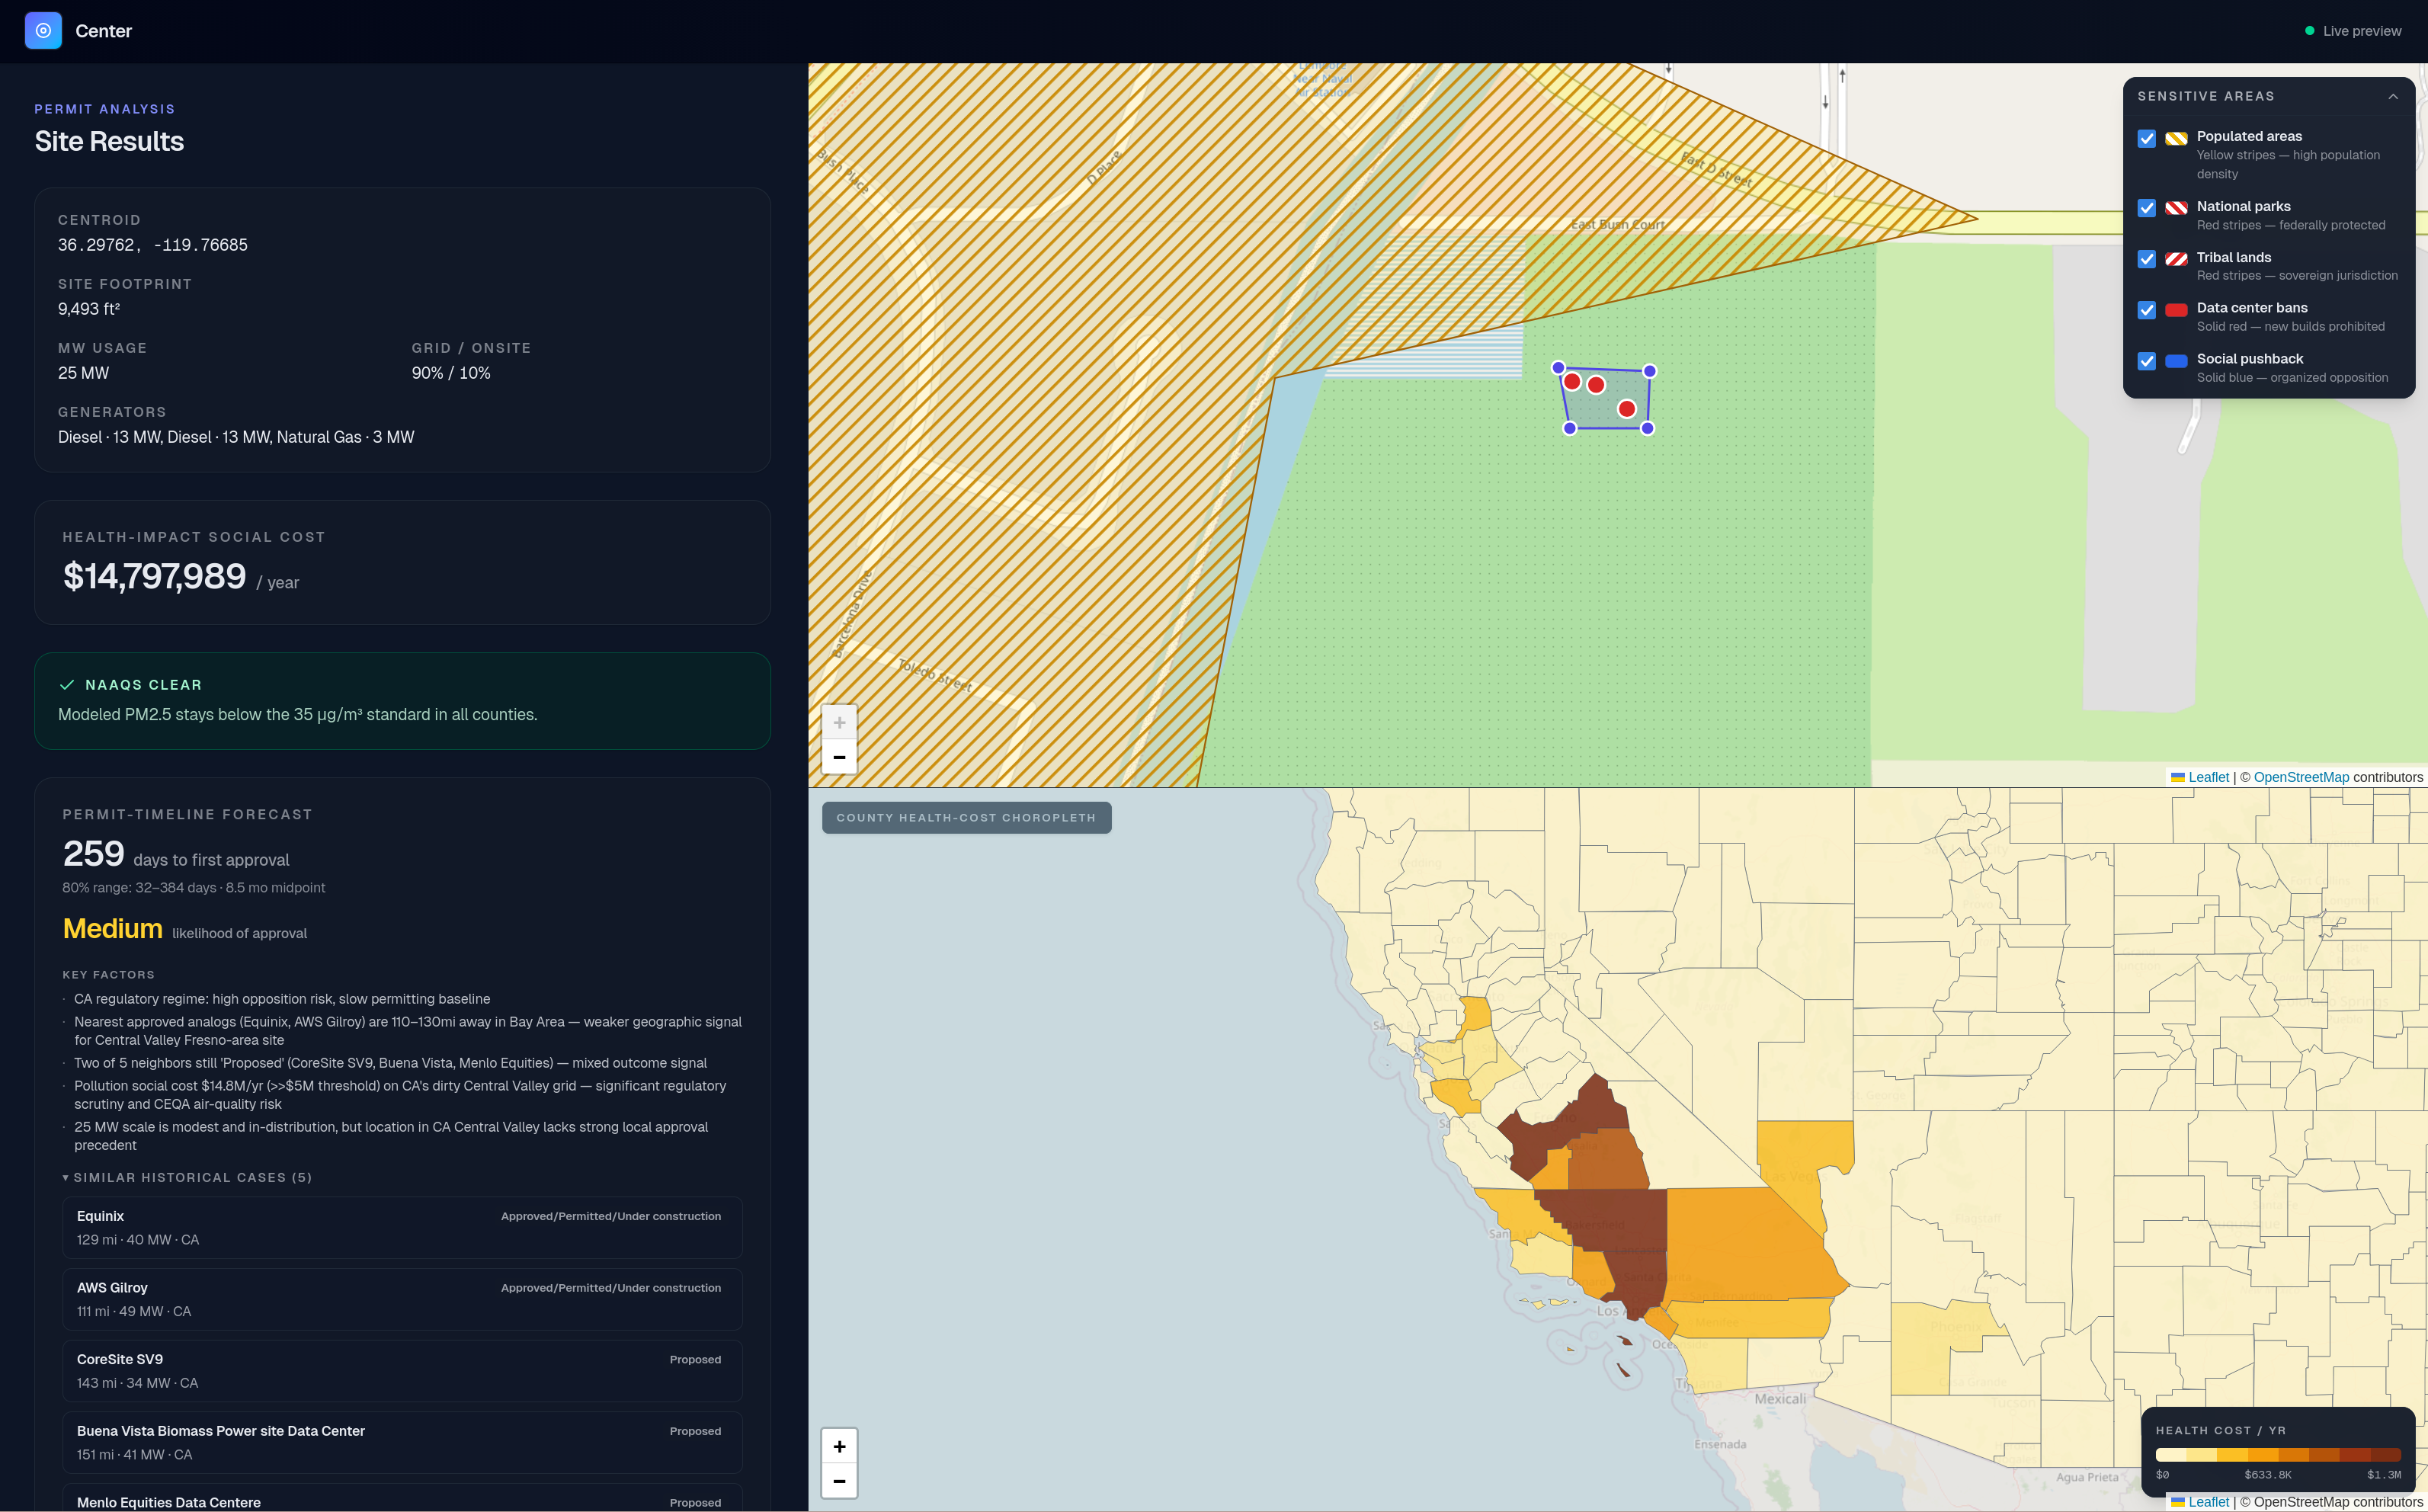
A 25 MW data center site analyzed with Centr. Health cost as a result of pollution; nearest real data centers; permit timeline & likelihood

Inspiration
Everyone is building with AI, but the infrastructure that powers it is facing a massive regulatory bottleneck. Permitting and construction delays cost data center developers nearly 15 million USD per month in lost revenue and increased costs: for a 60 MW project, these delays can result in $14.2 million per month in lost revenue, with an additional $1.8 million per month in financing costs (research from STL Partners).
Not only that, but media attention is shifting to data centers, their effects on neighboring communities, and their impact on the electrical grid. Data center developers need to make decisions quickly with respect to dozens of variables: social opposition, economic & health cost as a result of pollution, population density, and local, state, and federal regulations, just to name a few. We have experience working in data center power flow optimization, so we felt compelled to tackle this problem and create the first analytics platform for data center developers. Our hope is that this software can cut down on permit delays and long-term pollution, driving down costs and speeding up data center construction.
What it does
On Centr, data center developers can map out future data center projects while avoiding sensitive areas, inputting variables like location, total megawatt usage, backup/primary generators (diesel / natural gas), and how much power is expected to be pulled from the electrical grid and onsite generators. Using an EPA-endorsed air dispersion model, Centr then calculates the expected pollution output of the data center and translates it to health costs and potential regulatory issues. Centr then compares any hypothetical data center with a dataset of historical data center projects to predict a timeline for the data center's first permit. This allows data center developers to rapidly prototype and explore the feasibility of multiple potential locations, saving labor costs, health costs, and permitting delays down the road.
How we built it
We started by using OpenStreetMap as the basis of our UI, building our front end with Next.js and Tailwind. We also developed our own dataset of data centers in the US, including time from proposal to their first permit being approved by a regulatory committee (check the next section for specifics).
Using our own Python implementation with JAX and NumPy, we integrated the EPA model COBRA, which allowed us to model the health costs from generator pollution (for electricity grid pollution, we used the EPA's eGRID). This gave us the ability to model economic cost as a result of pollution for any hypothetical data center in the US with very few input parameters, and also allowed us to evaluate whether a data center passed NAAQS.
We then used our permit timeline dataset to approximate the permit time for any data center by using a k-NN (k nearest neighbors) approach and taking the average value of the nearest k neighbors. Using the hypothesis that data centers in the same area would have similar permit timelines due to similar regulatory environments, we were able to generate permit timelines that matched closely to real-world projects. Additionally, we implemented Claude Sonnet as a regulatory assistant, which allowed Centr to provide an accurate assessment of the probability of a data center permit being approved and any insights specific to the region a data center is located in.
Challenges we ran into
By far, most of the problems that we came across in the development of Centr were on how to curate data and make our calculations reliable. Mainly, we noticed a massive gap in permit timeline data: a lot of data center permit applications were submitted under shell LLCs on the behalf of large players like Amazon and Meta, and accurate timeline data was locked down by extremely expensive subscription services (in the orders of tens of thousands of dollars). So, how did we curate a dataset of permit timeline data?
Since media coverage of proposed data center projects (and social scrutiny) was the highest its ever been for large data center projects, we decided that web scraping media articles would be a good option. Using the FracTracker dataset of data centers in the US as a starting point, we keyword matched data center names to media articles and parsed them through an LLM model to convert each one into a JSON if it covers regulatory events. We found an average of three news articles covering regulatory events / procedures for every data center, giving us a good approximation of permit timelines for around 1000 data centers in the US.
Accomplishments that we're proud of
- Coalescing vast amounts of data from multiple sources (the EPA, US Census, Data.gov, and news / media sources) to create realistic analytics
- Accurate pollution modeling of any hypothetical data center in the US to inform location decisions and reduce the health impact of data centers on communities
- Creating our own permit timeline dataset based off of media articles to fill a massive data gap
What we learned
We learned a lot about the regulatory environment of data centers in the US, which will help us inform our next steps as we turn Centr into a full product for the data center industry. Additionally, we learned how to "think on our feet" to fill gaps in data, and how to turn snippets of data in a lot of different places into something worth building.
What's next for Centr
Applying grid overhead data; fully scraping all regulations on data centers and their operations in a local/municipality, state, and federal level; curating a larger dataset of data center projects to increase accuracy for predictive permit timing; market research and developing a product / service to replace traditional data center consultants in the space


Log in or sign up for Devpost to join the conversation.