-
-
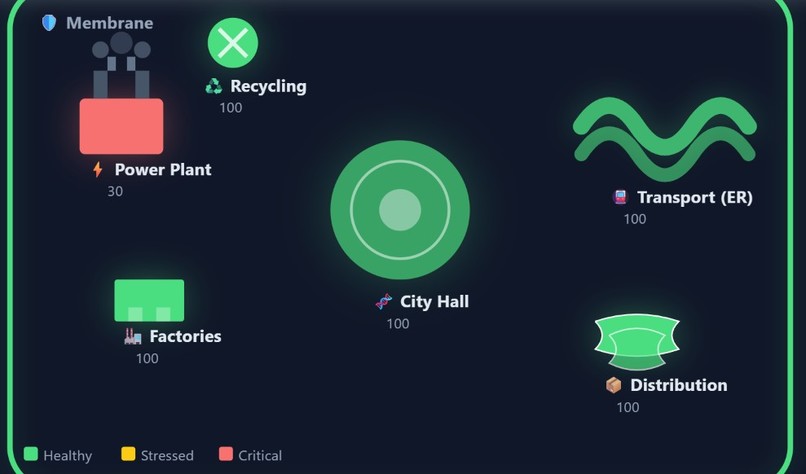
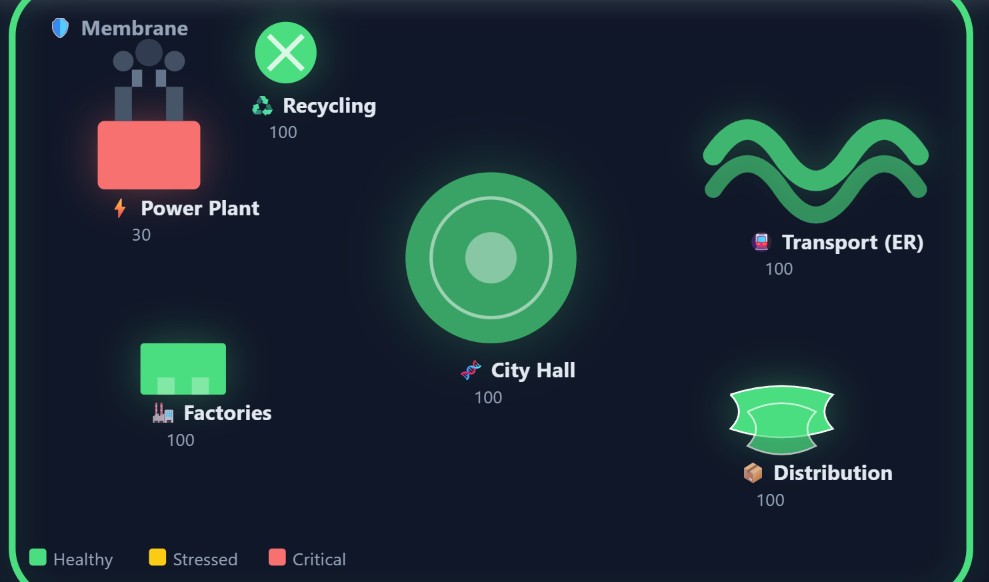
Cell City visualization with tooltip open
-
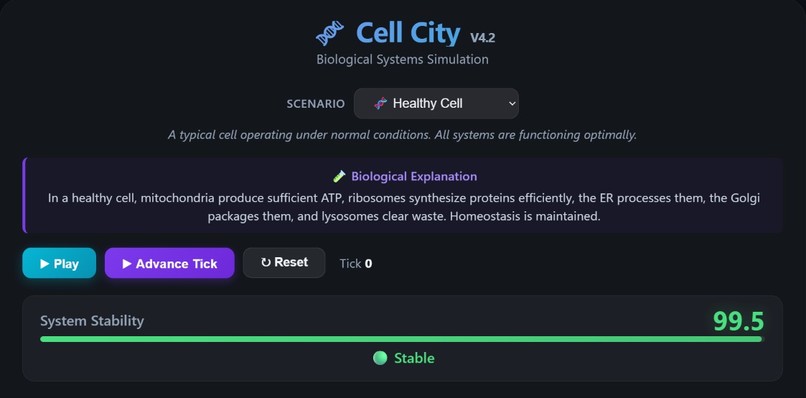
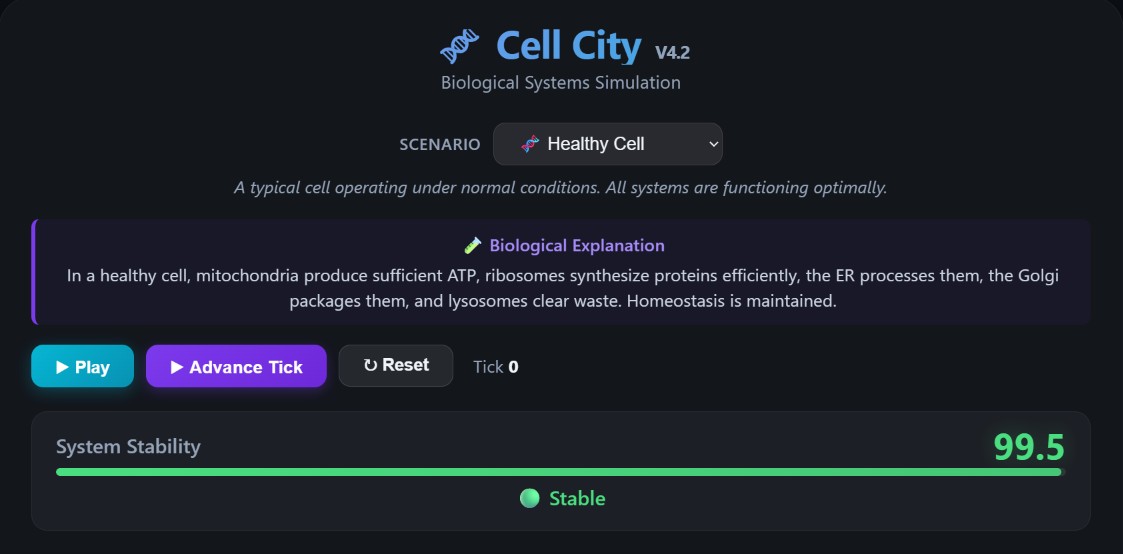
Main dashboard with Stability Indicator at 100%
-
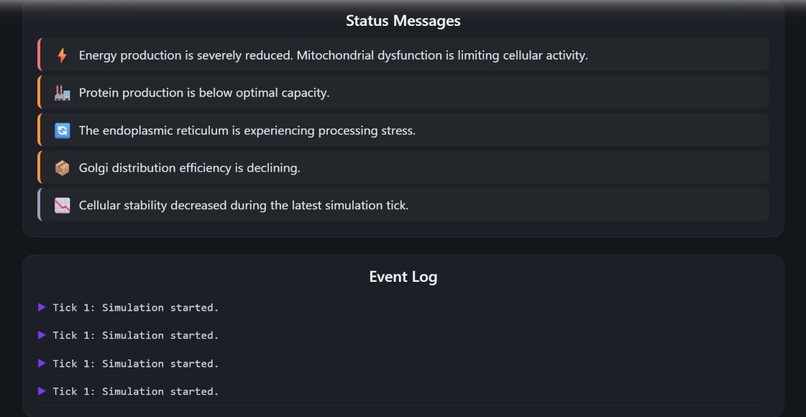
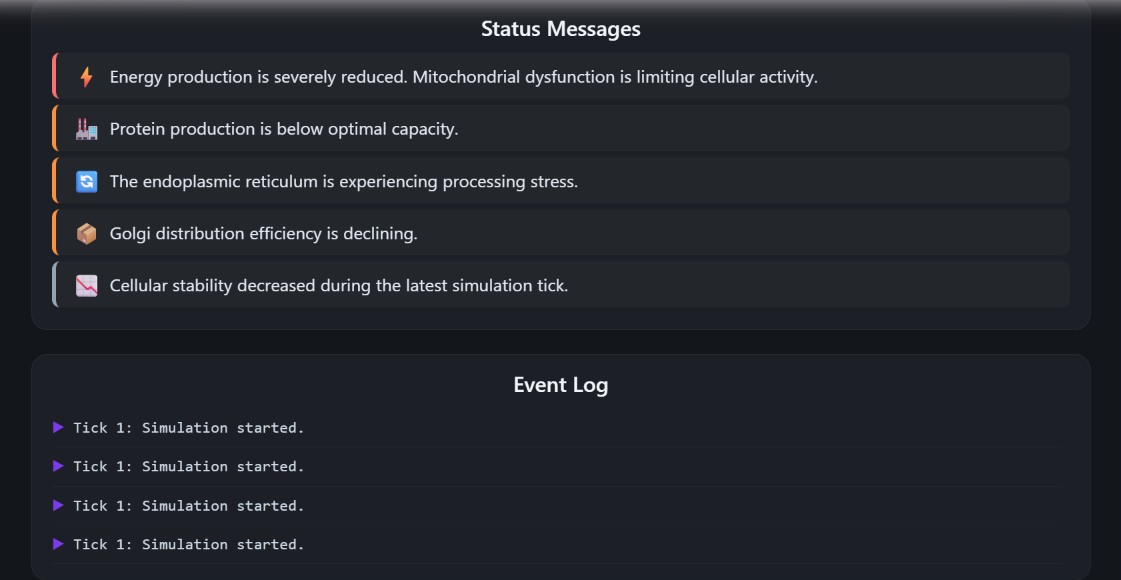
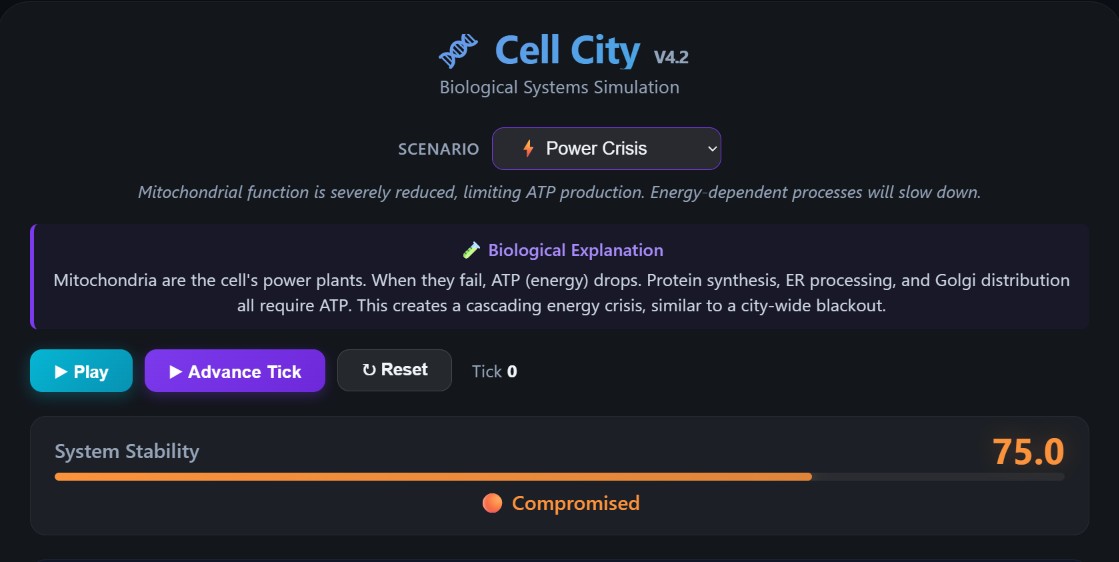
Scenario dropdown and Educational Note + Event Log showing tick-by-tick changes
-
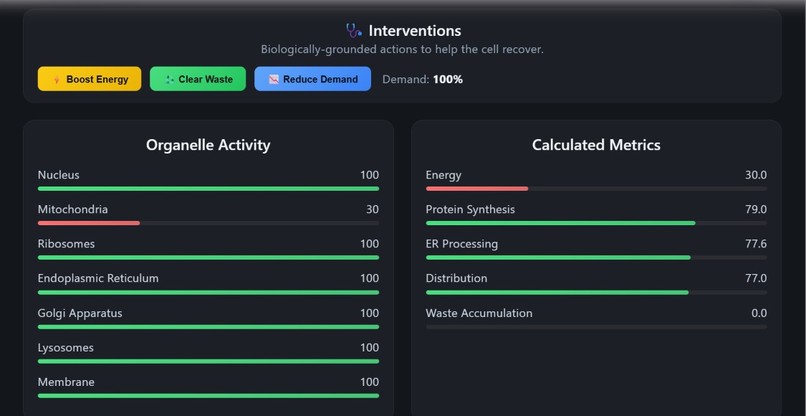
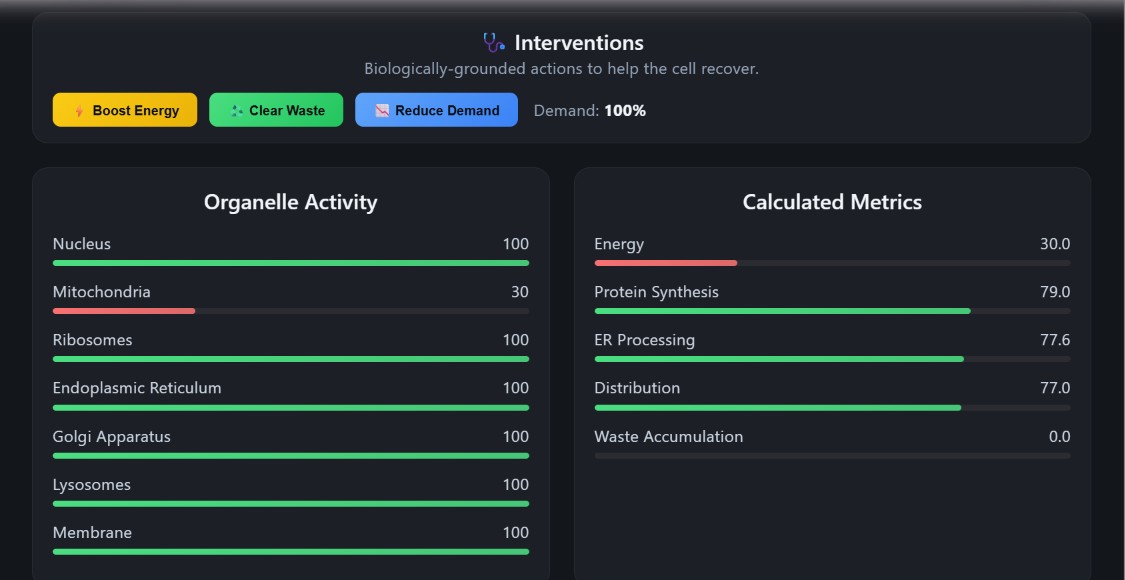
Interventions panel in action + Metrics Panel (energy, protein synthesis, etc.)
-
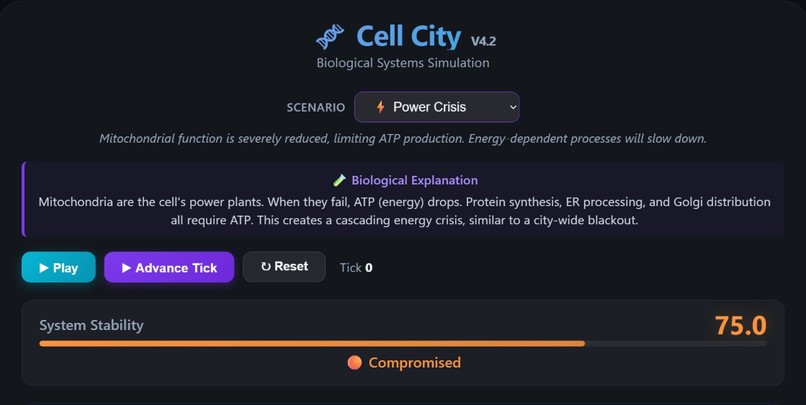
Power Crisis scenario showing cascade
Inspiration
Cell biology is fascinating, but traditional textbooks and static diagrams fail to convey one crucial truth: a cell is not a collection of independent parts—it's an interconnected system. When one organelle fails, the effects cascade through the entire cell like a domino effect.
We wanted to build something that makes this intuitive. Instead of memorizing organelle functions, we wanted to let students see what happens when mitochondria fail, when waste builds up, or when protein production becomes overloaded.
The city metaphor emerged naturally: mitochondria are power plants, ribosomes are factories, the ER is a transport network, and lysosomes are recycling centers. A city's collapse mirrors a cell's collapse.
What it does
Cell City is an interactive biological simulation that demonstrates how cellular systems interconnect and how dysfunction propagates.
Users can:
- Choose from 4 scenarios: Healthy Cell, Power Crisis, Factory Overload, or Recycling Failure
- Watch cascading effects in real-time as organelle dysfunction propagates through biological pathways
- Click on city buildings to learn about each organelle
- Apply interventions (Boost Energy, Clear Waste, Reduce Demand) to rescue the cell
- Track changes via the Event Log and Stability Indicator
The simulation uses a deterministic tick-based engine where:
- Persistent state tracks organelle health (0-100)
- Biological rules calculate metrics (energy, protein synthesis, ER processing, distribution, waste)
- Degradation is progressive and causal, not instantaneous
- Recovery is conservative and biologically plausible
How we built it
Technologies:
- React + Vite for the frontend
- Custom simulation engine with separate layers for:
- State management (
cellState) - Calculations (
calculations.js) - Biological rules (
rules.js) - Scenario definitions (
scenarios.js)
- State management (
- Pure CSS with glass-morphism dark theme
- SVG-based city visualization
Architecture Philosophy: We followed a strict separation of concerns:
- State → What exists (organelle values, waste accumulation)
- Metrics → What's calculated from state (energy, stability, homeostasis)
- Rules → What happens next (degradation, recovery)
- UI → Displays results, contains NO biological logic
This makes the simulation deterministic, debuggable, and extensible.
Challenges we ran into
State vs Metrics Separation: Early versions mixed calculated values with persistent state, causing confusing bugs. We had to rigorously separate "what exists" from "what's derived."
Biological Cascade Logic: Ensuring the cascade worked predictably across all scenarios required careful tuning of degradation rates and dependency weights. Energy stress → protein synthesis → ER stress → Golgi stress had to feel natural.
Tooltip Positioning: The city visualization uses SVG with scaling, and positioning tooltips at the exact cursor location required switching from fixed positioning to absolute positioning relative to the container with proper coordinate calculation.
UI Balance: Making the interface visually engaging without overwhelming the user was a constant challenge. We iterated from raw JSON dumps to a polished dark theme with glass-morphism.
Accomplishments that we're proud of
- Working biological cascade: Mitochondrial stress propagates through energy → protein → ER → Golgi exactly as intended
- V4.2 stability classification: Four distinct statuses (Stable, Stressed, Compromised, Critical) with smooth transitions
- Interactive city: Every building is clickable with educational tooltips
- Intervention system: Biologically-grounded actions let users "rescue" the cell
- Clean architecture: UI, simulation logic, and calculations are completely separated
- Event log: Tick-by-tick tracking of changes for educational clarity
What we learned
Biology:
- Mitochondrial health directly impacts energy availability, which cascades to all energy-dependent processes
- Waste accumulation is a slow poison that degrades overall cellular health
- Recovery is asymmetric—cells heal slowly, but can degrade quickly under stress
Software Engineering:
- Separation of concerns is non-negotiable for complex simulations
- Deterministic state transitions are essential for debugging
- SVG is surprisingly powerful for interactive visualizations
- Good architecture documentation saves countless hours
What's next for Cell City
Phase 3 — Explainability (V4.4):
- Causal event log with "why did this happen?" explanations
- Dependency visualization
- Biological annotations on every metric
Phase 4 — Intervention (V5):
- More interventions (membrane repair, protein support, etc.)
- Recovery scenarios
- Compare intervention vs no-intervention
Phase 5 — Visualization (V5.x):
- Animated city with pulsing buildings
- Energy flow visualization
- Stress heat maps
Phase 6 — Educational Platform (V6+):
- Guided lessons
- Challenges and missions
- Experiment mode
- Student dashboards
- Save/share simulations
Built With
- biological-simulation
- css3
- educational-technology
- interactive-learning
- javascript
- react
- svg
- system-dynamics
- vite
- web-app

