-
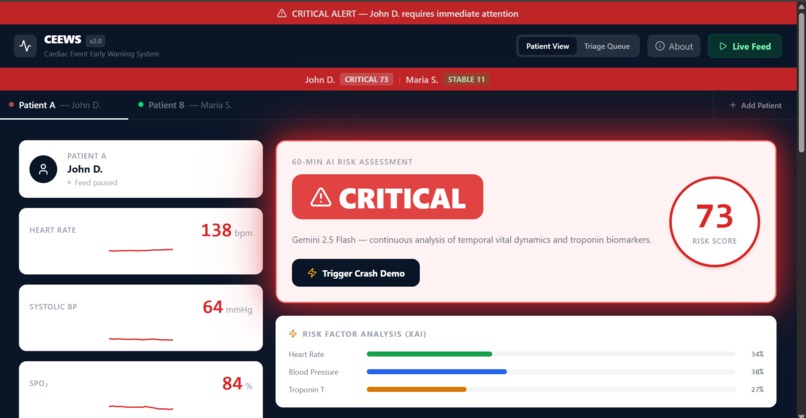
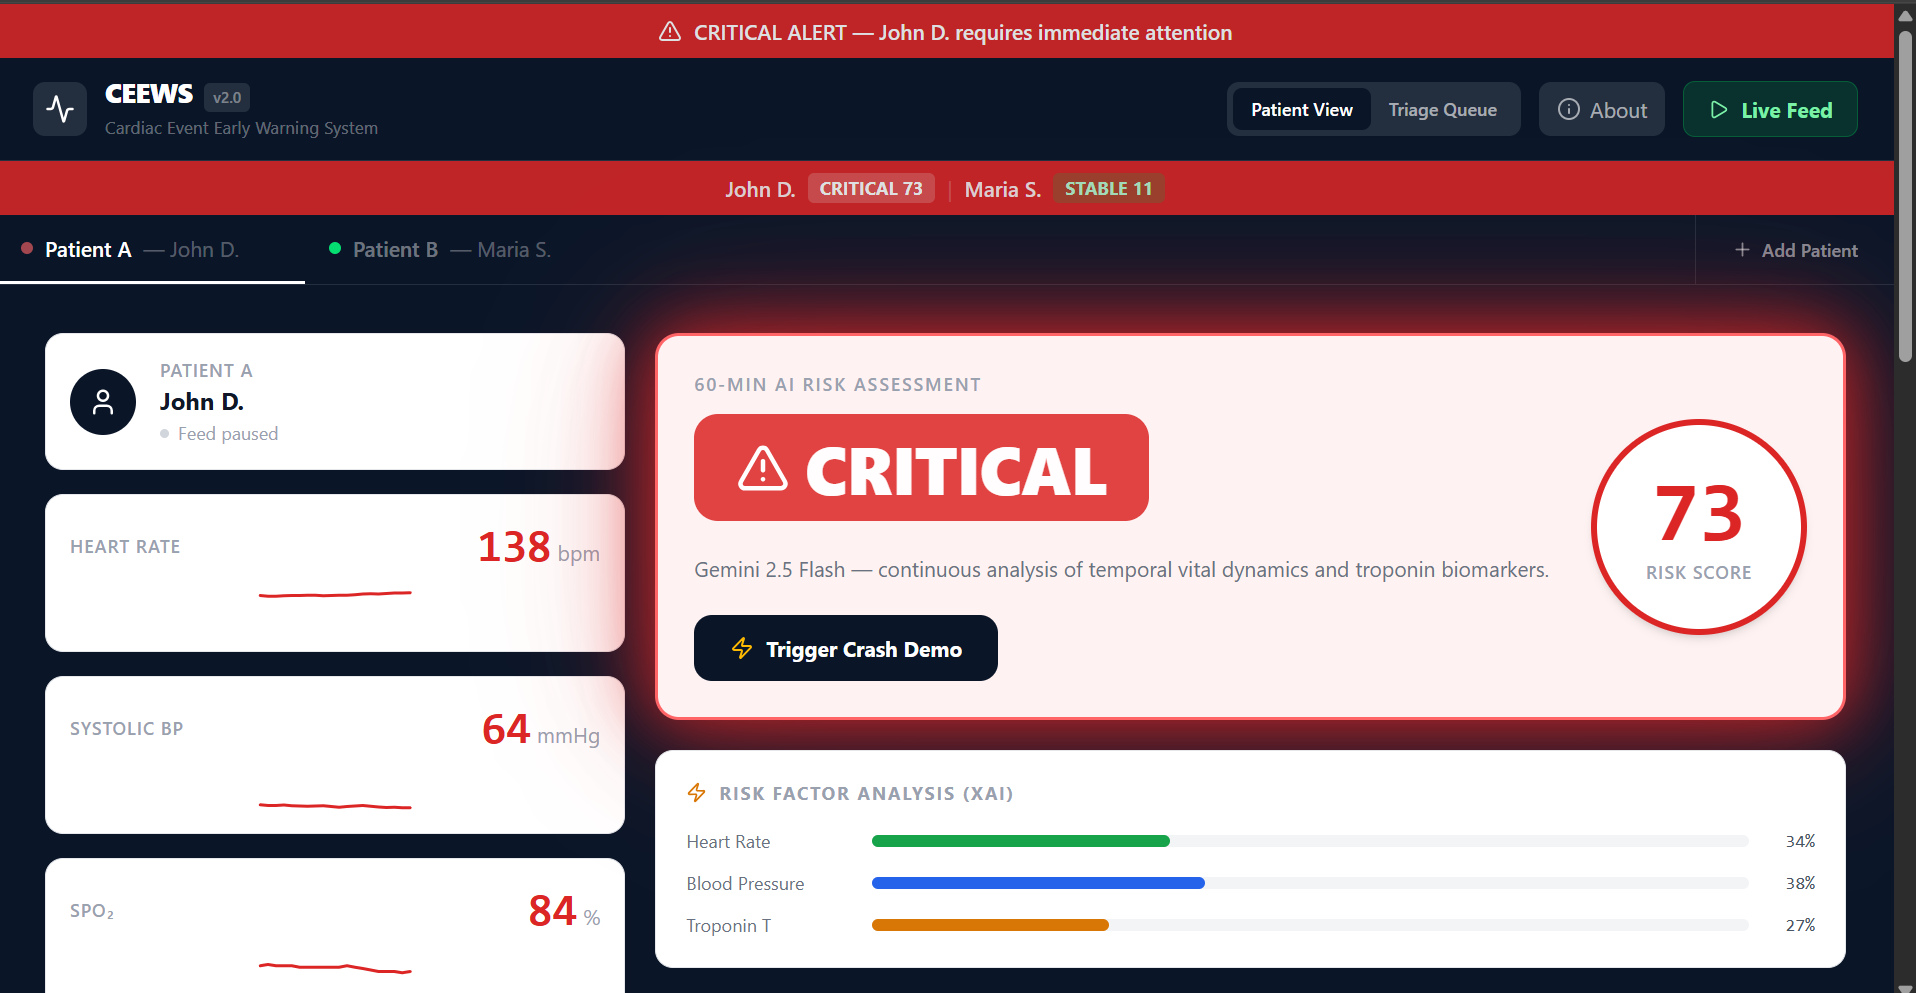
CEEWS — CRITICAL alert with risk score 73, XAI breakdown, and multi-patient monitoring live.
Inspiration
In a busy emergency room, a physician managing multiple critical patients simultaneously can miss the early warning signs of a cardiac event. Every minute of delayed intervention costs approximately 2 million heart muscle cells. CEEWS was built to give ER doctors a 10-minute head start by surfacing risk before vitals reach crisis levels.
What it does
CEEWS is a real-time multi-patient cardiac monitoring dashboard for emergency rooms. It simulates continuous patient telemetry (heart rate, blood pressure, SpO₂, troponin) and uses a weighted risk scoring algorithm to calculate a 0–99 cardiac risk score per patient.
When risk elevates, Google Gemini 2.5 Flash generates a structured clinical assessment with 5 prioritized recommendations. A triage queue ranks all active patients by risk score so the most critical patient is always visible first. Every AI assessment is persisted to Firebase Firestore, and doctors can attach clinical notes to individual incidents.
Key Features:
- Multi-patient monitoring — up to 6 simultaneous patients
- Real-time risk scoring (0–99) with trend multipliers
- AI Clinical Advisory powered by Google Gemini 2.5 Flash
- Risk Contribution Analysis — shows each vital's % contribution to risk in real time
- Triage Queue — patients ranked by risk, most critical first
- Incident History — every assessment persisted to Firestore
- Doctor Notes — clinicians can annotate individual incidents
- Vital Trend Alerts — flags sustained deterioration over 10+ readings
- Assessment Export — printable clinical summary per incident
- Crash Demo Mode — simulates rapid hemodynamic collapse
How the Risk Score Works
The risk engine is a weighted algorithm combining three vital deviations:
$$score = \min\left(\frac{w_{HR} + w_{BP} + w_{trop}}{300} \times 100,\ 99\right)$$
Where:
- \( w_{HR} = |HR - 75| \times 1.2 \) (multiplied by 1.5 if rising trend)
- \( w_{BP} = |120 - BP| \times 1.5 \) (multiplied by 1.8 if falling trend)
- \( w_{trop} = \frac{troponin}{0.1} \times 100 \)
Scores below 30 are Stable, 30–69 are Moderate Risk, 70+ are Critical. The Risk Contribution Analysis panel shows each vital's percentage contribution in real time, making the algorithm completely transparent to clinicians.
How we built it
Built as a React 19 single-page application with Tailwind CSS for styling and Vite as the build tool.
The AI layer uses Google Gemini 2.5 Flash via the @google/genai
SDK. Gemini receives structured vital signs, trend data, and risk scores,
and returns clinical assessments in a strict ASSESSMENT / RECOMMENDATIONS
format that the app parses and renders as actionable clinical cards.
Firebase Firestore handles real-time persistence via onSnapshot
listeners — every Gemini assessment is written to the cloud instantly and
synced live across the dashboard. The app is hosted on Firebase Hosting.
Clinical Validation Considerations
The risk scoring weights (HR deviation × 1.2, BP deviation × 1.5, troponin elevation × 100) are calibrated heuristically for this proof-of-concept. A production deployment would validate these weights against labeled ER datasets like MIMIC-III and compare performance to established clinical scoring systems such as HEART score, TIMI, and GRACE. The algorithm's trend multipliers — which increase weight when vitals are actively deteriorating — represent a novel approach that would require clinical trial validation before deployment.
Challenges we ran into
- Designing a risk scoring algorithm that reflects real clinical logic — incorporating not just absolute vital values but trend multipliers for worsening trajectories
- Prompt engineering Gemini to return consistently structured clinical output that could be reliably parsed into assessment text and numbered recommendations
- Managing independent real-time telemetry state for up to 6 simultaneous patients without performance degradation
- Keeping the UI readable for clinical users under stress — every design decision was made through the lens of a tired ER doctor at 3am
- Refactoring a 1,290-line monolithic component into a clean, modular architecture with eight focused components while maintaining all functionality
Accomplishments we're proud of
- A fully deployed, multi-patient ER dashboard built solo in 12 hours by a first-time hackathon participant
- Risk Contribution Analysis breakdown — making the algorithm transparent to clinicians in real time, something no commercial monitoring product does
- Gemini 2.5 Flash producing genuinely structured clinical assessments that read like real physician notes
- Clean, clinical UI designed specifically for high-stress ER environments
- Component architecture that separates concerns and would hold up in a production code review
What we learned
This was my first hackathon and my first web application. I came in with a data science and electrical engineering background and no frontend experience. I learned React, Firebase, and full-stack deployment in a single day — and discovered that domain expertise in data science translates directly into building smarter, more meaningful AI applications. I also learned the importance of architectural refactoring: starting with a working monolith and then decomposing it into maintainable components.
What's next for CEEWS
- Integration with HL7 FHIR APIs for real bedside monitor feeds
- Role-based authentication via hospital SSO (Epic integration)
- Validation of the risk algorithm against the MIMIC-III clinical dataset
- Firestore security rules and HIPAA-compliant data handling
- Mobile-responsive layout for bedside tablet use
- Multi-turn conversation with Gemini to track patient trajectory over time

Log in or sign up for Devpost to join the conversation.