Content warning: this project relates to suicide statistics. Nothing graphic is mentioned, but please read at your own discretion and consult any of the following crisis resources if necessary.
National Suicide Prevention Lifeline: 800-273-8255
Crisis Text Line: Text HOME to 741741
Inspiration
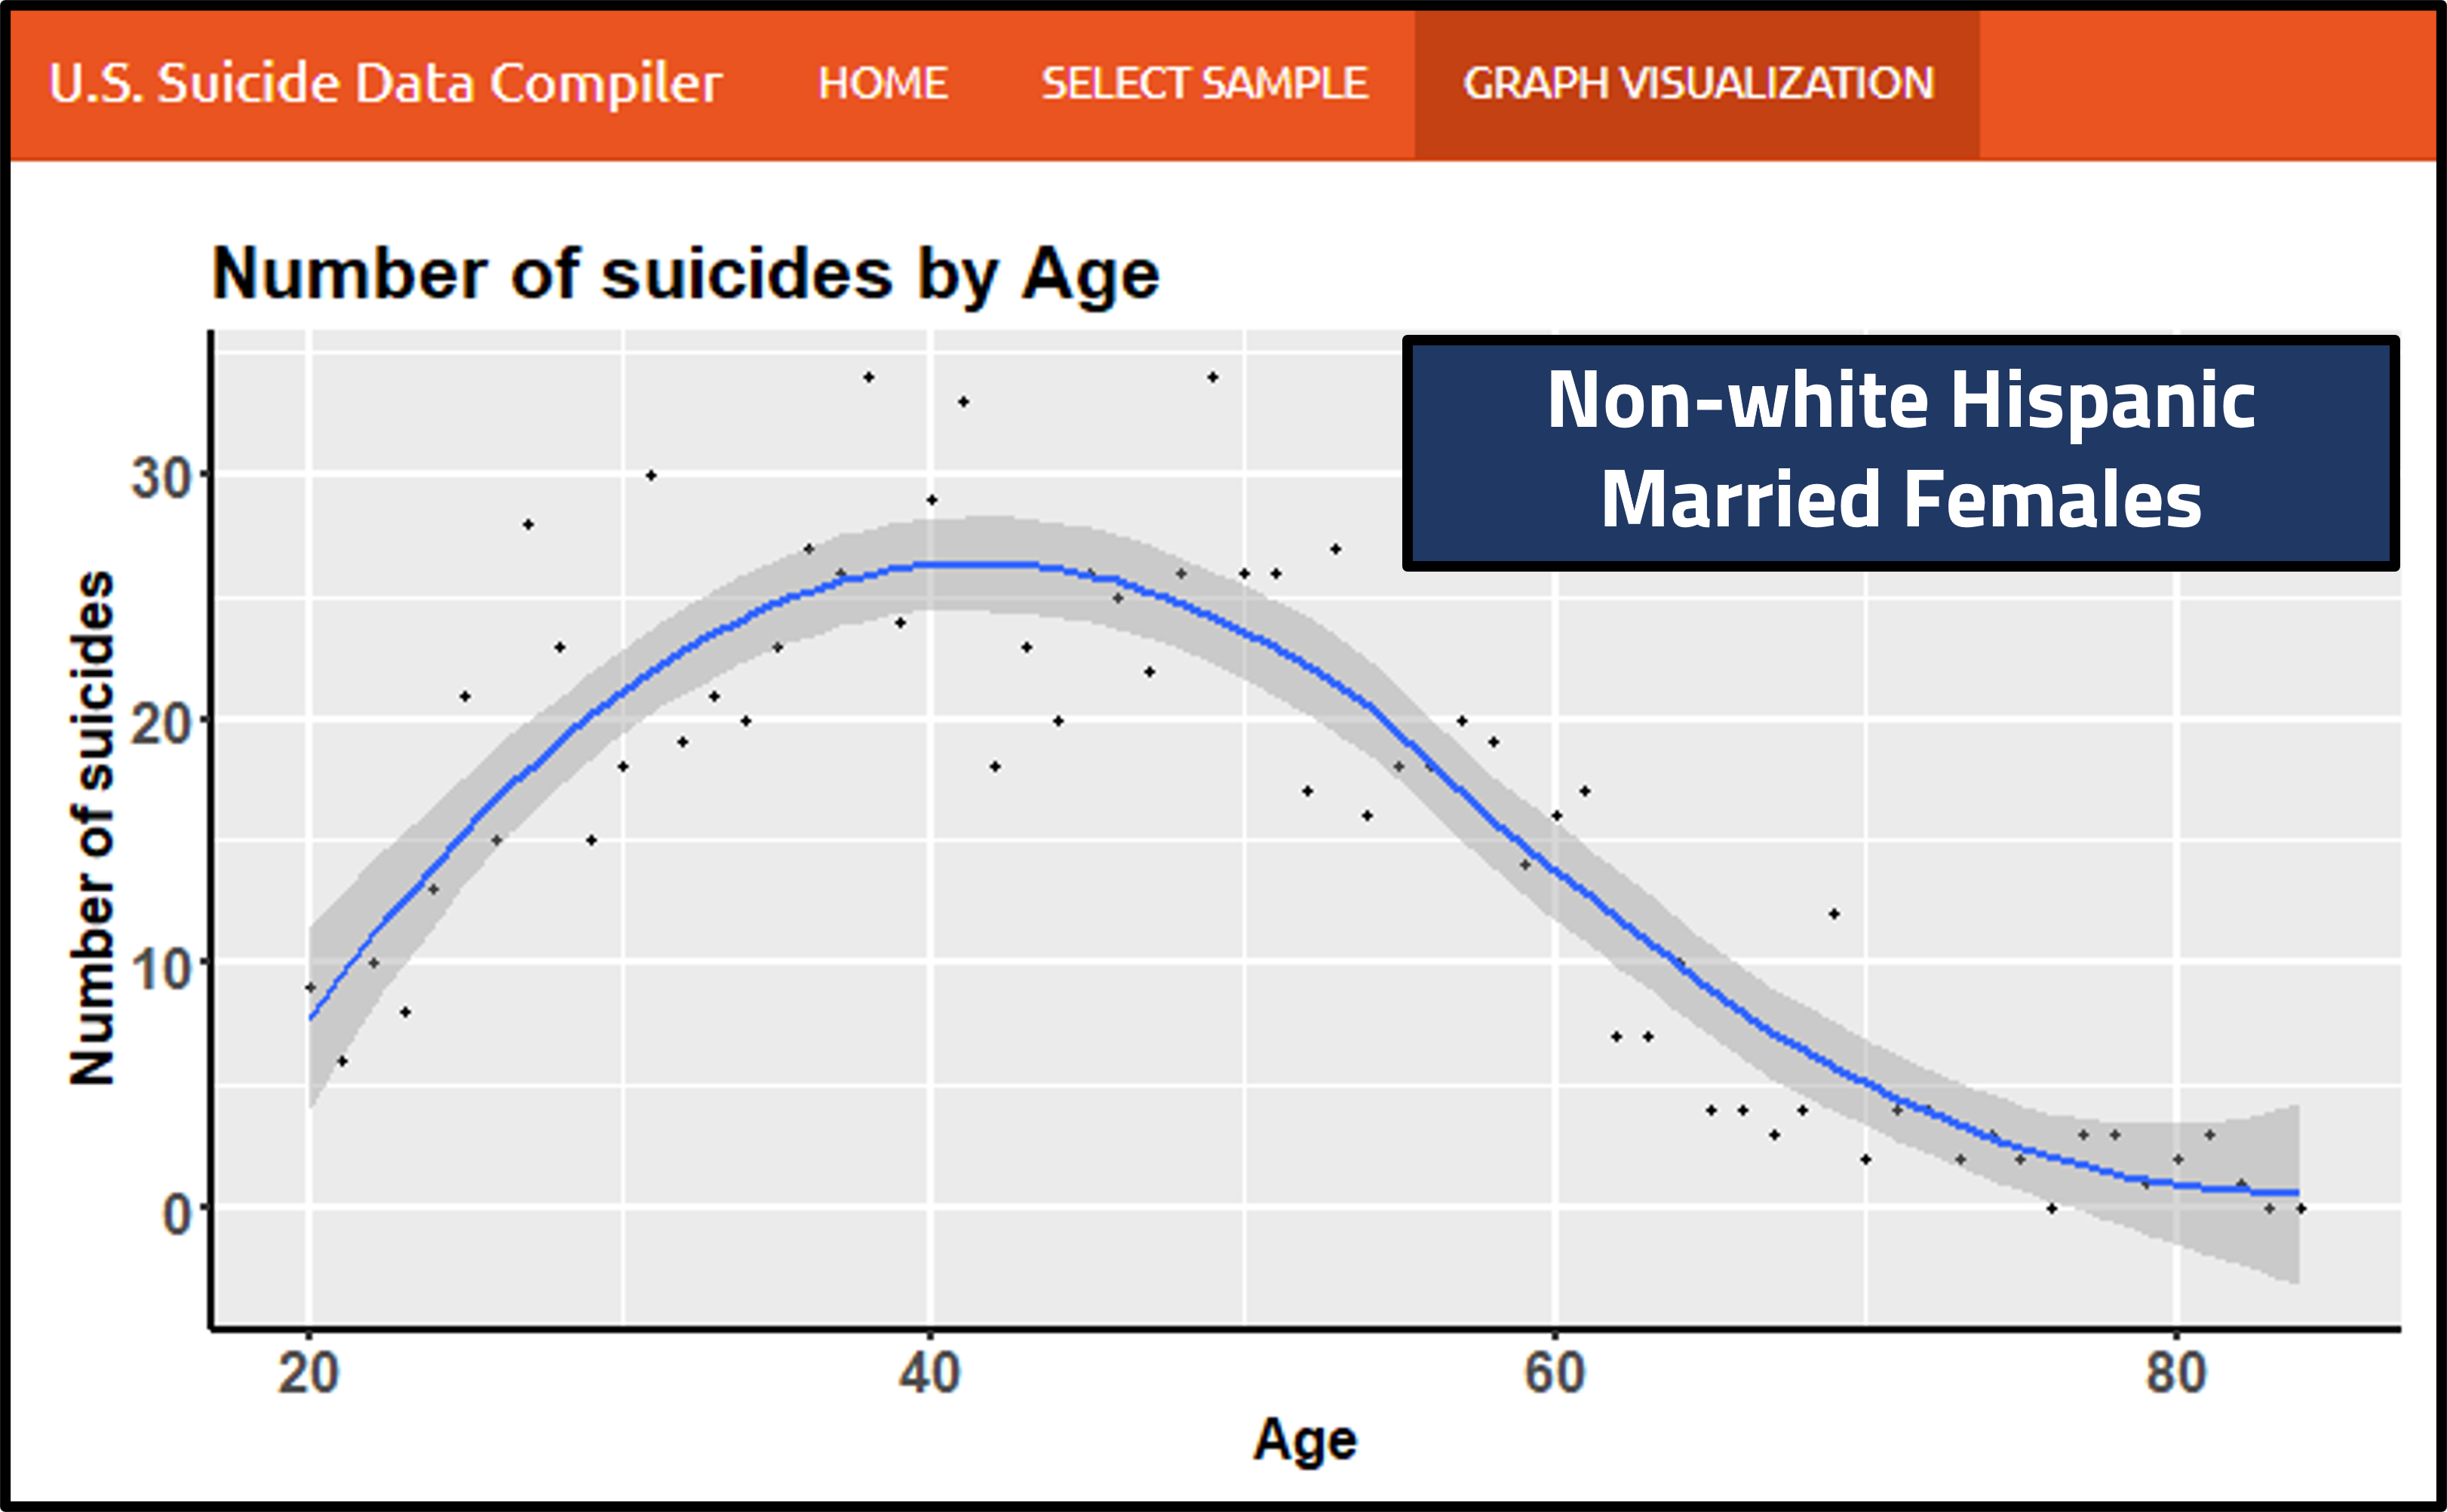
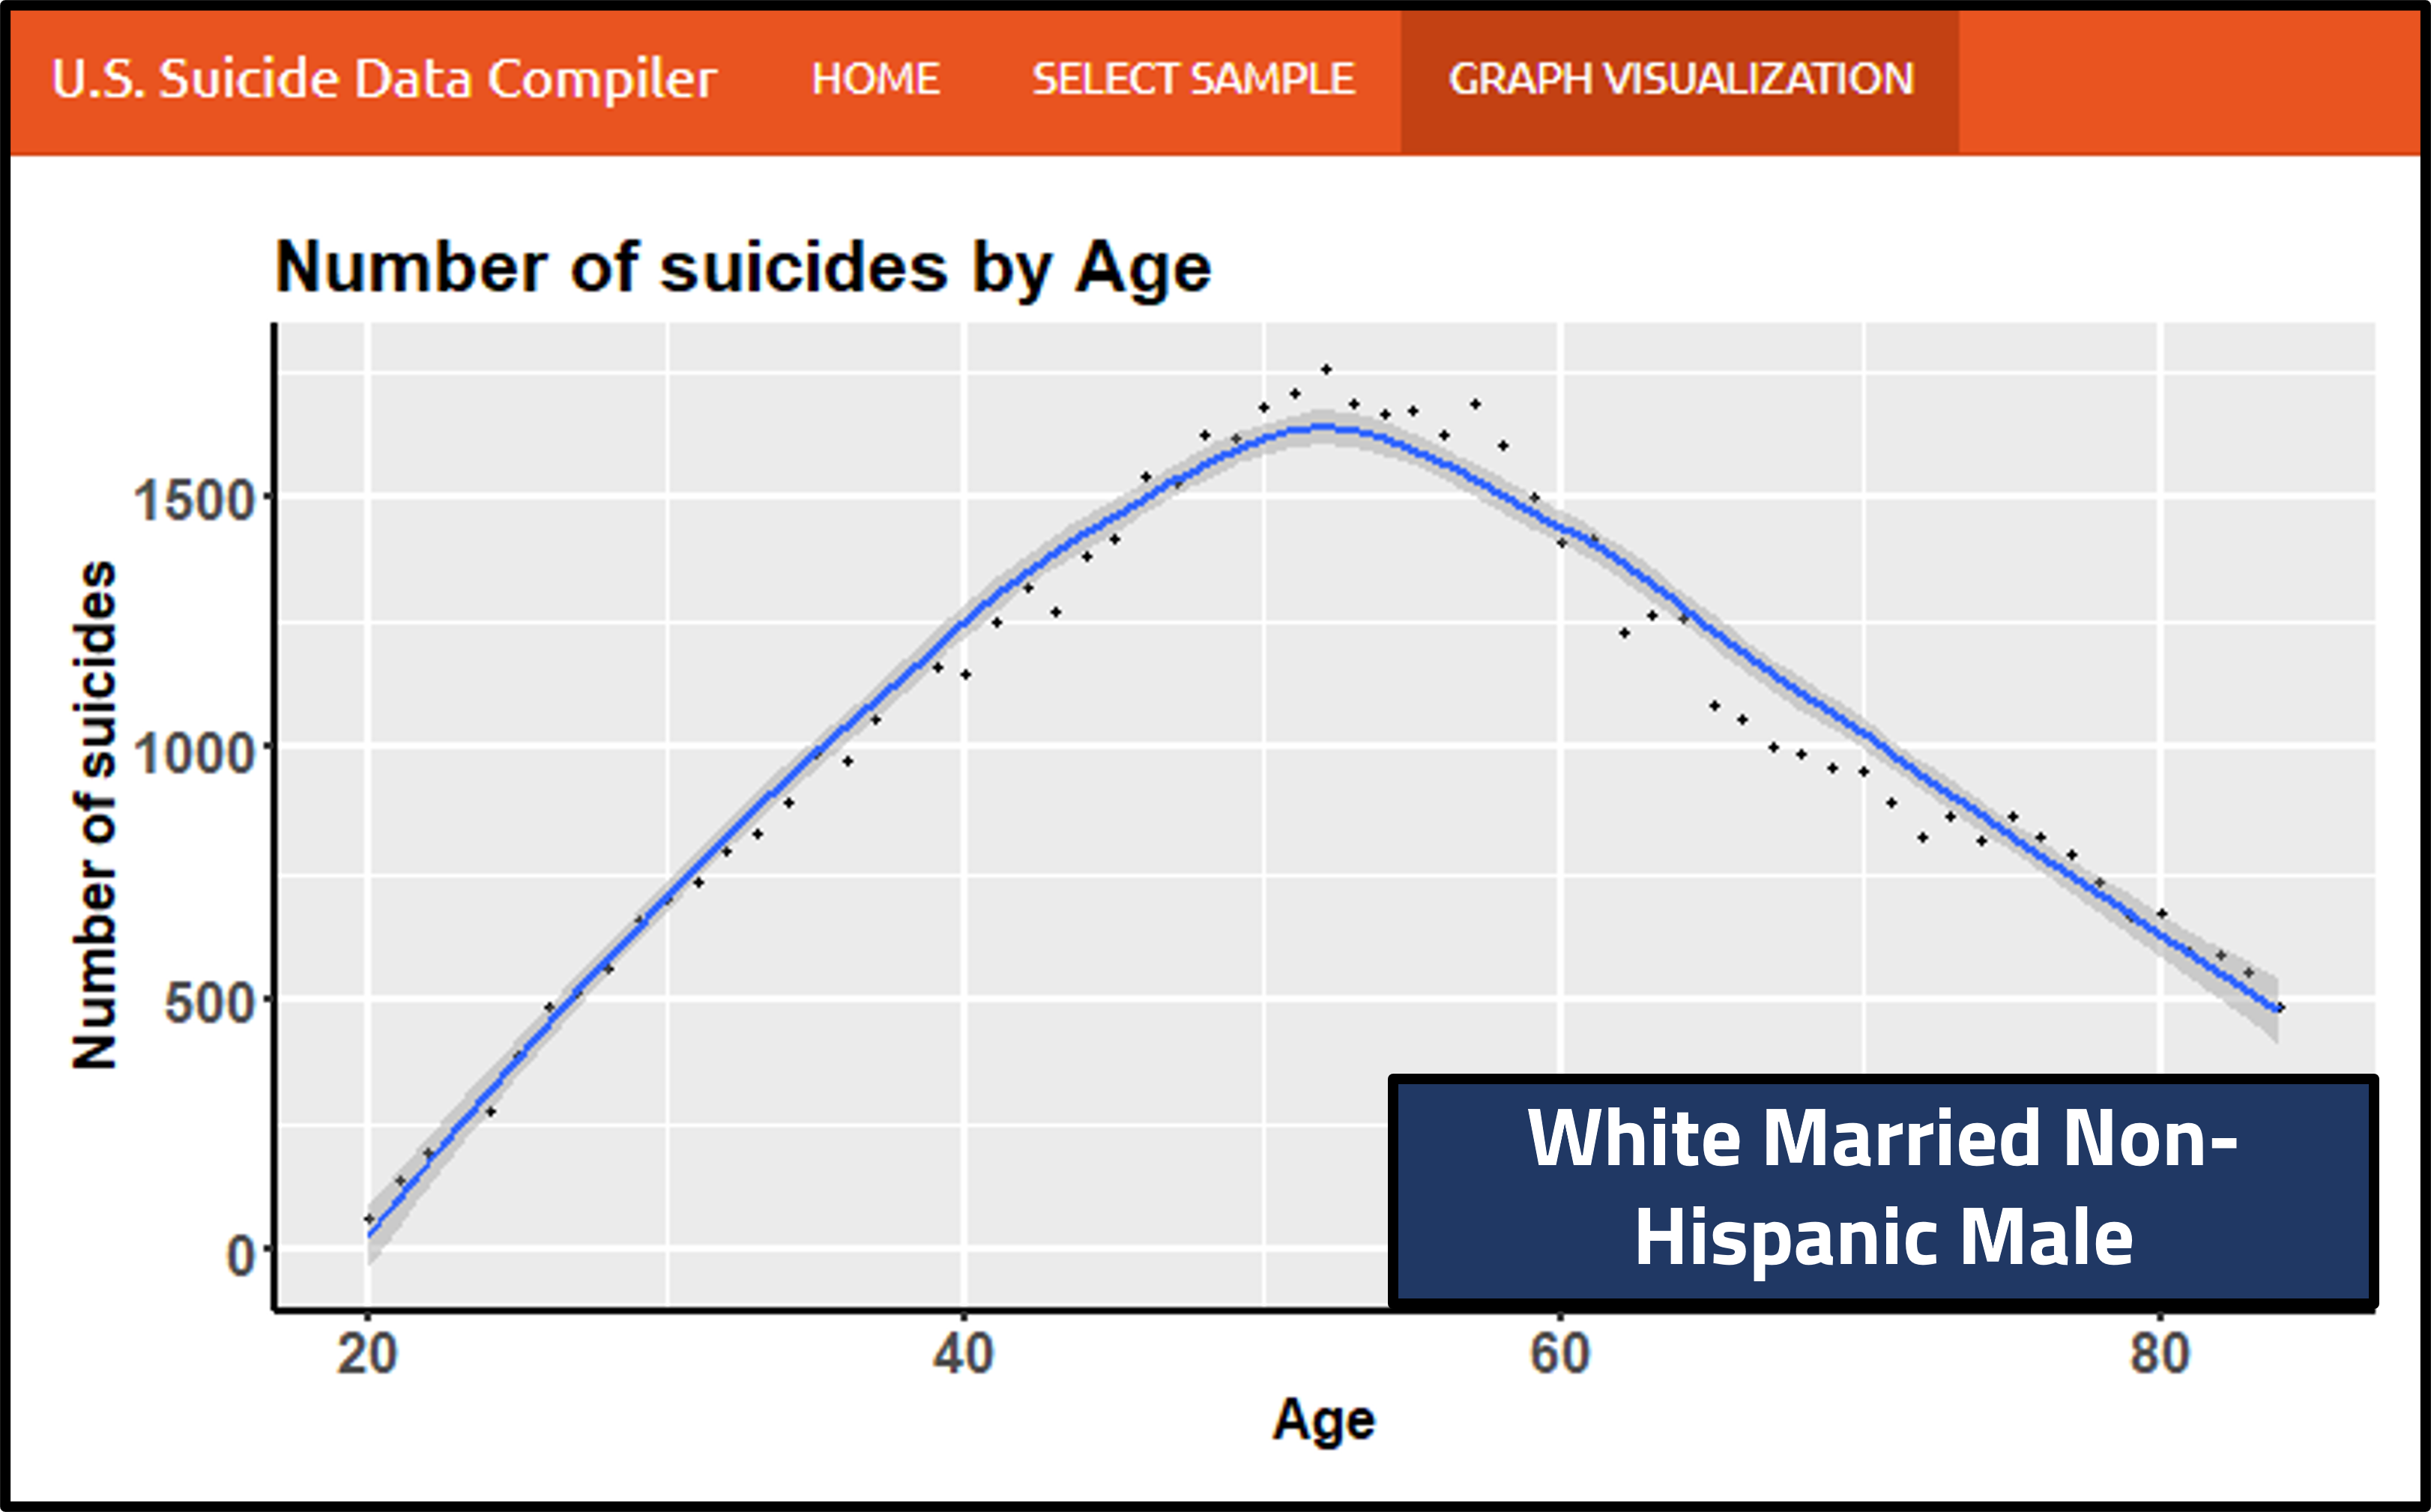
Suicide is an epidemiological crisis. While mortality rates for most terminal illnesses have decreased in recent years, suicide rates remain stagnant globally. The demand for improved modeling is clear. Yet, in the United States, both descriptive and predictive models are dominated by white male suicides, leading to a heavily biased dataset. Peer-reviewed literature suggests, for example, that age is a risk factor for suicide in the U.S.; but in practice, this is only true for white men. For all other demographic populations, risk tends to peak in early- to mid-adulthood. Many similar questions remain: Is the protective effect of marriage equal between races? How does education differentially predict suicide in men vs. women? Such interactions tend to go unnoticed even by clinical experts. The U.S. Suicide Data Compiler (USSDC) challenges this by dynamically plotting variables like age and suicide rate for a targeted demographic.
We are strong proponents of open science and believe that data and scientific knowledge should be readily accessible to all who seek it. This is another key factor that led us to this project.
What it does
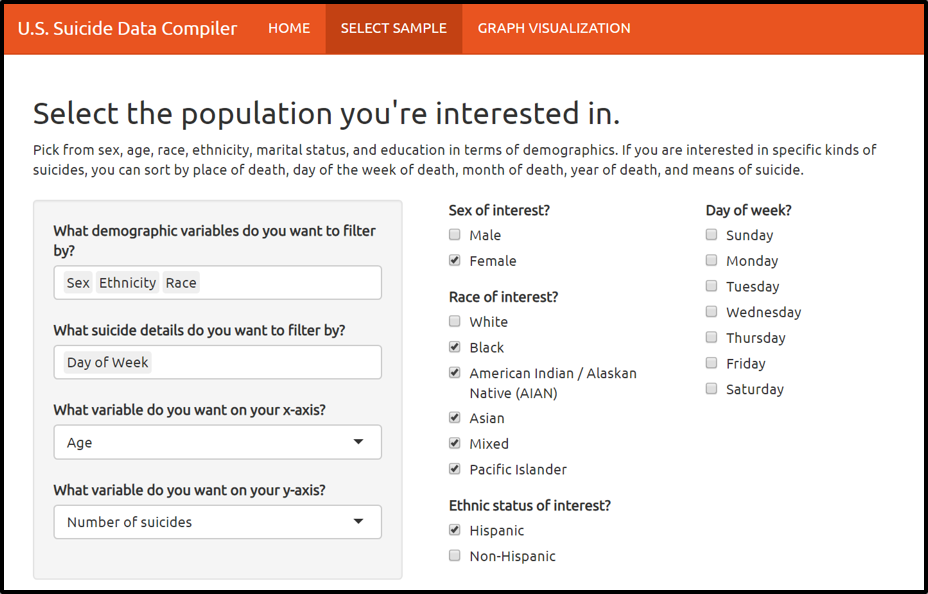
Integrating mortality data from the CDC and population data from the U.S. Census, the USSDC can answer any number of targeted questions on the epidemiology of American suicide between 2009 and 2019. If you are interested in the role of age on suicide rate, you can visualize this effect not just for the general population -- but also for unmarried, Black, Hispanic men in particular. In fact, you can sort by population for any combination of sex, age, marital status, race, ethnicity, and education. You can also sort by specific kinds of suicides. Knowing means restriction is a leading form of suicide prevention, our tool is the first to visualize (as an example) how gun suicides vary for any racial or gender demographic over time. Sociologists may take great interest in the place of death for the suicide: was it at home, or was it outside, and how does this vary by race? Exploratory data analysis is practically limitless.
How we built it
472,100 suicides -- every recorded instance between 2009 and 2019 -- were filtered from large-scale, open-sourced CDC data, and then we calculated rates for each of over 100,000 demographic combinations using Census data. This was all completed in R. We took our data live using RShiny to allow for the user to select their population and parameters of interest without restrictions.
Challenges we ran into
Data cleaning was a very time-intensive process due to the ancient formatting of the Census files. This alone took roughly 8 hours of work. There were also many different levels of data parsing and abstraction that we needed to accomplish to provide full functionality for our web app, which we did not realize when starting -- otherwise, we may have allocated our time differently. Additionally, neither of us had used R Shiny before, so there was a learning curve in understanding basic programming functions. The app is not entirely complete and currently works with a limited number of population combinations (by race and age), but future work should come more easily.
Accomplishments that we're proud of
At its core, this project has successfully met a critical demand in suicide prevention by enabling scholars and citizens to see how suicide varies in their particular population of interest. This is reward in and of itself. Further, this weekend allowed us to engage with the best essence of research. Without a doubt, exploratory data analysis using the USSDC could produce new models of suicide that are more population-specific and that better reveal the struggles of otherwise ignored demographics.
What we learned
It is shocking what you can accomplish in one weekend -- but it's also important to get into the weeds of the front-end before you take care of too much back-end. The amount of time spent cleaning data was likely not necessary, even if discarding such work comes with the price of some lost information; with this saved energy, we would have been able to invest more in the UI and functionality of our initial app.
What's next for CDC Suicide Data Visualization Tool
We are going to continue developing this for academic and research purposes!
Built With
- google-cloud
- r
- shiny


Log in or sign up for Devpost to join the conversation.