-
-
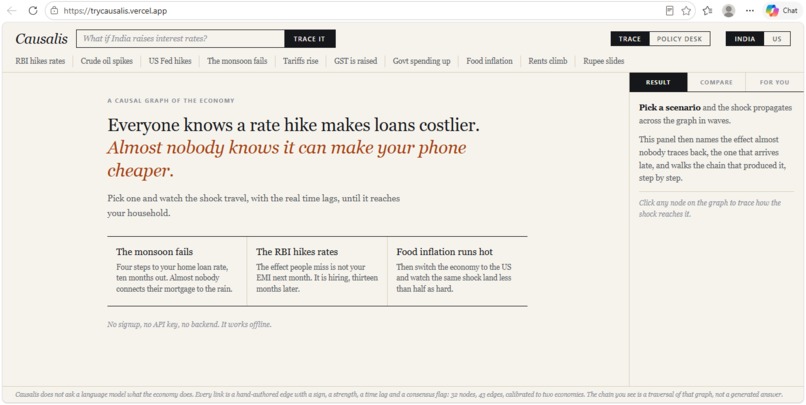
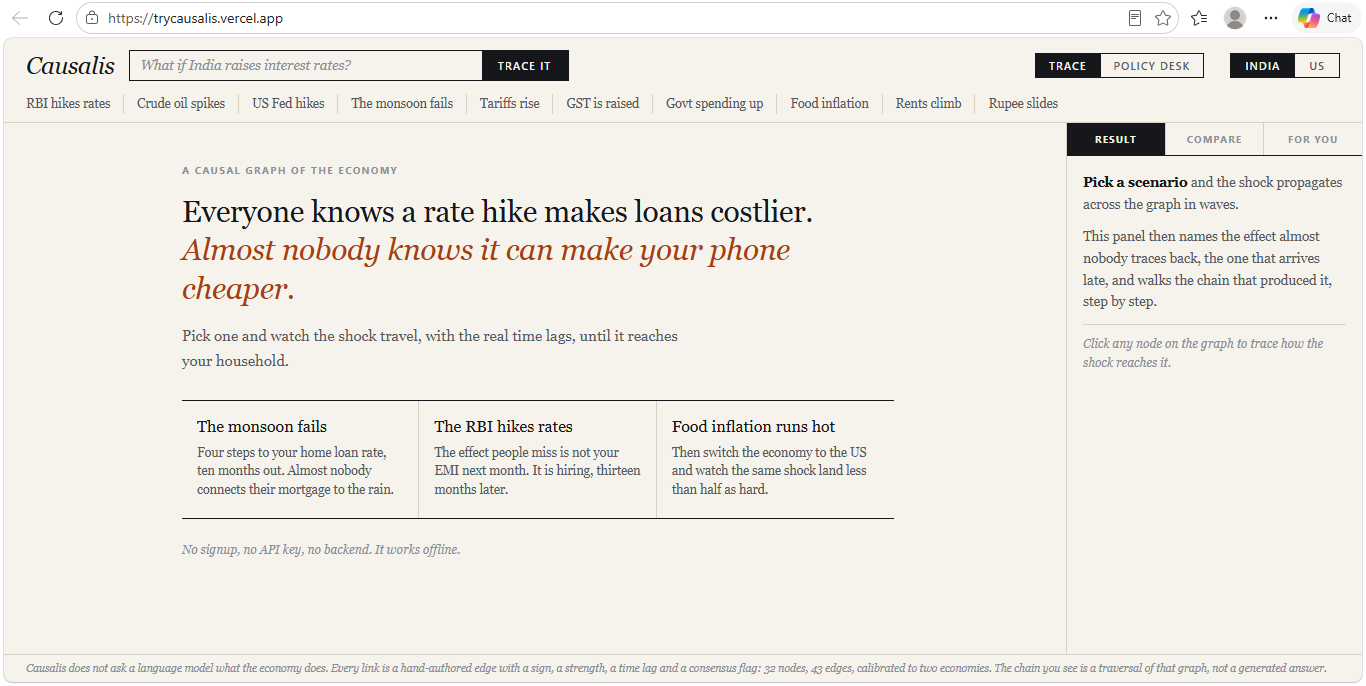
Causalis
-
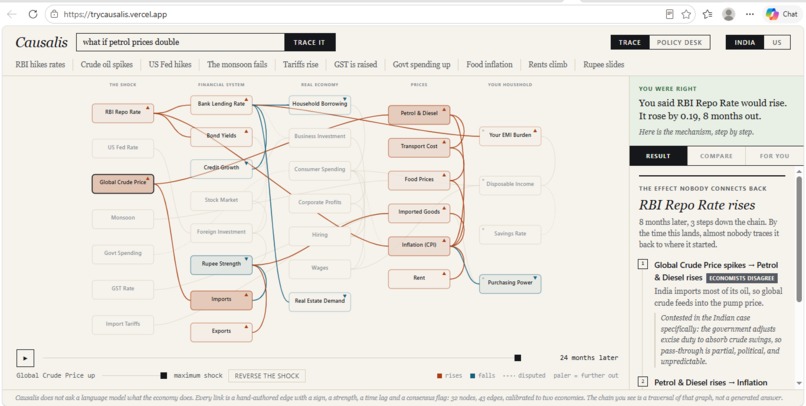
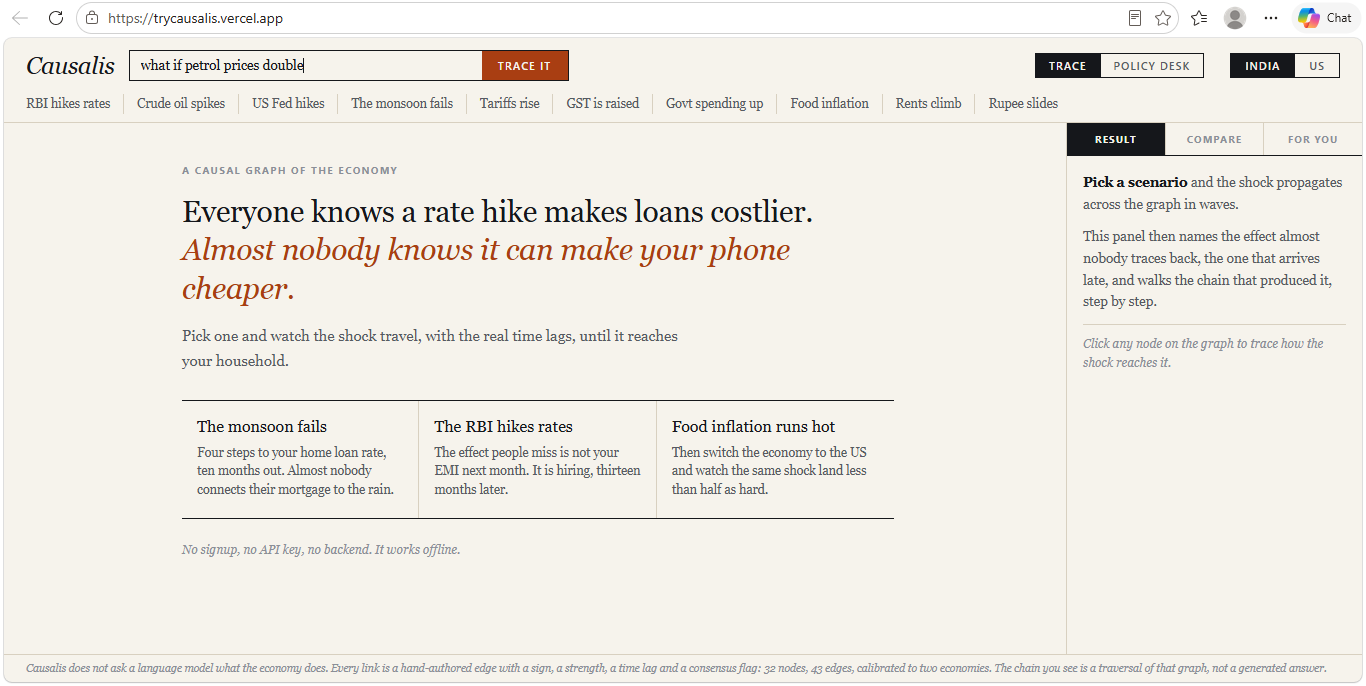
Tracing the search bar
-
Commitment before an actual answer
-
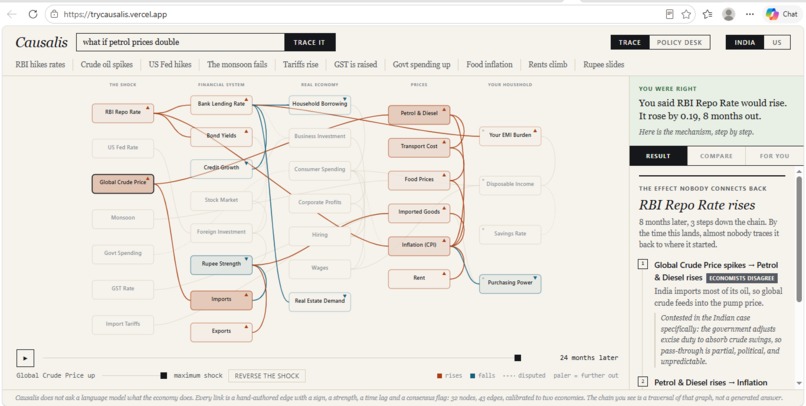
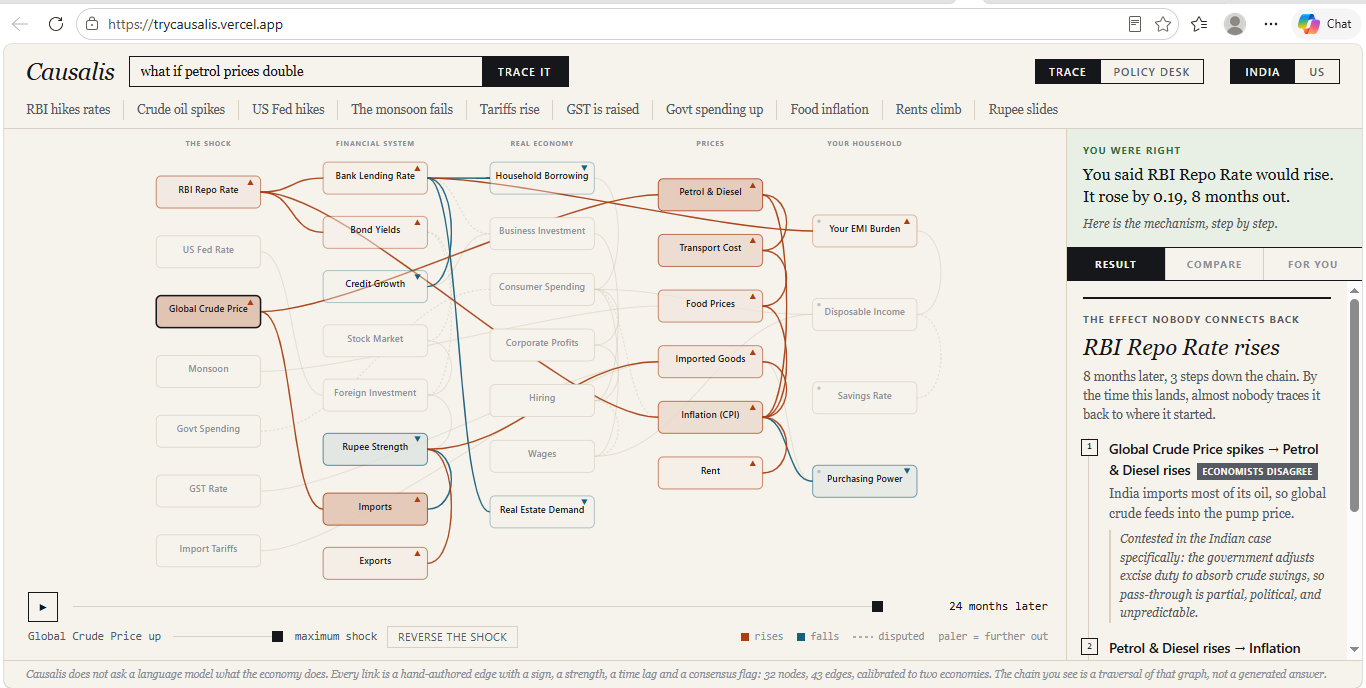
Visualization with explanation
-
Policy Desk
-
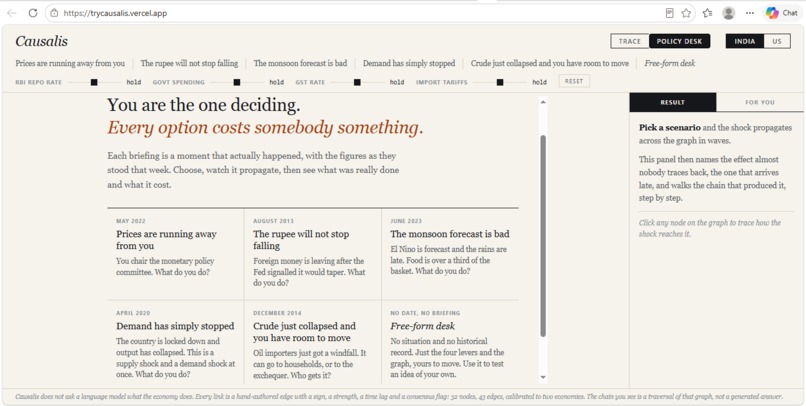
Policy simulation
-
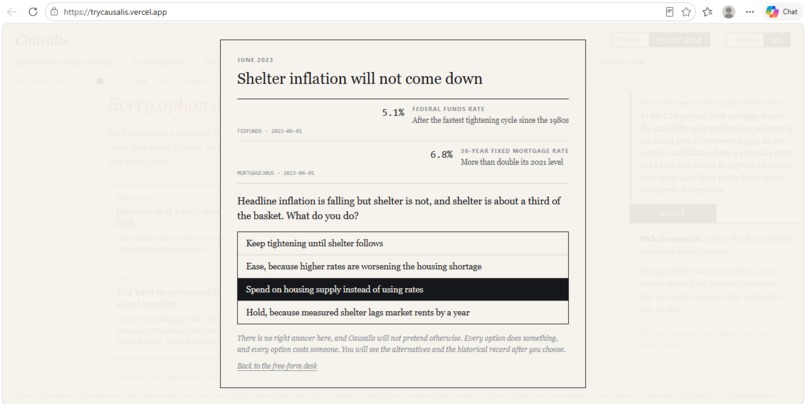
Simulation result
-
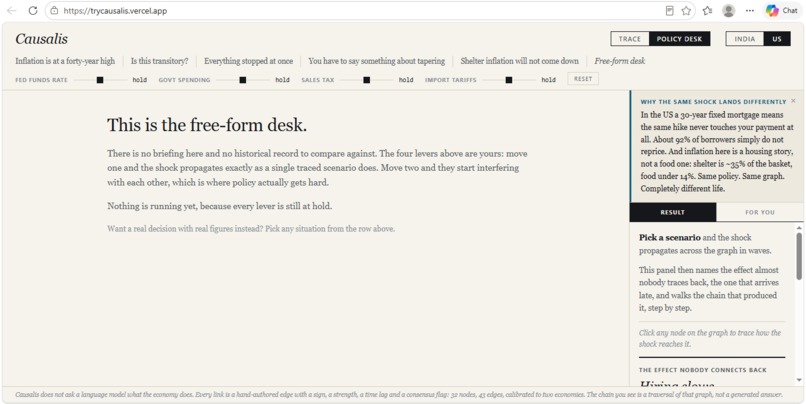
Free Form desk
Inspiration
Economics is taught as a vocabulary test. "Contractionary monetary policy reduces aggregate demand" is a sentence you can memorize, be examined on, and still not understand, because you have never watched the mechanism move. The failure is not that people lack information. It is that causality is invisible. Everyone stops at step one. Everyone knows a rate hike makes loans more expensive. Almost nobody traces it to the hiring freeze thirteen months later, or to the imported phone that gets cheaper because the same hike strengthened the currency. People do not miss those effects because they are complicated. They miss them because they arrive late, and by the time they land, nobody connects them back.
What it does
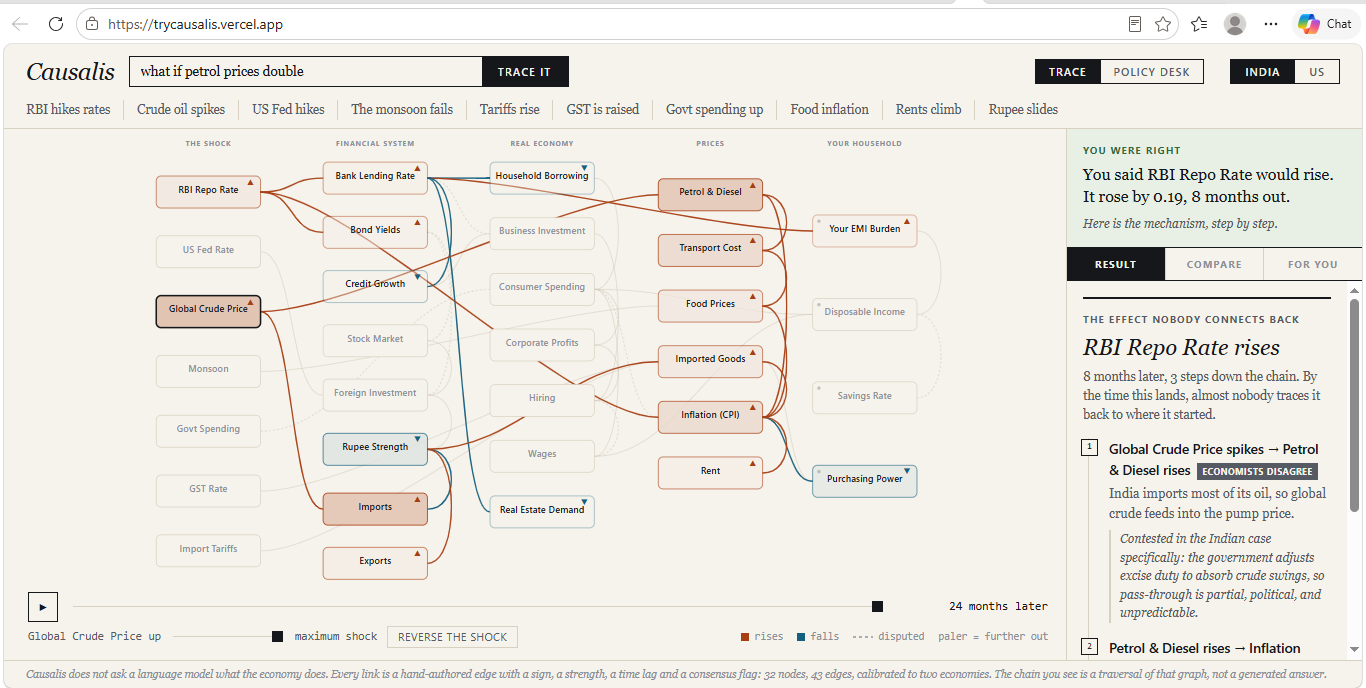
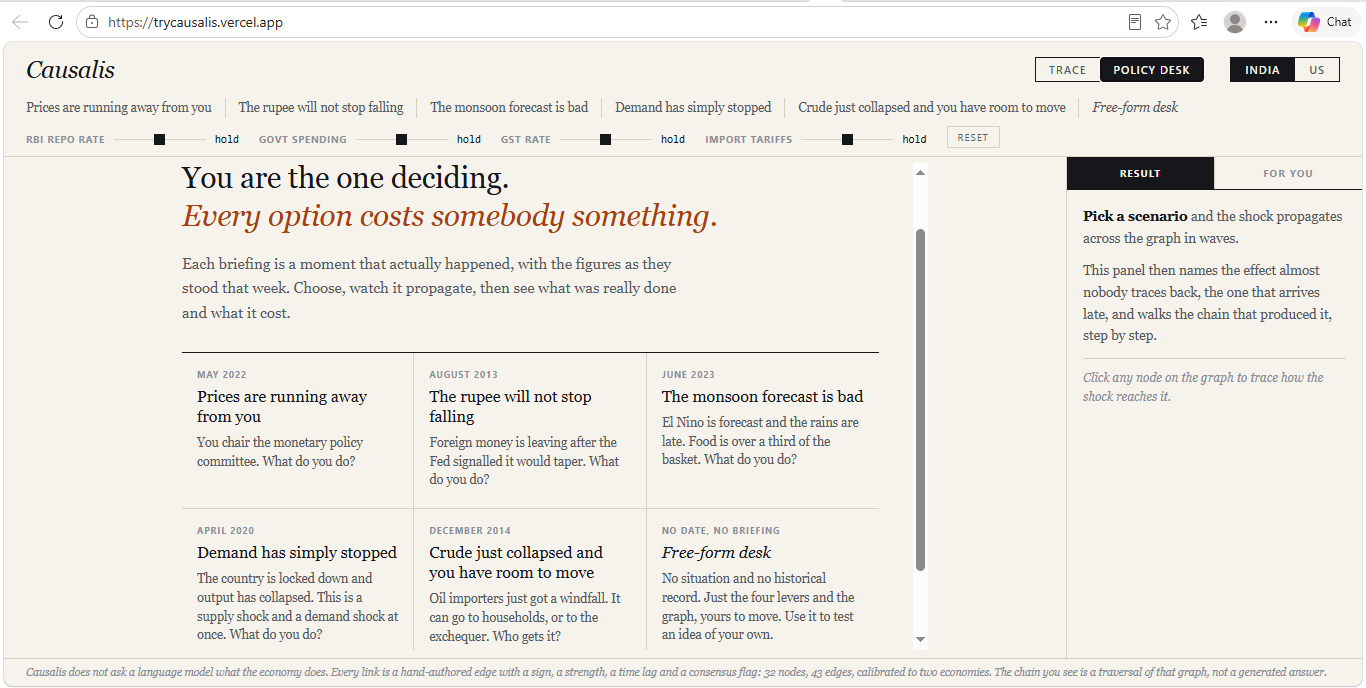
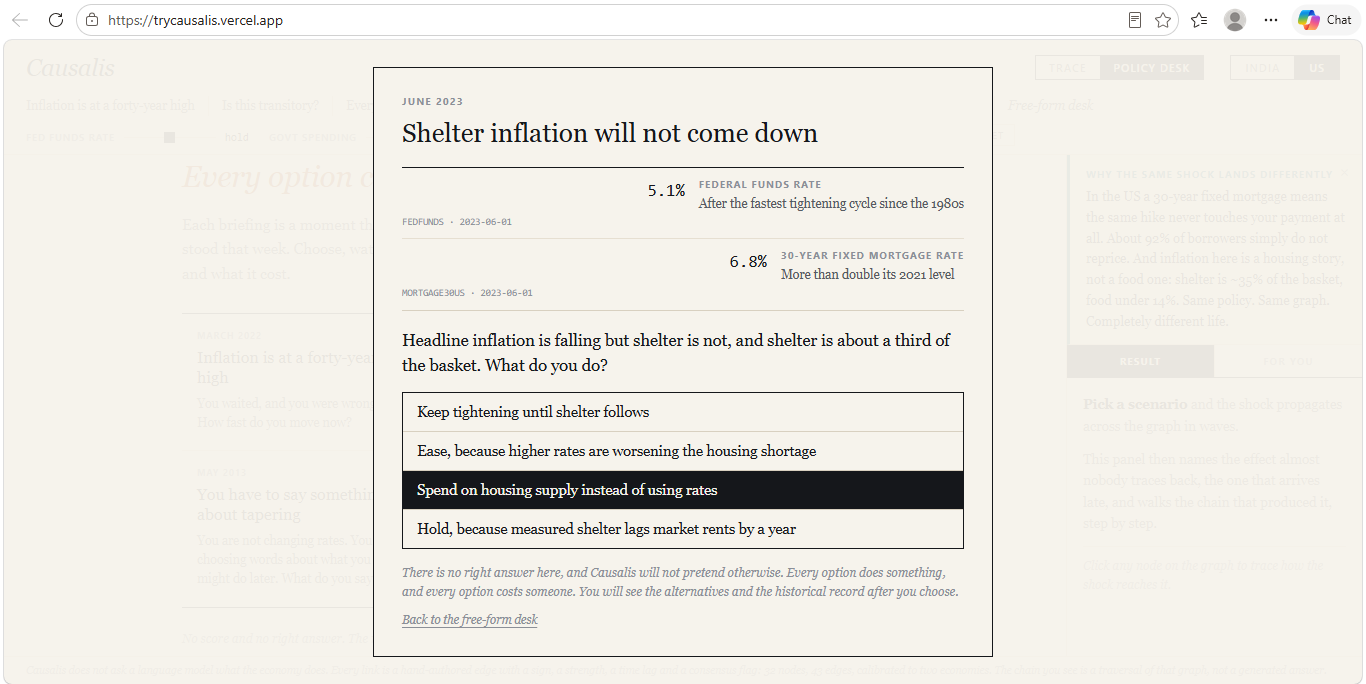
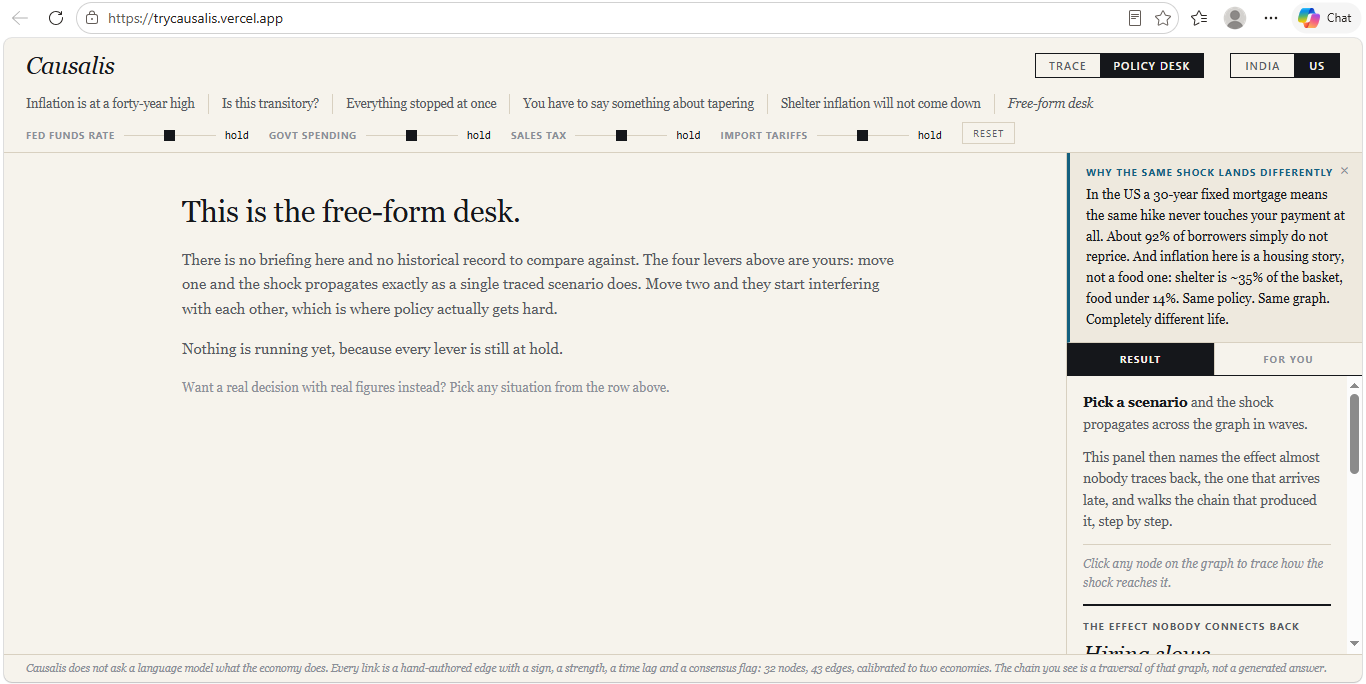
Causalis takes an economic shock and shows you the chain it travels, in order, with the real time lags. Trace mode: Pick a shock and watch it propagate across five columns: The Shock, Financial System, Real Economy, Prices, Your Household. A 24-month scrubber plays the chain forward. Click any node to see the exact path that reached it and read the mechanism behind every hop. 10 preset scenarios for India, 8 for the US, plus free-text search. Prediction mode: Before the chain resolves, Causalis stops and makes you commit to a guess about where a delayed effect lands. Being wrong is the point. A counterintuitive result you predicted incorrectly sticks; one you passively watched does not. Two economies: The same shock runs on an India or a US calibration. These are not two apps. They are two calibrations of the same topology: same node structure, different edge parameters. The difference is structural, not cosmetic. In India, home loans float and a rate rise reprices your payment almost immediately. In the US, roughly 92% of mortgage borrowers hold 30-year fixed loans and never reprice at all. Same policy, same graph, completely different life. Situations: 10 real historical decisions, 5 per economy, 40 options total. Each opens with a briefing showing the figures as they actually stood that week, resolved from FRED at build time and displaying their series IDs and observation dates on screen. 20 figures, none hand-typed. You choose, then get three things: what your choice does, what the alternatives would have done, and what was actually done at the time, cited. Two callouts fire only when the model genuinely finds them: Unavoidable cost, a harm appearing under every available option. It fires on 2 of 10 situations, both from 2020, and both times the answer is inflation. Whatever you did in 2020, prices rose. Outlives you, an effect landing after an 18-month term ends. It fires on 1 of 10: the 2022 Fed hike reaching wages at month 21. Stakeholder lens: Five personas with genuinely conflicting interests, not five labels on one answer. A rising bank lending rate helps the retiree living on deposits and hurts everyone else. Rising food prices help the farmer and hurt every consumer. Some effects are scored ambiguous and count for nobody. No answer key. No score, no streak, no points, no "correct." Every situation ends with "No score, and no answer key." The historical record is shown so you can disagree with it.
How I built it
The obvious build is to ask a language model what happens to the economy. I rejected it. A model asked to generate a causal chain produces something fluent, unfalsifiable and unattributable, and a student cannot tell the difference between that and the truth. So I inverted the architecture. No language model is involved at any point. Runtime model calls: zero. The economics lives in a hand-authored directed graph. India: 32nodes, 43 edges. US: 30 nodes, 42 edges. Every edge carries a sign for direction, a strength from 0 to 1, a time lag in months ranging from 0 to 12, a consensus flag, and a written explanation of the mechanism. 43 of 43 edges carry that written mechanism. 33 are marked settled and 10 contested, and the contested ones render as disputed on screen rather than being hidden. A shock enters at one node and propagates breadth-first. Each hop multiplies by edge strength and applies damping of 0.85. Traversal terminates at 5 hops, at a signal floor of 0.05, or at a 24-month horizon, because the tool does not claim to see further than two years. The graph deliberately contains feedback loops. Wages raise spending which raises wages; inflation raises the policy rate which lowers inflation. Naive traversal either drops these or runs forever. Damping resolves them as decaying echoes, which is also what they are in reality. One property worth stating: the engine is linear. Arrivals never interact during traversal, so propagating four levers simultaneously is exactly the sum of propagating each alone. That is superposition, and it is verified by a test rather than asserted. The interference you see on the Policy Desk is not unpredictable behaviour. It is clean chains landing on the same node with opposite signs.
Technical: Vanilla JavaScript ES modules. Zero dependencies, no framework, no bundler, no build toolchain beyond a 48-line script that inlines everything. Rendering is hand-written SVG. It ships as one self-contained HTML file of roughly 214 KB. No API key, no backend, no accounts, no network calls at runtime. It works offline. That is a hard architectural rule, not a convenience. The design is deliberate paper-and-ink editorial: Georgia serif, monospace figures, hairline rules, zero rounded corners.
Challenges I ran into
The narration layer taught me how errors hide. I had written each edge's explanation directionally: "a good monsoon means abundant supply pulls prices down." Then I shocked the monsoon downward and the app explained a good harvest beside an arrow pointing up. The economics was correct the entire time. The words were wrong. I rewrote all 43 explanations as direction-neutral mechanisms and now generate the rise and fall language from the sign of the signal itself. Verification was harder and mattered more. I had built the food-to-inflation edge on food being roughly 46% of India's CPI basket. Checking it against the source rather than trusting it, I found India had rebased to a 2023-24 series and the correct figure is 36.75%. That number appeared in the flagship monsoon demo, so a judge could have checked it live. It is corrected and documented. Building the graph took a weekend. Proving it was true took considerably longer.
Accomplishments that I'm proud of
The backtest.: I scored the model against real historical data from FRED across 4 pre-registered episodes: the 2022 Fed hiking cycle, the 2013 taper tantrum, the post-pandemic US rent surge, and the 2023 El Niño monsoon. 7 FRED series used. Direction: 7 of 9 scored nodes. Direction at 3 or more hops from the shock: 2 of 3. Timing within tolerance: 7 of 9. Unscoreable: 6 of 15 pairs, mostly because India does not publish those series in free machine-readable form. The 3-plus-hops row is the one that matters. Predicting the immediate effect of a rate hike is easy and a naive first-order model gets those right too. Getting something right three steps down the chain is the actual claim. The failures are published by name, inside the app. Both direction misses are CPI: in the taper tantrum and the El Niño monsoon, the model said inflation up and the data said down. In the monsoon case the series did rise first, peaking at month 1, before falling below where it started. It is still recorded as a miss, because the scoring metric was fixed before the data was fetched. Rescoring against the peak because the endpoint was unflattering would have turned a test into an advertisement. Timing missed twice, both in the Fed cycle: Hiring, predicted month 12 and turned at month 5, and Stock Market, predicted month 0 and turned at month 16. Nothing in the graph was tuned to these results. That is the entire value of the exercise. Honesty as a feature, not a disclaimer. The tool models direction, sequence and timing, and refuses to model magnitude. Lever positions are described in words like "moderate cut" rather than percentages, precisely so nobody reads a magnitude claim it does not make. Contested edges are labelled. The backtest publishes what it could not score at all.
What I learned
That the most important thing I built is the thing no model is allowed to touch. The quality of this project is set entirely by the quality of the graph and not at all by any language model reading it. Constraining what could be generated made the output more trustworthy, not less capable. And that specificity is what makes a model credible. I considered building a generic global economy so it would feel relatable everywhere, then realised that sanding off the detail leaves a set of Econ 101 arrows anyone could produce. Two researched calibrations prove more than thirty guessed ones, because two graphs sharing a topology demonstrate that structure is separable from calibration.
What's next for Causalis
More economies: chosen for how differently they behave. India and the US already show that structure beats coefficients: floating home loans against 30-year fixed mortgages. The next calibrations should be picked to break the model's assumptions rather than pad the list. Japan, where decades near the zero lower bound mean the policy rate lever barely transmits at all, so the tool has to show a broken instrument. Germany, where monetary policy is set by the ECB and fiscal policy is set at home, splitting sovereignty across the graph. And an oil exporter such as Nigeria or Indonesia, where the crude edge inverts entirely. A price spike that damages India is income for them. Same topology, opposite sign, and nothing teaches the difference between an economy's structure and its parameters faster. Adding an economy is already a parameter file rather than a rewrite, so the constraint is research, not engineering.
A sequential policy simulator: The Policy Desk currently answers one decision at a time from a clean baseline. Real policymaking is nothing like that. You inherit the economy your last decision made. The next version runs across multiple periods, where each round's outcome becomes the next round's starting conditions. Cut rates to save employment, and you begin the following year holding the inflation you created. This is the one extension that genuinely changes the engine rather than the data. Propagation is currently linear and stateless, which is what makes superposition hold and results reproducible. Sequential play requires non-zero baselines and path dependence, and preserving determinism through that is the interesting problem.
Reverse mode: Today Causalis answers a question people rarely ask out loud. Nobody wakes up wondering what happens if the central bank hikes. They wake up wondering why rent went up, why the job market froze, why groceries cost more. Reverse mode inverts the traversal. Name the effect you are living with, and Causalis walks backwards to rank the candidate causes consistent with the timing. "Your rent is rising. Three chains lead here. The strongest began with an oil shock fourteen months ago." Same graph, same engine, no new economics, and it turns a teaching tool into something that explains a person's own life to them.
An open scenario engine Type any hypothetical, including one that has never happened, and watch it propagate. What if India banned crude imports. What if a monsoon failure and a Fed hike landed in the same quarter. A model would decide which levers a novel scenario pulls. It would still never decide what those levers cause. Alternate history, the same engine pointed backwards. Load 2008, COVID or the 1973 oil shock, change one variable, and watch a different decade unfold.
A backtest that keeps growing: The current scorecard covers 4 episodes and 9 scored pairs, which the app itself says is not enough to separate a working model from a lucky one. Every new episode and every newly machine-readable Indian series makes that claim stronger or exposes it. The scorecard should be a permanent, public, growing record rather than a one-time exercise, including the failures. A system-liquidity node, since the SDF replaced the fixed-rate reverse repo as the corridor floor in 2022 and liquidity conditions now carry information the policy rate alone does not.
Built With
- css
- github
- html
- javascript
- svg
- vercel

Log in or sign up for Devpost to join the conversation.