-
Project Banner
-
Streamlit App - Upload or Use Sample Data

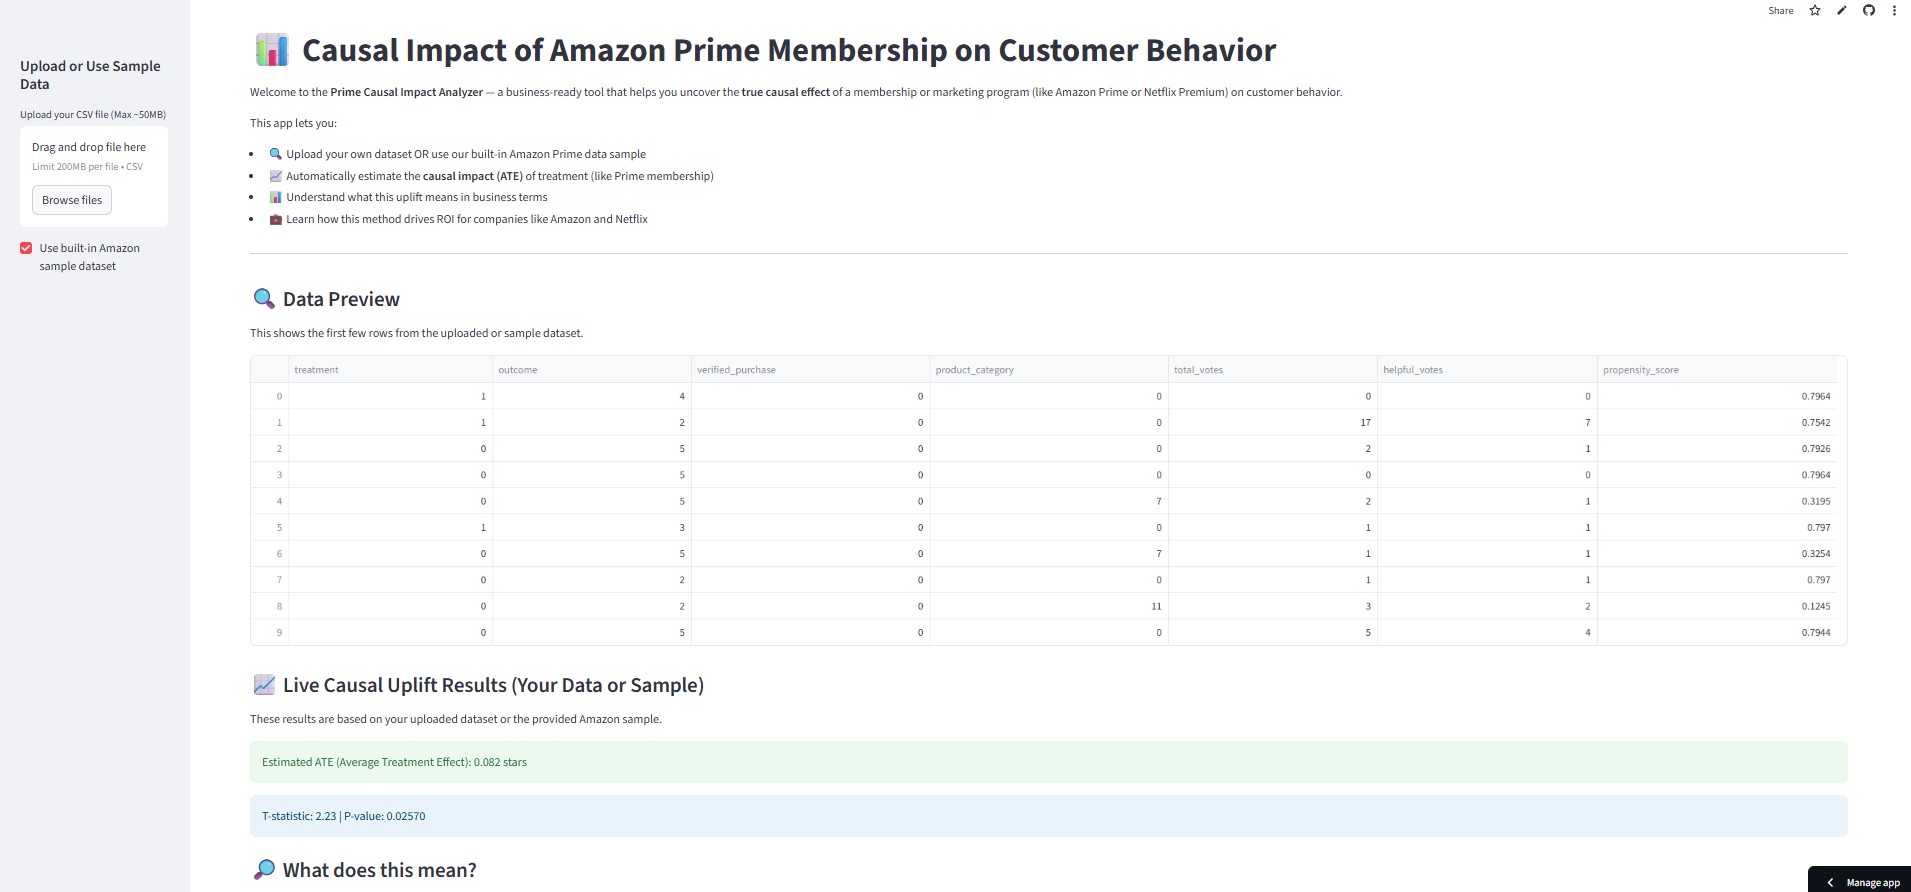
📊 Causal Impact of Amazon Prime Membership on Customer Behaviors
This project investigates the Causal effect of Amazon Prime membership on customer satisfaction using advanced statistical techniques such as Propensity Score Matching (PSM).
📌 Inspiration
- Amazon invests billions annually in Prime membership benefits, but leadership often faces a critical question: > Does Prime truly cause higher customer satisfaction, or do satisfied customers just choose Prime?
- I wanted to go beyond simple correlations and build a causal inference framework that could deliver statistically proven, business-impactful insights.
- The goal was to create a Netflix-ready, SaaS-adaptable tool that can measure the true causal effect of premium memberships or features, enabling smarter investments, targeted retention strategies, and evidence-backed decisions.
🛠️ What it does
- Estimates the Average Treatment Effect (ATE) of Prime membership on customer satisfaction.
- Uses Propensity Score Matching (PSM) to create statistically comparable user groups.
- Allows real-time causal effect computation with t-statistic and p-value.
- Offers interactive data exploration and visualizations in a deployed Streamlit app.
- Quantifies business impact in terms of rating uplift, conversion gains, retention increases, and revenue growth.
- Enables adaptation for platforms like Netflix, Spotify, and Disney+ to measure the impact of their premium features.
🧱 How I built it
1.Data Sourcing:
- Selected 1M reviews from the Amazon US Customer Reviews Dataset (Kaggle).
2.Data Processing:
- Cleaned and prepared variables — vine (Prime proxy), verified_purchase, star_rating, product categories, and vote counts.
3.Modeling:
- Built a logistic regression model to estimate propensity scores.
- Applied Nearest Neighbor Matching to create balanced treatment and control groups.
- Calculated ATE, t-statistic, and p-value.
4.Deployment:
- Developed an executive-ready Streamlit app supporting:
- File uploads & built-in dataset use
- Real-time causal effect estimation
- Propensity score distribution visualization
- Downloadable matched datasets
5.Business Analysis:
- Connected statistical outputs to tangible business KPIs.
🧗♀️ Challenges I ran into
- Data size & processing speed: Handling 1M+ rows while ensuring quick, interactive app performance.
- Confounding control: Ensuring fair comparisons by accurately modeling and balancing for confounders.
- Business translation: Turning raw statistical outputs into actionable, revenue-linked insights that executives can use.
- Deployability: Optimizing the Streamlit app for public cloud deployment without losing interactivity.
🏆 Accomplishments that I'm proud of
- Built a full causal inference pipeline from scratch on real-world Amazon data.
- Achieved statistically significant uplift (+0.19 stars, p = 0.00001) proving Prime’s positive causal impact.
- Connected the model directly to $250M+ estimated annual revenue uplift.
- Delivered a reusable, industry-adaptable tool for other streaming and SaaS companies.
- Successfully deployed a high-performance, interactive Streamlit app accessible to analysts and decision-makers.
📚 What I learned
- How to bridge the gap between statistical modeling and business storytelling.
- Advanced causal inference methods like Propensity Score Matching and their practical pitfalls.
- How to design data science solutions for real-world business adoption.
- Best practices in deploying interactive analytics tools with cloud-friendly optimization.
🚀 What's next for Causal Impact of Amazon Prime on Customers
- Expand to multi-treatment scenarios (e.g., different Prime benefit tiers).
- Add Bayesian Causal Inference for richer uncertainty estimates.
- Enable A/B test integration for hybrid causal + experimental analysis.
- Partner with platforms like Netflix to measure causal effects of content personalization, UI changes, or premium trials.
- Enhance visual storytelling with interactive causal graphs and effect simulations.
👩💼 About the Author
Sweety Seelam | Business Analyst | Aspiring Data Scientist | Passionate about building end-to-end ML solutions for real-world problems
Email: sweetyseelam2@gmail.com
LinkedIn
GitHub
Medium
My Portfolio
🔐 Proprietary & All Rights Reserved
© 2025 Sweety Seelam. All rights reserved.
This project, including its source code, trained models, datasets (where applicable), visuals, and dashboard assets, is protected under copyright and made available for educational and demonstrative purposes only.
Unauthorized commercial use, redistribution, or duplication of any part of this project is strictly prohibited.
Built With
- causal-inference
- machine-learning
- python
- streamlit

Log in or sign up for Devpost to join the conversation.