-
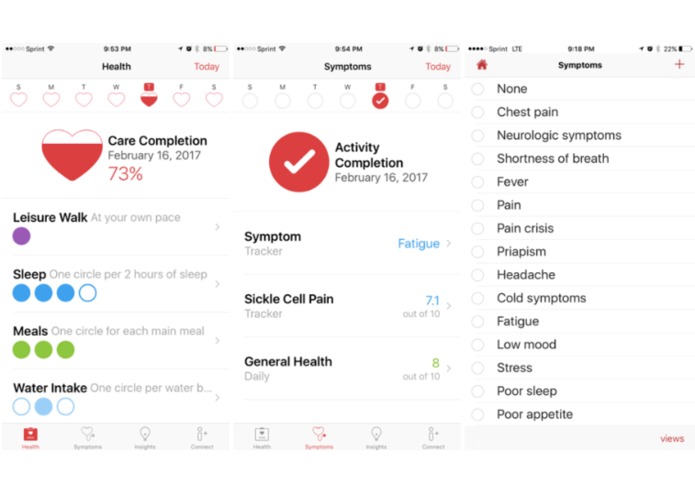
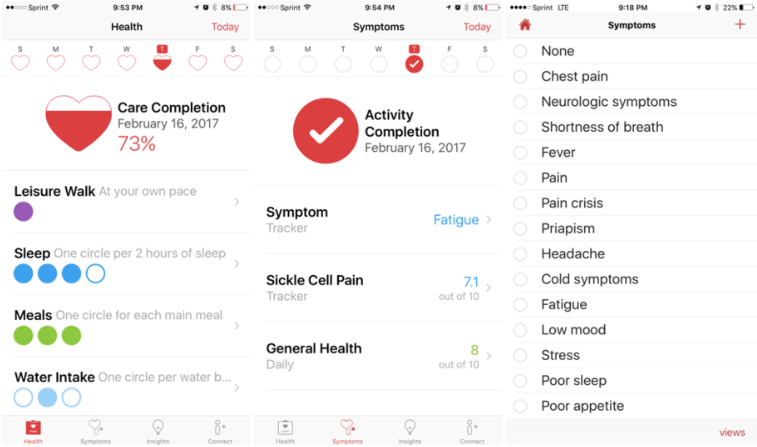
Screenshots and functions of the TRU-Pain app.
-
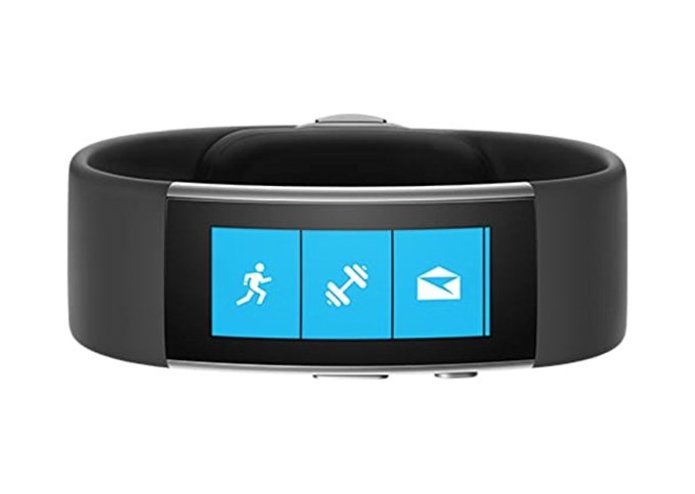
Wearable sensor (Microsoft Band 2) used in data collection
-
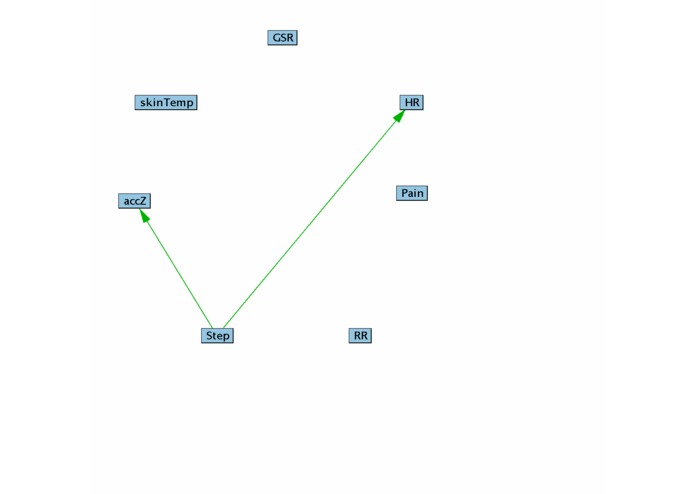
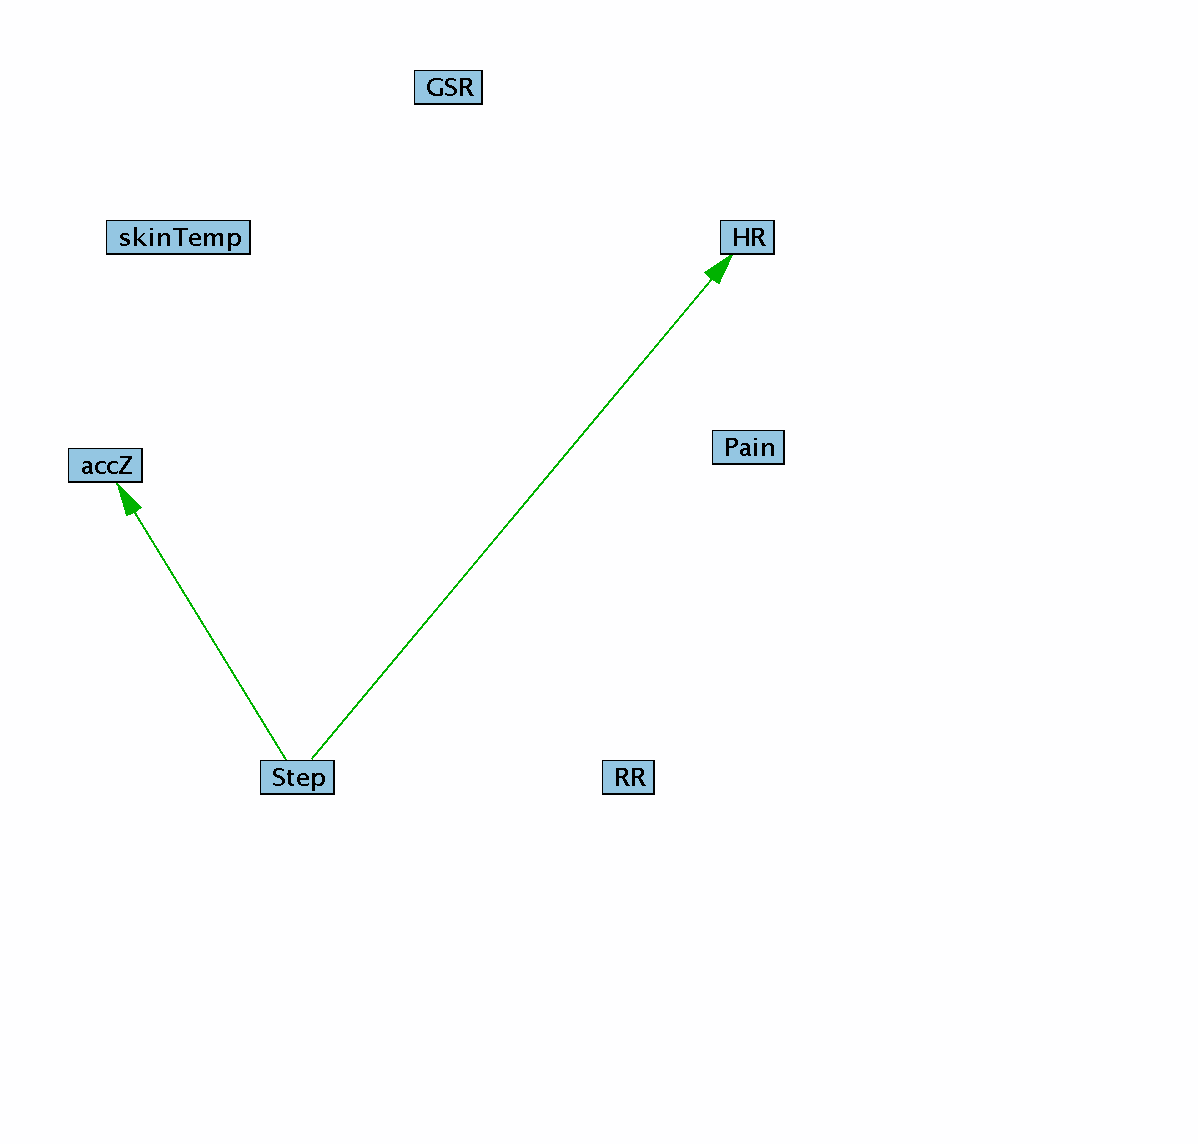
Knowledge graph used in Tetrad
-
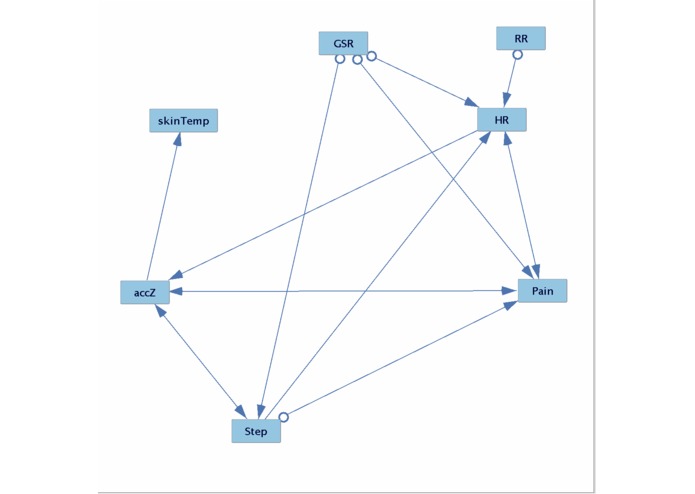
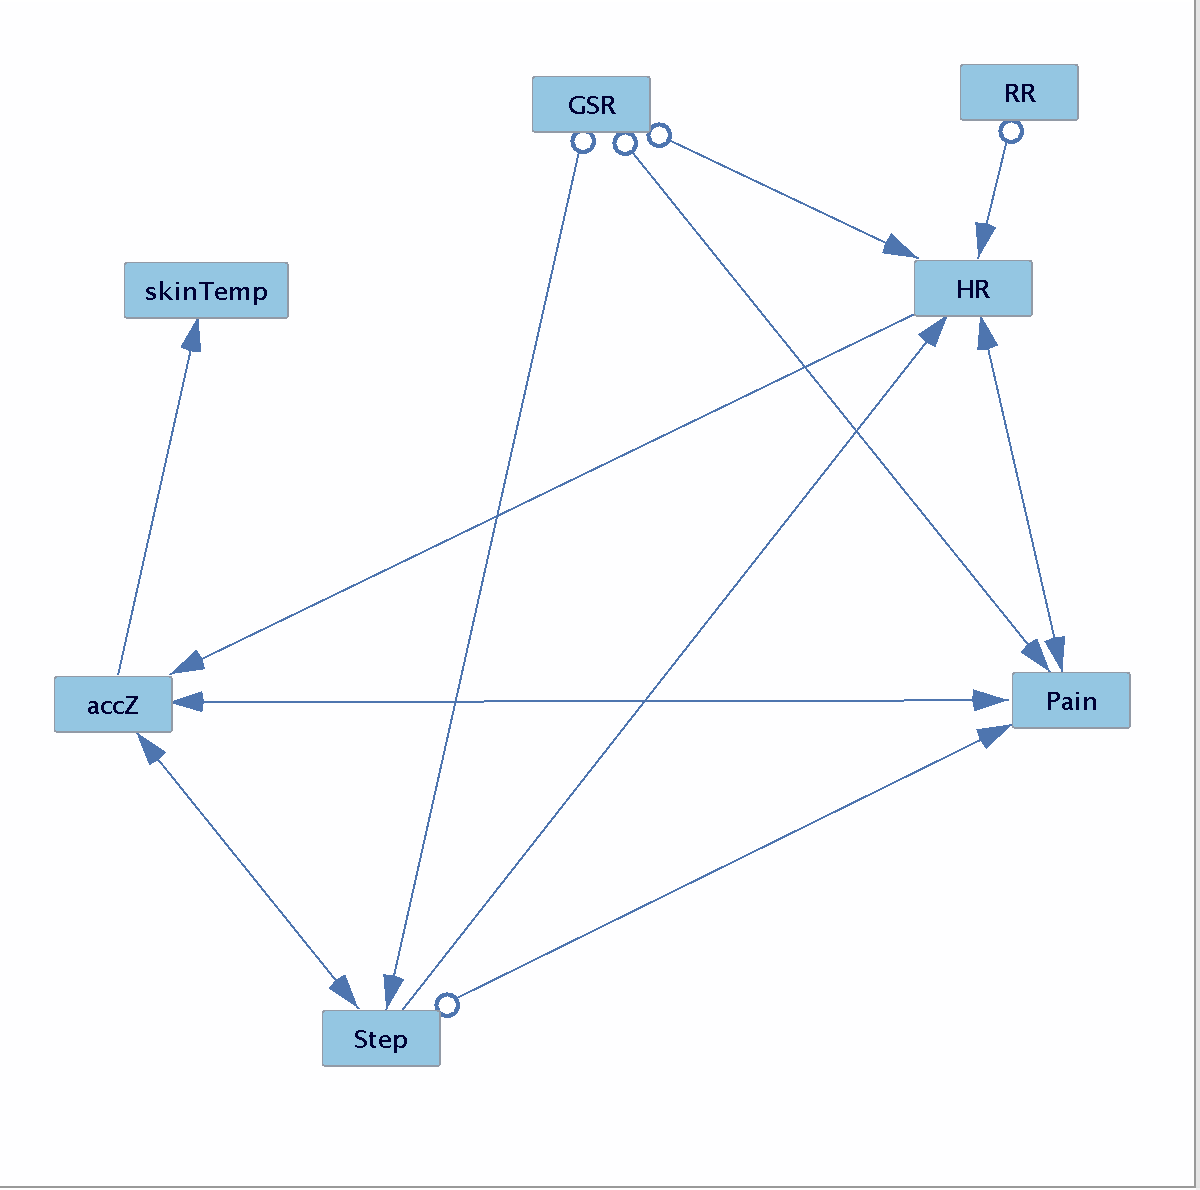
Causal model for pain and objective data

Inspiration
Sickle cell disease (SCD) is a lifelong inherited red blood cell disorder. In SCD, red blood cells become sickle-shaped causing them to clump together and stick to blood vessel walls. This leads to frequent vaso-occlusive painful episodes, which is also one of the primary reasons for emergency department visits and hospitalization in patients with SCD. The treatment of SCD is palliative and mainly includes pain control, preventing infection, and preventing complications. Therefore, the goal is to predict pain using wearable sensor-based health monitoring systems as well as data from an app (TRU-Pain) developed at Duke University. More information is available in the TRU-Pain Wiki.
Data
In the TRU-Pain application, patients recorded pain levels from 0-10. In the wearable sensor (Microsoft Band 2) objective data including heart rate (HR), Step, galvanic skin response (GSR), accelerometer for the Z-axis (accZ), RR interval (RR), skin temperature (skinTemp), gyroscope measurement in Y-axis (gyroY), and gyroscope measurement in Z-axis (gyroZ). The final dataset contains 116,517 rows of data collected from 20 patients. Since the pain scores were not recorded as frequently as the other variables, they were linearly interpolated in Matlab.
How we built it
Before running the analysis, data was preprocessed in Matlab as described in Data section. We then imported the preprocessed objective data and pain scores into TETRAD. For the model we input required edges between step and AccZ, and step and HR. This is due to the fact that when you walk around, the Microsoft Band 2 will register acceleration and your heart rate will change based on the speed of the walk. We used the GFCI algorithm with the SEM BIC Test and the SEM BIC Score. We used a penalty discount of 1 and used 100 bootstraps. In the graph we obtained with all variables, we found that gyroY and gyroZ are not connected with other variables. Thus we removed these two variables and obtained the final result with only 7 variables.
Challenges we ran into
Pain was recorded infrequently while the other data was recorded every second. Therefore, pain scores were interpolated using linear interpolation. We removed two variables because they were not related to any of the other variables in TETRAD. Background knowledge is needed to build a model. How to compare the PAG models obtained from different algorithms and different parameter sets are also a challenge we faced. The direction of the edges generated in the graphs were not stable and tricky to interpret.
What we learned
We learned that vital signs and other objective data can be used to model pain in SCD patients. The relationship between pain and the objective data is not all direct; the only direct links were between AccZ and skinTemp, HR and AccZ, and step and HR were the only direct links. However, we had no undirected links in the model. Pain affected physiological symptoms either indirectly or directly; however none of the physiological parameters affected the pain score for the patients.
What's next for Causal Analysis of Pain in Sickle Cell Disease
In conclusion, using objective physiological data collected from Electronic Health Records as well as from TRU-Pain and Microsoft Band 2, we were able to find some causal relationships of subjective pain and objective data. In the future, we will focus on pain forecasting, which means we will use current physiological data to estimate future pain. Pain forecasting is very important in pain management since pain relief medicines take time to work. Therefore, if we can forecast future pain, we can suggest medication usage in advance to help stop patients from feeling pain.
Built With
- matlab
- tetrad


Log in or sign up for Devpost to join the conversation.