-
-
catstream bannner
-
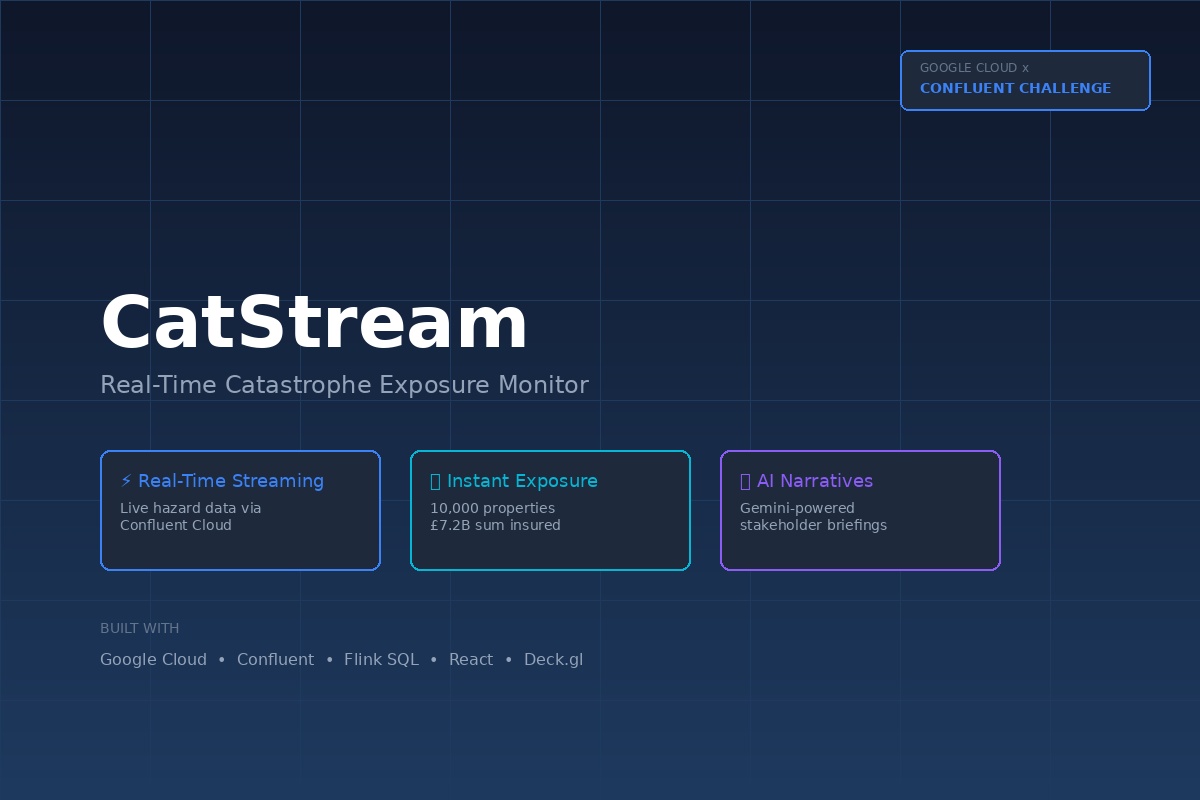
catstream features
-

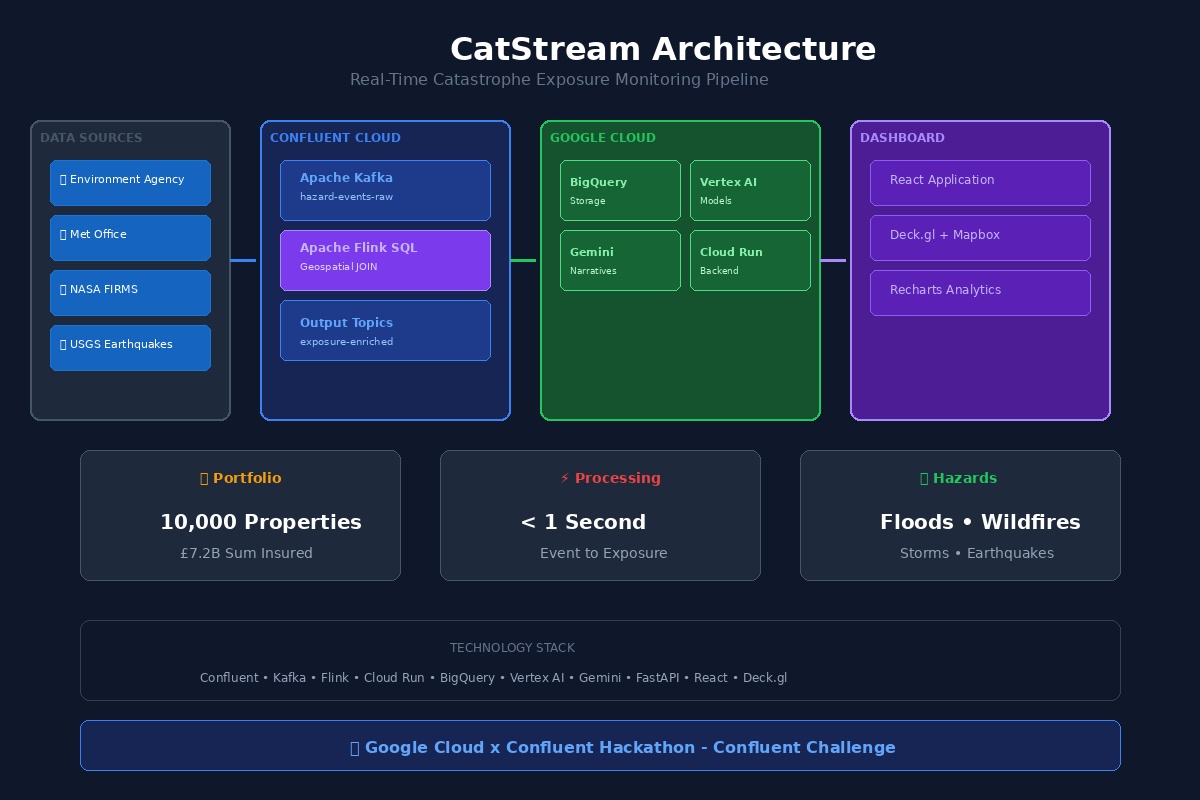
catstream architecture
-
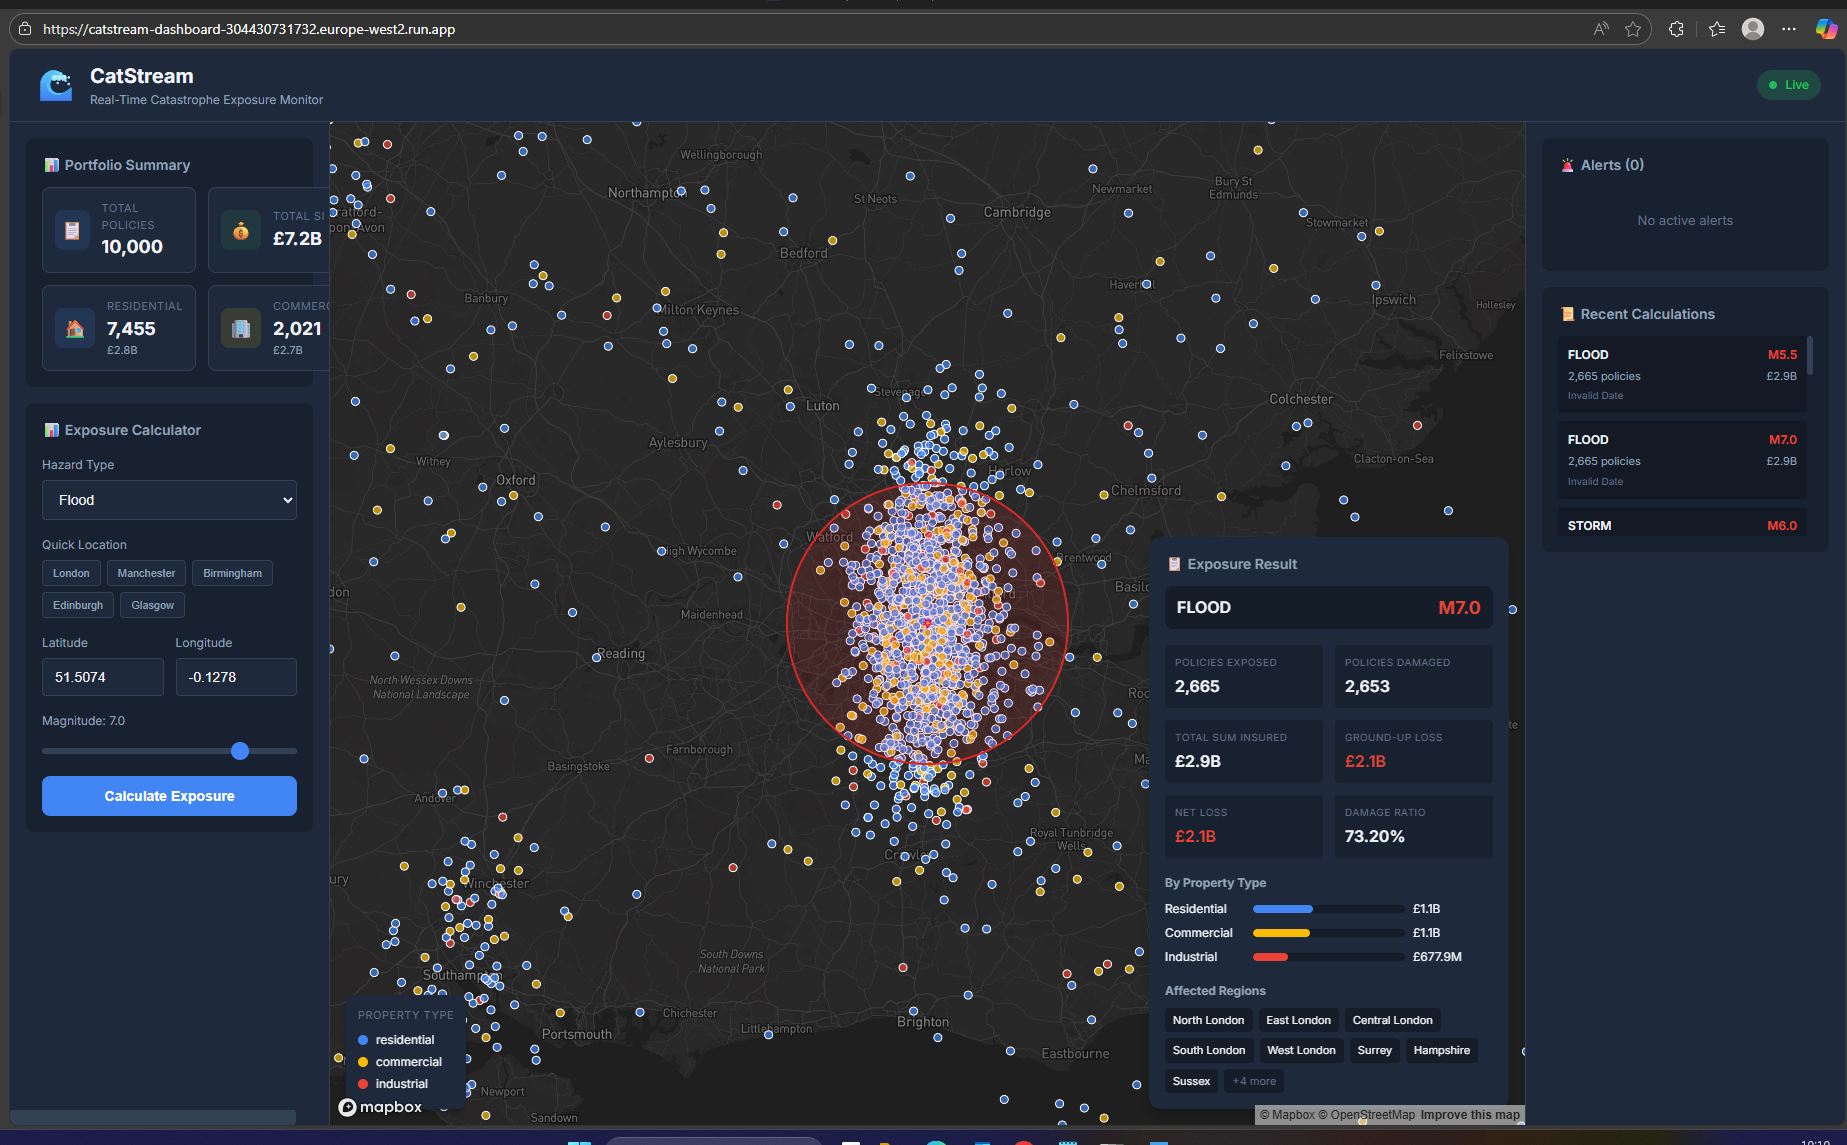
catstream dashboard
Inspiration
Working as an actuarial auditor in UK insurance for over 15 years, I've witnessed a persistent disconnect: catastrophe exposure management remains stubbornly batch-oriented in an increasingly real-time world. When Storm Babet swept across the UK in October 2023 causing £600M+ in insured losses, or when Storm Henk flooded the Midlands in January 2024, risk managers across the industry were scrambling - pulling yesterday's portfolio snapshots, manually cross-referencing postcodes against Environment Agency flood maps, and producing exposure estimates that were already outdated by the time they reached reinsurance partners.The technical provisions cycle in IFRS 17 and Solvency II assumes periodic recalculation. But climate volatility doesn't respect quarterly reporting deadlines. I kept asking myself: what if insurers could see their catastrophe exposure updating in real-time, as a weather event develops?The Google Cloud x Confluent Hackathon provided the perfect catalyst. Confluent's streaming platform could ingest live hazard data continuously, while Google Cloud's AI capabilities could transform raw exposure aggregates into actionable intelligence. Having spent years working with actuarial modelling systems like Prophet, AXIS, and MoSes - all fundamentally batch-oriented - I wanted to build something that demonstrated what modern streaming architecture could offer the insurance industry.
What it does
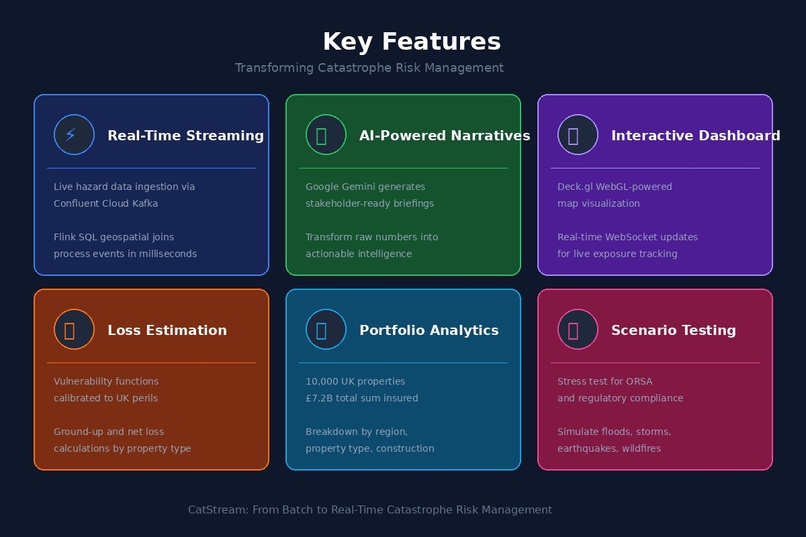
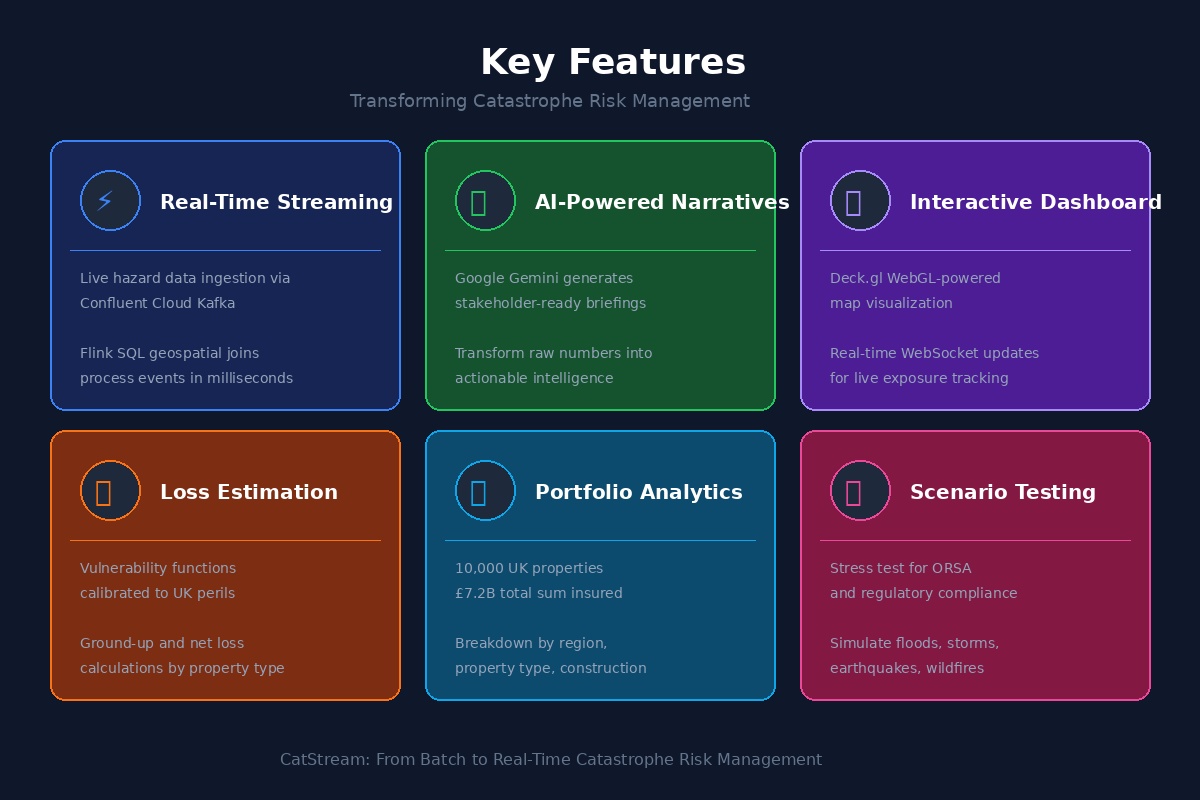
CatStream is a real-time catastrophe exposure monitoring system designed for property insurers. It transforms traditional batch-based catastrophe management into continuous streaming analytics.
Core Capabilities
Real-Time Hazard Monitoring Streams live event data (floods, earthquakes, wildfires, storms) In production, connects to Environment Agency flood warnings, Met Office alerts, USGS earthquake feeds, and NASA FIRMS wildfire data Instant Exposure Aggregation
Maintains a 10,000-property UK portfolio ($7.2B total sum insured) Calculates affected policies, total exposure, and estimated losses within seconds of event detection Breaks down impact by property type (residential, commercial, industrial) and geographic region AI-Powered Narratives
Generates stakeholder-ready summaries using Google Gemini Produces briefings suitable for claims teams, reinsurance partners, and executive leadership Interactive Visualization
Deck.gl-powered map showing portfolio distribution and event impact zones Real-time WebSocket updates as exposure calculations complete Scenario testing for stress testing and ORSA (Own Risk and Solvency Assessment) requirements
How we built it
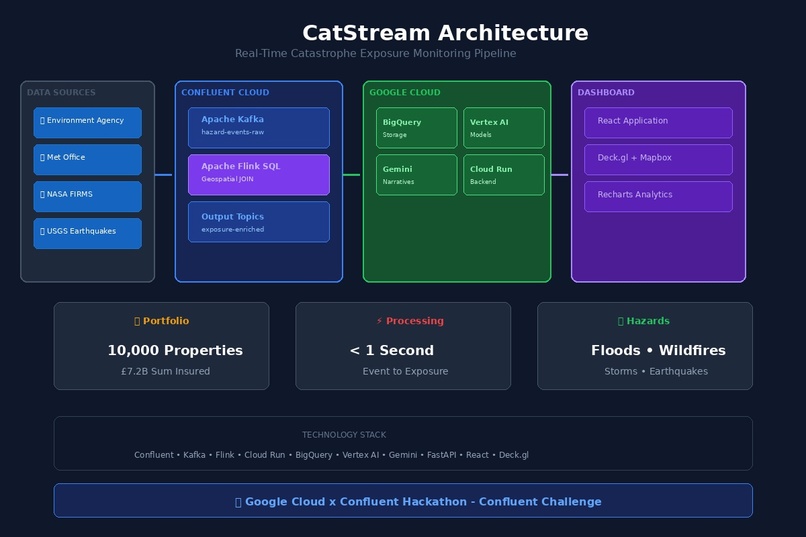
┌─────────────────┐ ┌─────────────────┐ ┌─────────────────┐ │ Hazard APIs │────▶│ Confluent Cloud │────▶│ Flink SQL │ │ (USGS, EA, Met) │ │ (Kafka Topics) │ │ (Geo-Spatial │ └─────────────────┘ └─────────────────┘ │ Join) │ └────────┬────────┘ │ ┌────────────────────────────────▼────────┐ │ Google Cloud │ │ ┌──────────┐ ┌──────────┐ ┌────────┐ │ │ │ BigQuery │ │Vertex AI │ │ Gemini │ │ │ │(Storage) │ │ (Models) │ │ (NLG) │ │ │ └──────────┘ └──────────┘ └────────┘ │ └────────────────────────────────┬────────┘ │ ┌────────────────────────────────▼────────┐ │ Cloud Run │ │ ┌──────────────┐ ┌──────────────────┐ │ │ │ FastAPI │ │ React Dashboard │ │ │ │ Backend │ │ (Deck.gl Map) │ │ │ └──────────────┘ └──────────────────┘ │ └─────────────────────────────────────────┘
Challenges we ran into
Geospatial Streaming Complexity The conceptually simple operation of "find all policies within X km of this event" becomes surprisingly complex in a streaming context. Flink's geospatial functions require careful configuration, and ensuring consistent coordinate reference systems (WGS84 throughout) took multiple iterations.
Realistic Portfolio Generation Creating a believable synthetic portfolio required understanding UK property insurance realities: construction mix varies by region (more masonry in Scotland, more frame in newer developments), sum insured distributions follow heavy-tailed patterns, and geographic concentration around urban centres creates realistic aggregation risk.
Vulnerability Model Calibration Without access to proprietary catastrophe model vendor data (RMS, AIR, CoreLogic), I built simplified vulnerability curves based on published academic research and industry guidelines. Ensuring the damage ratios were reasonable—neither trivially small nor implausibly catastrophic—required iterative testing against known historical events.
Frontend Performance Rendering 10,000 portfolio points while maintaining smooth interaction required moving from basic mapping libraries to Deck.gl's WebGL-accelerated layers. The scatterplot layer with custom colour coding based on property type achieved 60fps rendering even during exposure calculations.
Environment Configuration Orchestrating credentials across Google Cloud, Confluent Cloud, and Mapbox while maintaining security (no credentials in code) and local development convenience required careful environment variable management and clear documentation.
Accomplishments that we're proud of
End-to-End Streaming Architecture CatStream isn't a batch process with a streaming veneer—it's genuinely event-driven from hazard ingestion through to dashboard updates. The architecture could scale to production volumes without fundamental redesign.
Actuarially Meaningful Output The exposure breakdowns, loss estimates, and scenario capabilities directly address real insurance workflows. A risk manager could use CatStream's output in an ORSA stress test or reinsurance treaty negotiation.
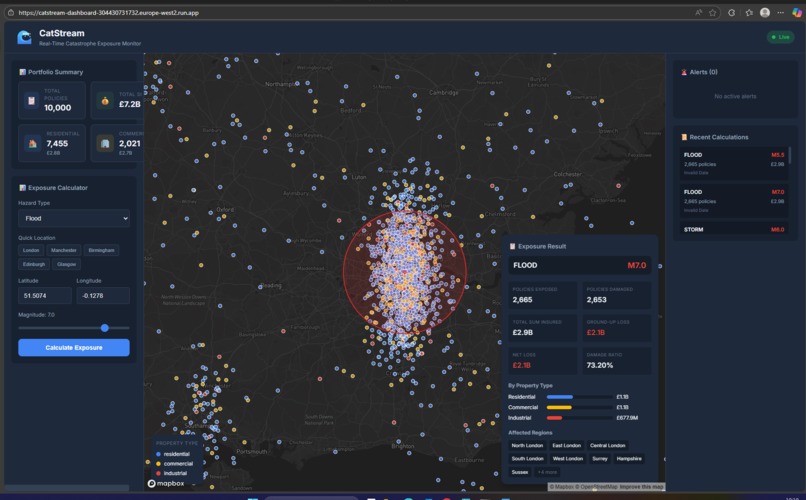
Production-Quality Dashboard The React/Deck.gl frontend looks and performs like professional insurance software, not a hackathon prototype. The UK-focused map, realistic portfolio visualisation, and responsive controls create a compelling demonstration.
AI-Generated Narratives The Gemini integration transforms raw numbers into stakeholder-ready briefings. Instead of just "£45M exposed," the system can generate: "A magnitude 6.5 flood event affecting Greater Manchester has impacted 847 residential properties with an estimated ground-up loss of £12.3M. Recommend activating regional claims surge protocol."
Comprehensive Documentation The build guide documents every step from account creation through deployment, making the project reproducible for anyone who wants to adapt it for their own use case.
What we learned
Streaming Changes Everything Moving from batch to streaming isn't just a performance optimisation—it fundamentally changes what's possible. Questions that were impractical before ("what's our exposure right now?") become trivial.
Modern Cloud Integration Confluent and Google Cloud integrate remarkably smoothly. The Kafka → BigQuery connector, Vertex AI model deployment, and Cloud Run hosting work together without extensive glue code.
Insurance Domain Complexity Even a "simple" catastrophe model involves surprising depth: construction vulnerability, deductibles and limits, aggregate vs occurrence covers, reinstatement provisions. A production system would need substantially more sophistication.
Full-Stack Development Skills As someone whose background is primarily actuarial and data science, building a complete application—streaming infrastructure, backend API, frontend dashboard, cloud deployment—stretched my skills significantly. The hackathon forced rapid learning across the entire stack.
What's next for CatStream: Real-Time Catastrophe Exposure Monitoring
Production Data Integration Connect to live Environment Agency flood warning API, Met Office Hazard Manager, and USGS earthquake feeds rather than simulated events.
Enhanced Vulnerability Models Integrate with open-source catastrophe modelling frameworks (OasisLMF) for scientifically validated damage functions across multiple perils.
Reinsurance Layer Modelling Add treaty structures (excess of loss, quota share, aggregate covers) to calculate net exposure and reinsurer notifications automatically.
Portfolio Sync Build connectors to common policy administration systems (Guidewire, Duck Creek) for real portfolio data rather than synthetic test data.
Regulatory Reporting Generate pre-formatted outputs for Solvency II ORSA stress testing and Lloyd's Realistic Disaster Scenarios (RDS).
Multi-Tenant SaaS Package CatStream as a hosted service for mid-market insurers who lack internal cat modelling capabilities.
Built for the Google Cloud x Confluent Hackathon by an actuary who believes real-time risk management shouldn't be an oxymoron.
Built With
- ai/ml
- bigquery
- confluent
- deck
- flink
- geospatial
- google-cloud-sql
- kafka
- python
- react
- recharts
- rest
- vertex
- websocket

Log in or sign up for Devpost to join the conversation.