Inspiration
NYC closes almost every 311 complaint. But "Closed" is a status code, not an outcome. Buried in each ticket's free-text resolution description is what really happened: "unable to gain access to the location", "observed no criminal violation upon their arrival", "does not fall under the jurisdiction of this agency." Every one of those is a closed ticket and an unfixed problem, and nothing on any city portal distinguishes the two.
We wanted to build the chart that has never existed, because the data for it was locked in free text: an honest map of what actually happens after New Yorkers ask their city for help.
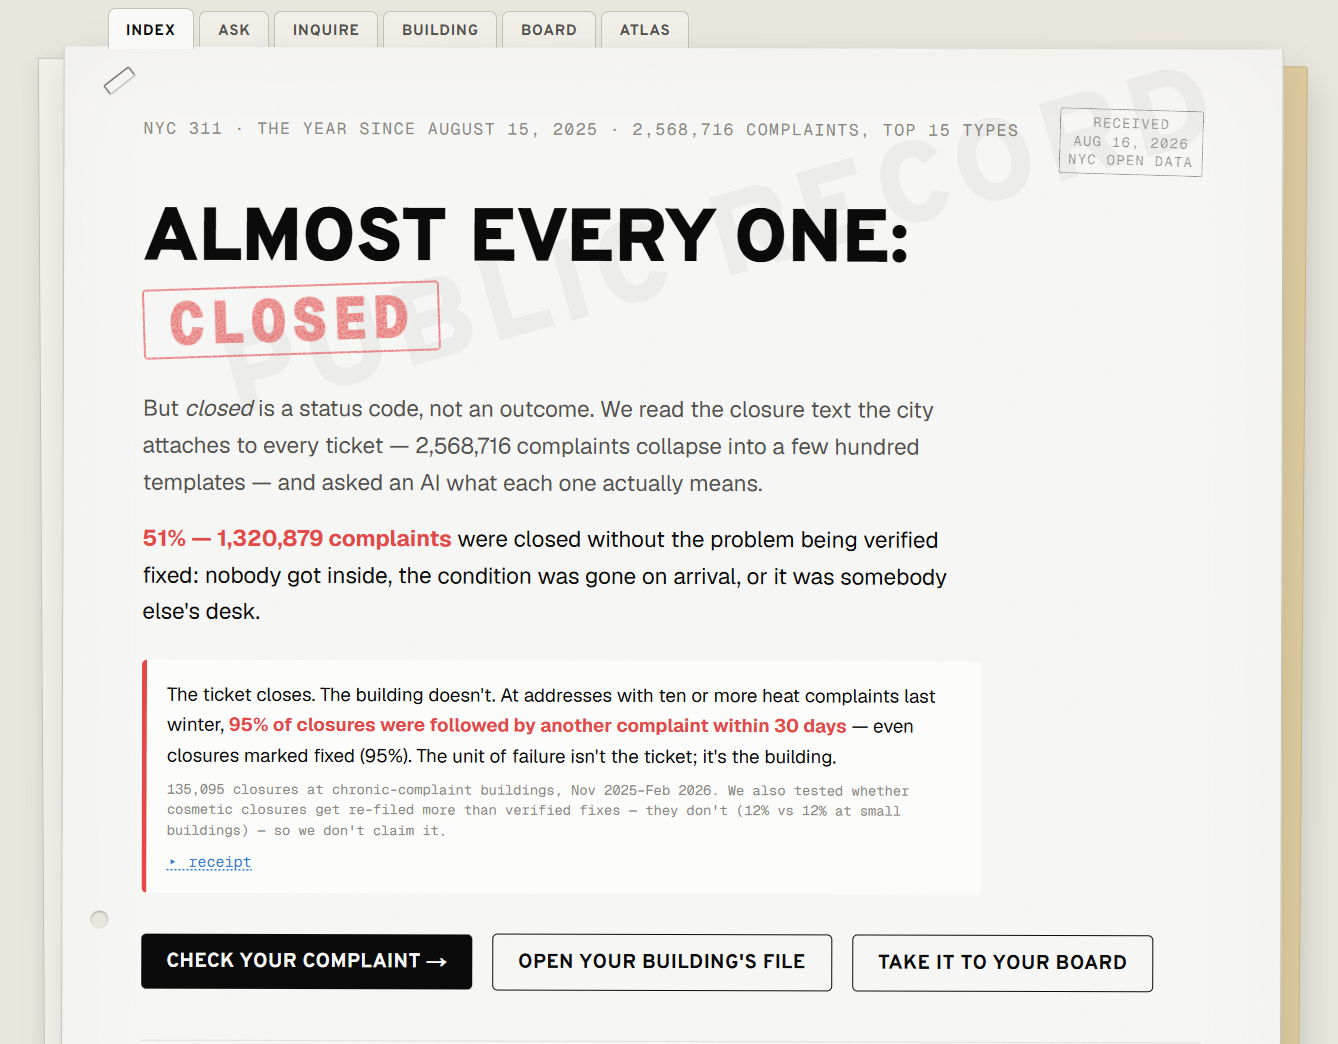
The verdict: 51%, over 1.3 million of 2.56 million complaints in the last 12 months, were closed without the problem being verifiably fixed.
What it does
Case Closed? is styled as a case file, and every number expands to the literal NYC Open Data query that produced it.
- The Honesty Index (
/), the city's 15 highest-volume complaint types, ranked by what "closed" really meant: verified fixed vs. cosmetic closure (no access, gone on arrival, wrong desk, no action) vs. duplicates/pending. Plus a Time Machine showing the cosmetic rate has held at 56–61% every year since 2020, across 18.9 million closures. - Before You Call (
/ask): describe your problem in plain English (or by voice, or with a photo, Gemini extracts evidence from the image). The model maps it into the city's official 460-type taxonomy, shows your real odds based on identical complaints near you, predicts your most likely ending, and generates a playbook plus an editable, evidence-backed letter. - Ask the Record (
/inquire): an agent that writes live SoQL queries against NYC Open Data. The query itself is displayed as the receipt, including when the model's first attempt is rejected and it self-corrects. - Building dossiers (
/building): a five-year case history for any address. Worst offender: one Harlem building with 1,100+ complaints and a ~10% fix rate. - Community board briefs (
/board): district stats with a printable AI-generated brief. - The Atlas (
/atlas): all 537 closure templates the city uses, with audit marks, plus a Translator: paste your own closure text and get the honest reading.
How we built it, the AI is not a chatbot
Five patterns, none of which is "send the user's text to a model and print the reply":
- AI as a compiler. There is no
WHEREclause for "nobody got inside." But the resolution text is heavily templated: millions of rows collapse into ~537 distinct templates via server-sideGROUP BY. Gemini classifies each template once, and each label is reused across tens of thousands of rows , ~537 calls annotate 18.9 million closures. Amortized inference, the opposite of per-request prompting. - AI audited by adversarial AI, with the record published. Every label is re-examined by a second model instructed to overturn the first. Upheld labels are notarized in the Atlas; confident overturns are adopted and marked "corrected on review"; low-confidence disagreements are published as contested, with both readings shown.
- An agent that operates the city's own query language. "Ask the Record" doesn't answer from model memory, it writes SoQL, we execute it live, and the query is the receipt.
- Hypothesis testing that can say no. We hypothesized cosmetic closures get re-filed more than verified fixes. We measured it (256k complaints, address-stratified), it's false, so the app doesn't claim it, and says so on the homepage.
- Generation grounded in observed failure modes. The playbook, the refile letter, and the board brief are generated against the actual closure templates that kill complaints like yours, every claim traces to a number on screen.
Stack: Next.js (App Router) + TypeScript + Tailwind, Gemini 2.5 Flash with structured output, and NYC Open Data's Socrata API (erm2-nwe9). All
aggregation happens server-side in Socrata via SoQL, the app never downloads raw rows.
Challenges we ran into
- The NYC Open Data portal went down mid-build. Twice. So every Socrata response is cached to disk and served on network failure with a "served from cache" badge, the demo kept working through both real outages.
- Free text has no schema. Discovering that 18.9M closures collapse into ~537 templates was the unlock that made classifying the entire dataset affordable.
- Trusting an LLM's labels at scale. Our answer: an adversarial second-model audit with the disagreement rate published on the page (484 upheld / 51 corrected / 2 contested).
- Zero-row queries on stage. Nearby-complaint lookups use a fallback chain (descriptor+ZIP → type+ZIP → citywide), so a blank screen is impossible.
What we learned
- The most valuable civic data is often locked in free text that nobody queries, and an LLM used as a compiler can unlock it for pennies.
- Publishing your model's disagreements builds more trust than hiding them.
- A negative result belongs in the product: saying "we tested this and it's false" is a feature.
What's next
Chronic-building early warning (95% of closures at chronic buildings are followed by another complaint within 30 days, even the "fixed" ones), other cities' 311 systems, and a public API for the honesty labels.
Built With
- gemini
- google-ai-studio
- next.js
- nyc-open-data
- rest-api
- socrata
- soql
- tailwindcss
- typescript
- vercel
- web-speech-api


Log in or sign up for Devpost to join the conversation.