

Inspiration
Climate change is increasing the frequency and intensity of environmental disasters. Events such as wildfires, floods, heatwaves, and droughts are no longer isolated incidents, they often trigger cascading effects across ecosystems, infrastructure, and communities.
For example, a heatwave may lead to drought, drought increases wildfire probability, and strong storms can trigger floods and landslides. These interconnected disasters create complex risks that are difficult to anticipate.
At the same time, knowledge about cascading climate hazards is spread across hundreds of environmental datasets and scientific publications.
Cascade was inspired by the idea of bringing this knowledge together into a single intelligent platform that helps people understand how climate risks evolve and interact.
Our goal was to create a system that turns complex environmental research into clear, visual, and actionable insights so communities can prepare for disasters rather than react to them.
What it does
Cascade is an AI-powered climate intelligence platform that analyzes environmental risks and models how disasters can cascade across ecosystems, infrastructure, and human systems.
The platform integrates environmental indicators and insights derived from over 500 climate and environmental research papers to generate more accurate insights about cascading hazards.
Users can explore environmental risks including:
- Wildfires
- Flooding
- Extreme heat
- Drought conditions
- Storm and wind events
- Air quality deterioration
Cascade focuses specifically on cascading climate risks, where one environmental event increases the probability of another.
Examples include:
- Heatwaves increasing wildfire probability
- Heavy rainfall triggering floods and landslides
- Drought weakening ecosystems and vegetation
- High winds damaging infrastructure
The system visualizes how these environmental hazards propagate through multiple layers of impact.
Cascading Impact Model
Cascade models environmental hazards using a multi-layer cascading impact framework.
Hazard Layer
Initial environmental trigger such as storms, extreme heat, or high winds.
Environmental Layer
Impacts on ecosystems such as vegetation stress, soil instability, or water imbalance.
Infrastructure Layer
Damage to transportation systems, buildings, and utilities.
Human Layer
Public safety risks and health impacts.
Economic Layer
Business disruption and financial losses.
This layered approach allows Cascade to model how a single environmental trigger can propagate across interconnected systems, producing cascading effects.
Key Features
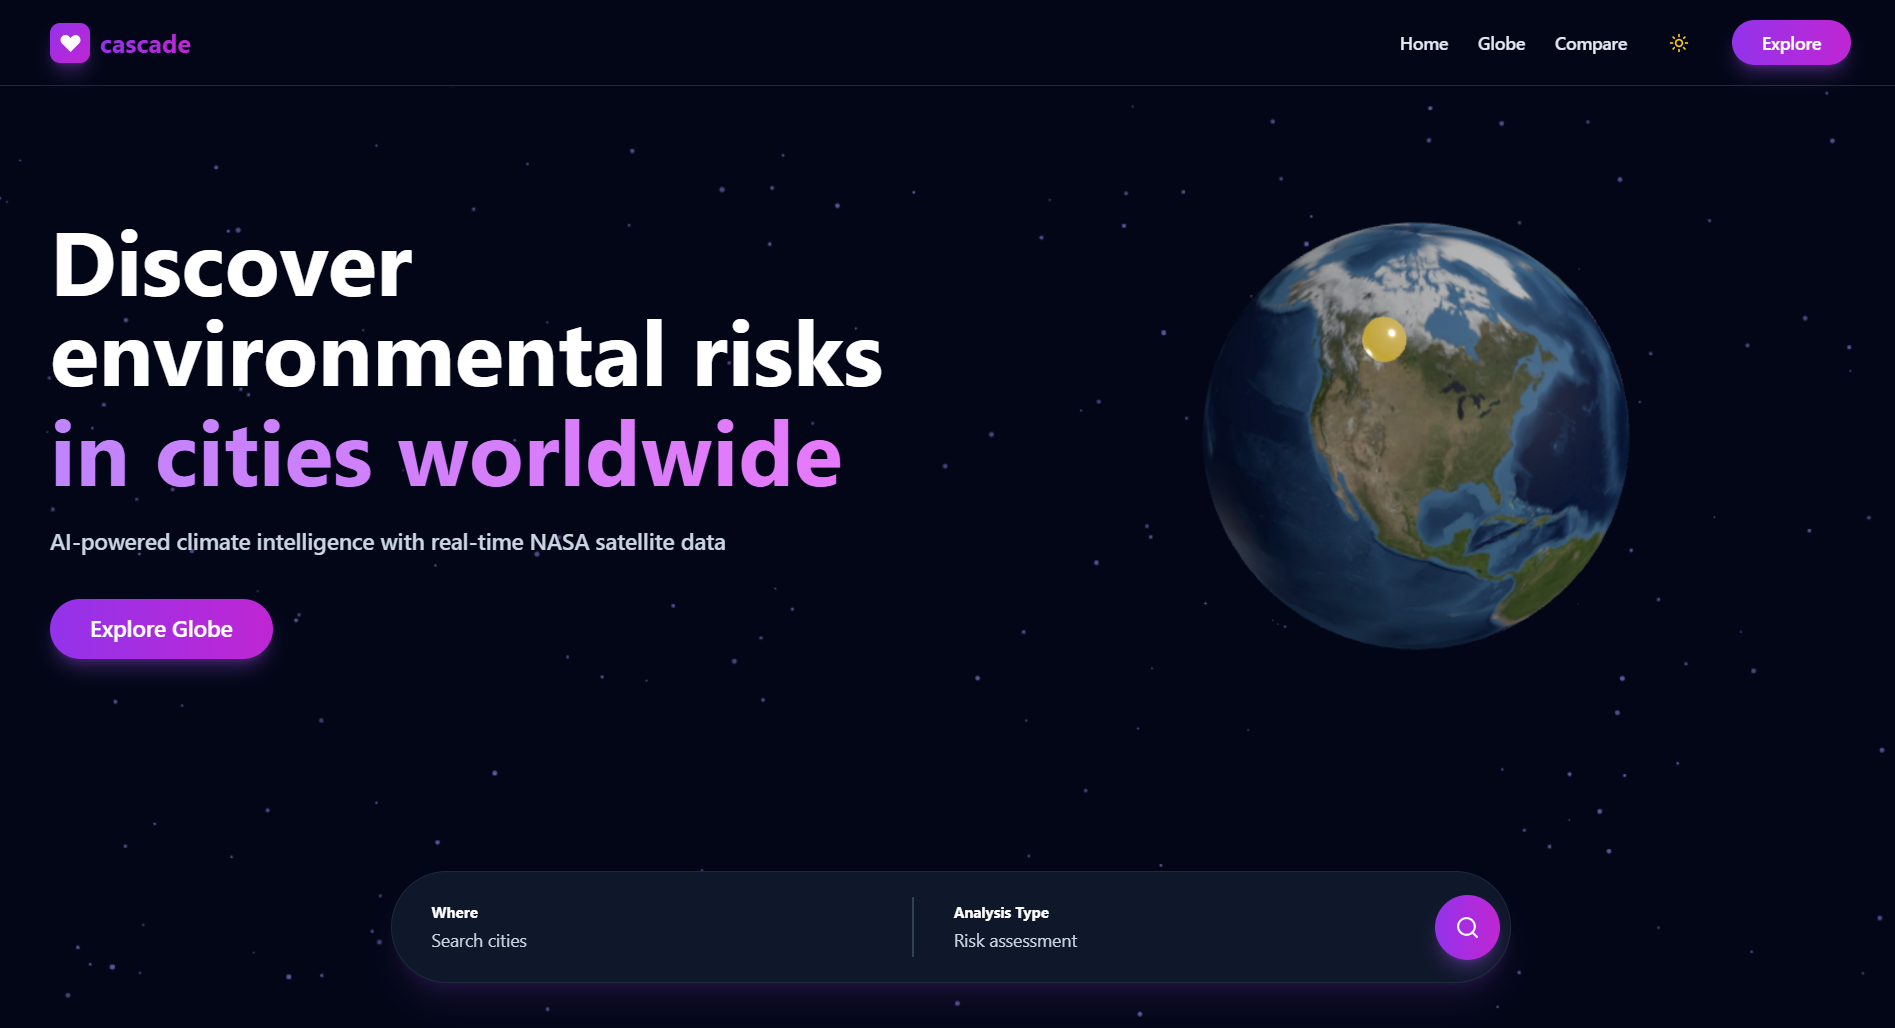
Global Climate Risk Explorer
Cascade provides an interactive world map where users can explore environmental risks across cities worldwide.
Users can search any location and instantly analyze climate patterns and environmental hazards.
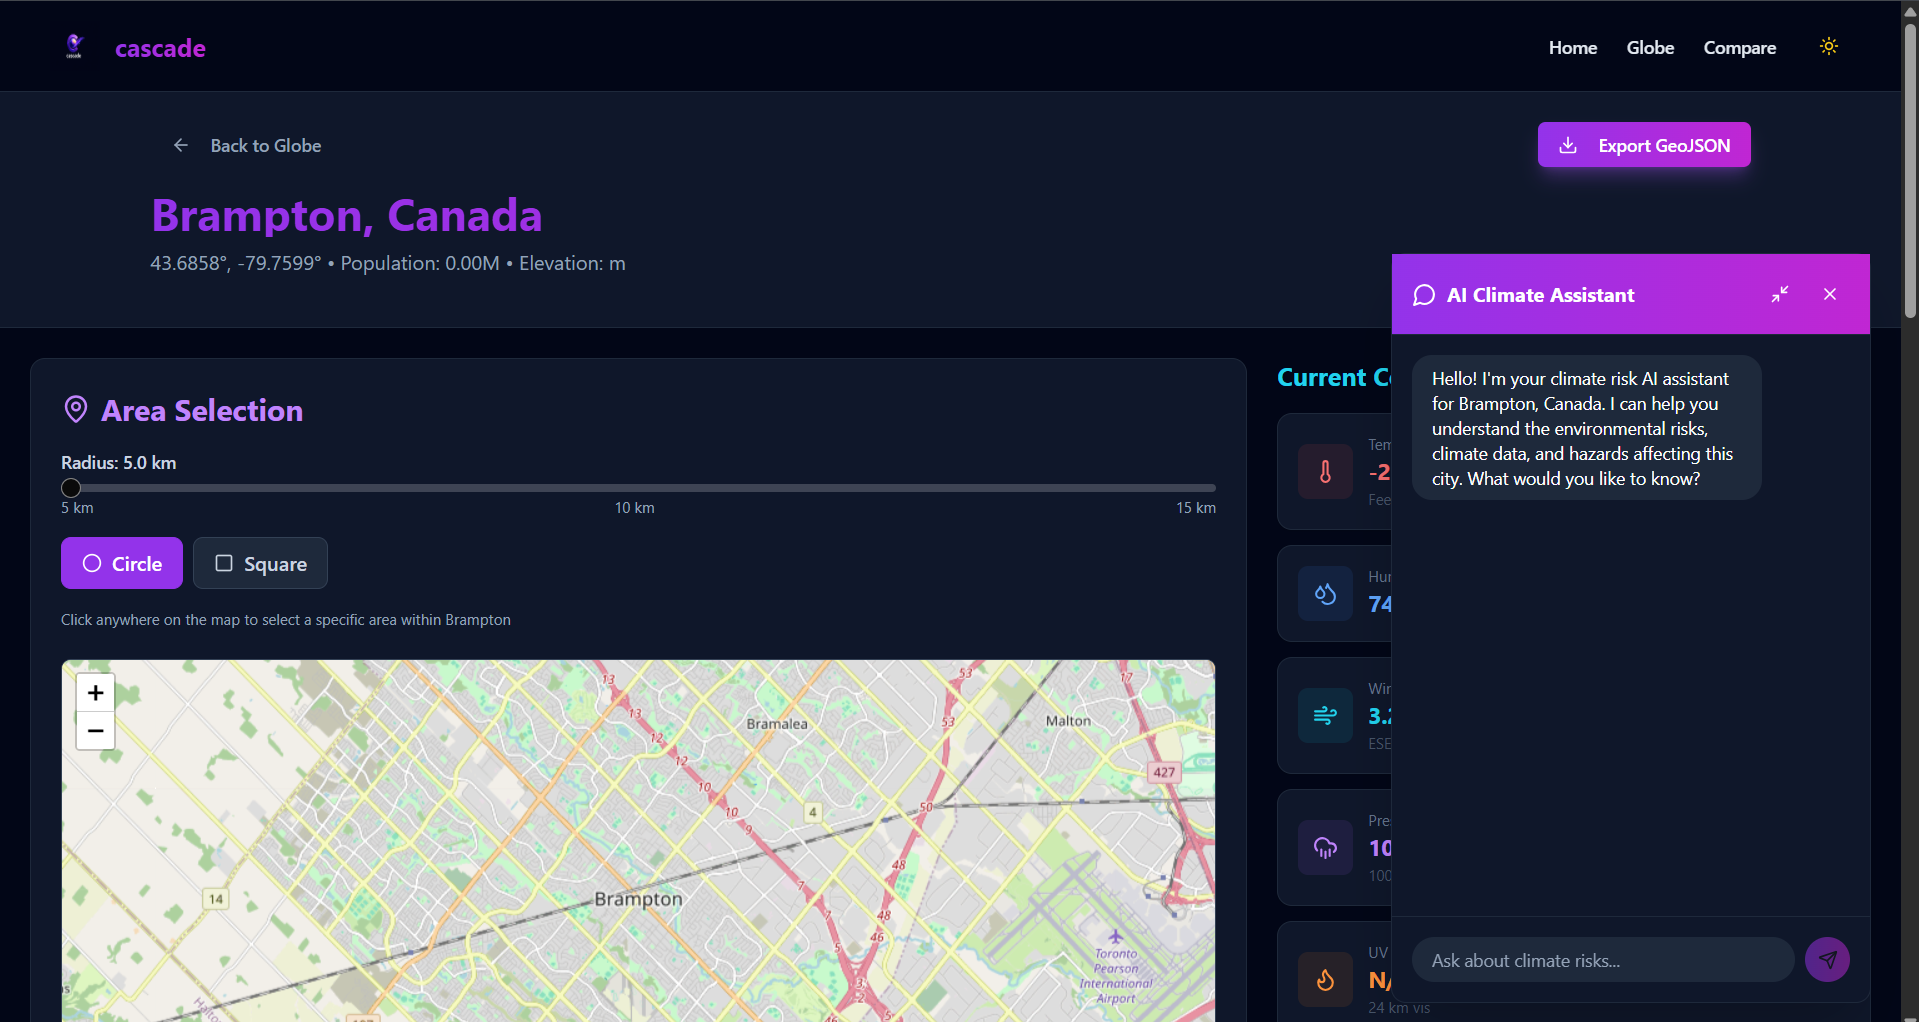
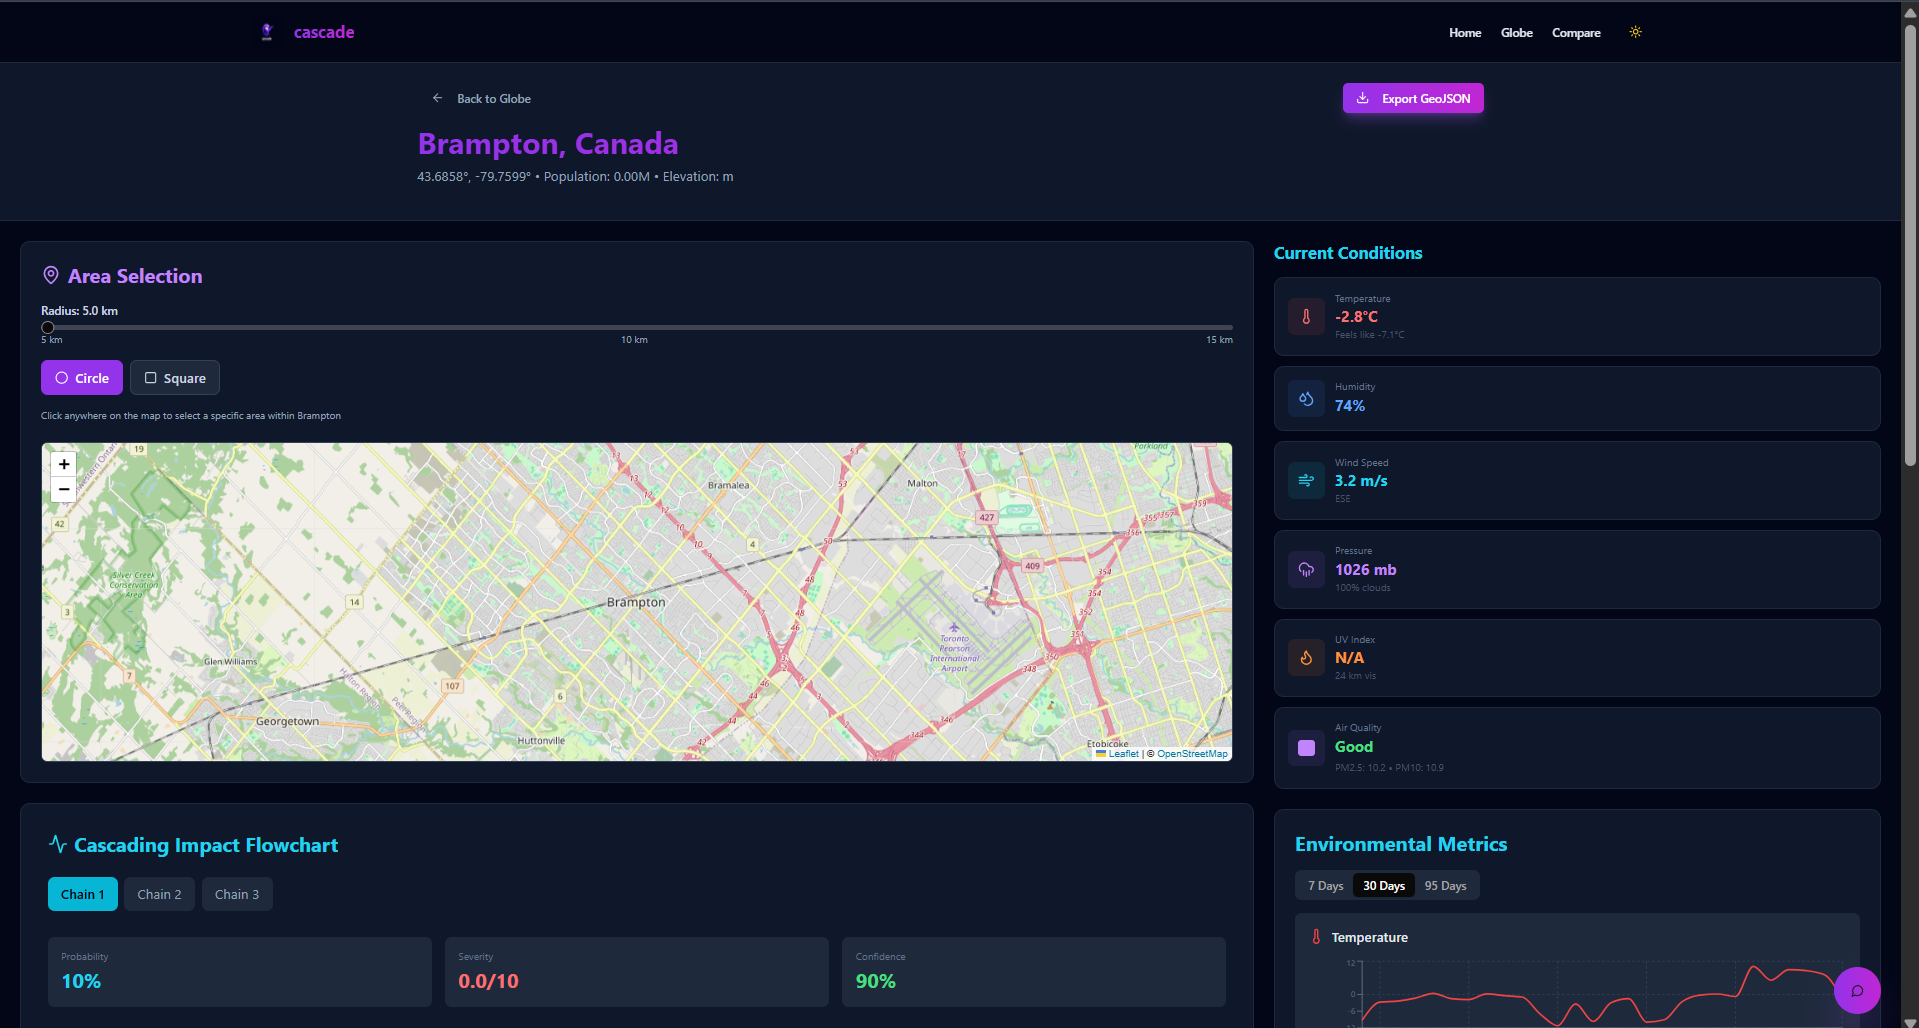
Local Area Risk Analysis
Cascade allows users to analyze specific geographic areas within cities.
Users can:
- adjust analysis radius from 50 meters to 5 kilometers
- select circle or square analysis zones
- analyze neighborhoods or infrastructure areas
This enables hyper-local climate intelligence.
Cascading Risk Flow Visualization
Cascade visualizes cascading environmental impacts using interactive diagrams that show how hazards propagate through:
- ecosystems
- infrastructure
- human systems
- economic systems
Impact & Research Foundation (500+ Papers)
Cascade is built on a strong scientific foundation informed by over 500 peer-reviewed climate and environmental research papers studying cascading hazards, climate risk modeling, and disaster propagation.
Research across multiple fields including climate science, environmental engineering, disaster risk modeling, and geospatial analytics shows that environmental disasters rarely occur in isolation. Instead, hazards often trigger chain reactions across natural and human systems.
For example:
- Extreme heat increases vegetation dryness, raising wildfire probability
- Heavy rainfall can saturate soil and trigger floods and landslides
- Drought conditions weaken ecosystems, making landscapes more vulnerable to fires and storms
- Severe storms can damage infrastructure, disrupting emergency response systems
These interconnected processes are commonly referred to as cascading climate hazards.
Cascade incorporates insights from climate research to model these interactions using probabilistic climate indicators and environmental data.
In simplified form, cascading hazard propagation can be represented as:
$$ P(Event_{cascade}) = P(Event_1) \times P(Event_2 \mid Event_1) $$
Where:
- (Event_1) represents the initial environmental hazard
- (Event_2) represents a secondary cascading impact
This research-driven approach enables:
- better risk awareness
- improved disaster preparedness
- more informed urban planning
- stronger climate resilience strategies
Ultimately, Cascade aims to bridge the gap between scientific climate research and real-world decision making.
Environmental Metrics & Climate Indicators
Cascade analyzes environmental indicators such as:
- temperature trends
- precipitation levels
- wind speed variation
- atmospheric pressure
- Excess Heat Factor (EHF) heatwave indicator
- Standardized Precipitation Index (SPI-12) drought indicator
Users can explore environmental metrics across 7-day, 30-day, and 95-day periods.
Climate Modeling Methodology (Excess Heat Factor)
To detect extreme heat events, Cascade uses the Excess Heat Factor (EHF), a widely used metric in climate science for identifying heatwaves.
EHF Calculation
[ T_3 = \frac{T_i + T_{i-1} + T_{i-2}}{3} ]
[ T_{30} = \frac{1}{30}\sum_{k=i-3}^{i-32} T_k ]
[ EHI_{sig} = T_3 - T_{95} ]
[ EHI_{accl} = T_3 - T_{30} ]
[ EHF = EHI_{sig} \times \max(1, EHI_{accl}) ]
A heatwave is typically identified when EHF remains positive for at least three consecutive days.
Daily mean temperature is commonly calculated as:
[ T_i = \frac{T_{\max,i} + T_{\min,i}}{2} ]
This allows Cascade to detect heatwaves based on climate anomalies rather than fixed thresholds.
Drought Detection Methodology (SPI-12)
Cascade also evaluates long-term drought conditions using the Standardized Precipitation Index (SPI-12).
SPI-12 Interpretation
- Positive SPI-12 → wetter than normal
- Negative SPI-12 → drier than normal
- Around 0 → near normal conditions
SPI-12 Calculation
Collect monthly precipitation totals for the location.
Compute the current 12-month precipitation total
[ P_{12} = \sum_{k=i-11}^{i} P_k ]
Build historical 12-month totals ending in the same month.
Fit a probability distribution to historical totals
(commonly Gamma or Pearson Type III).Compute cumulative probability.
Convert probability to a standard normal score:
[ SPI = \Phi^{-1}(F(P_{12})) ]
Where:
- (F(P_{12})) = cumulative probability
- (\Phi^{-1}) = inverse standard normal distribution
SPI-12 helps detect long-term precipitation anomalies, making it useful for identifying drought risk.
Real-Time Environmental Conditions
Cascade integrates environmental signals including:
- temperature
- humidity
- wind speed
- air quality
- atmospheric pressure
- UV index
These indicators provide context for current climate risk conditions.
AI Climate Assistant
Cascade includes an AI-powered assistant that helps users interpret environmental risks.
Users can ask questions about:
- climate hazards
- cascading risks
- environmental indicators
- climate trends
Data Export
Cascade allows users to export results for planning and analysis:
- GeoJSON exports
- PDF reports
This enables integration with geospatial tools and planning workflows.
How we built it
Cascade combines AI models, environmental datasets, and geospatial visualization tools.
The system integrates:
- NASA POWER climate datasets
- global environmental datasets
- insights from 500+ climate research papers
- geospatial mapping tools
- AI-based analysis models
Example processing logic:
heatwave_index = calculate_ehf(temperature_data)
cascade_chain = build_cascade_model(heatwave_index)
puts "Cascade risk chain generated"
Challenges we ran into
Working with climate datasets presented several challenges.
Environmental data often comes from multiple sources with different formats, resolutions, and update frequencies, requiring significant preprocessing.
Another challenge was modeling cascading environmental interactions, since disasters rarely occur independently.
We also needed to design visualizations that communicate complex environmental relationships without overwhelming users.
Balancing scientific accuracy, technical complexity, and usability was a key challenge.
What we learned
Through this project we learned how powerful AI, climate science, and geospatial data can be when combined.
We also learned the importance of making complex scientific research accessible and understandable.
Cascade demonstrates how environmental research can be transformed into practical climate intelligence tools.
What's next for Cascade
Future improvements include:
- real-time disaster alerts
- predictive climate models
- integration with emergency response systems
- infrastructure vulnerability analysis
- historical climate trend simulations
- advanced cascading disaster prediction
Our long-term vision is to build a global climate intelligence platform that helps communities anticipate environmental risks and build resilience.


Log in or sign up for Devpost to join the conversation.