Cascade
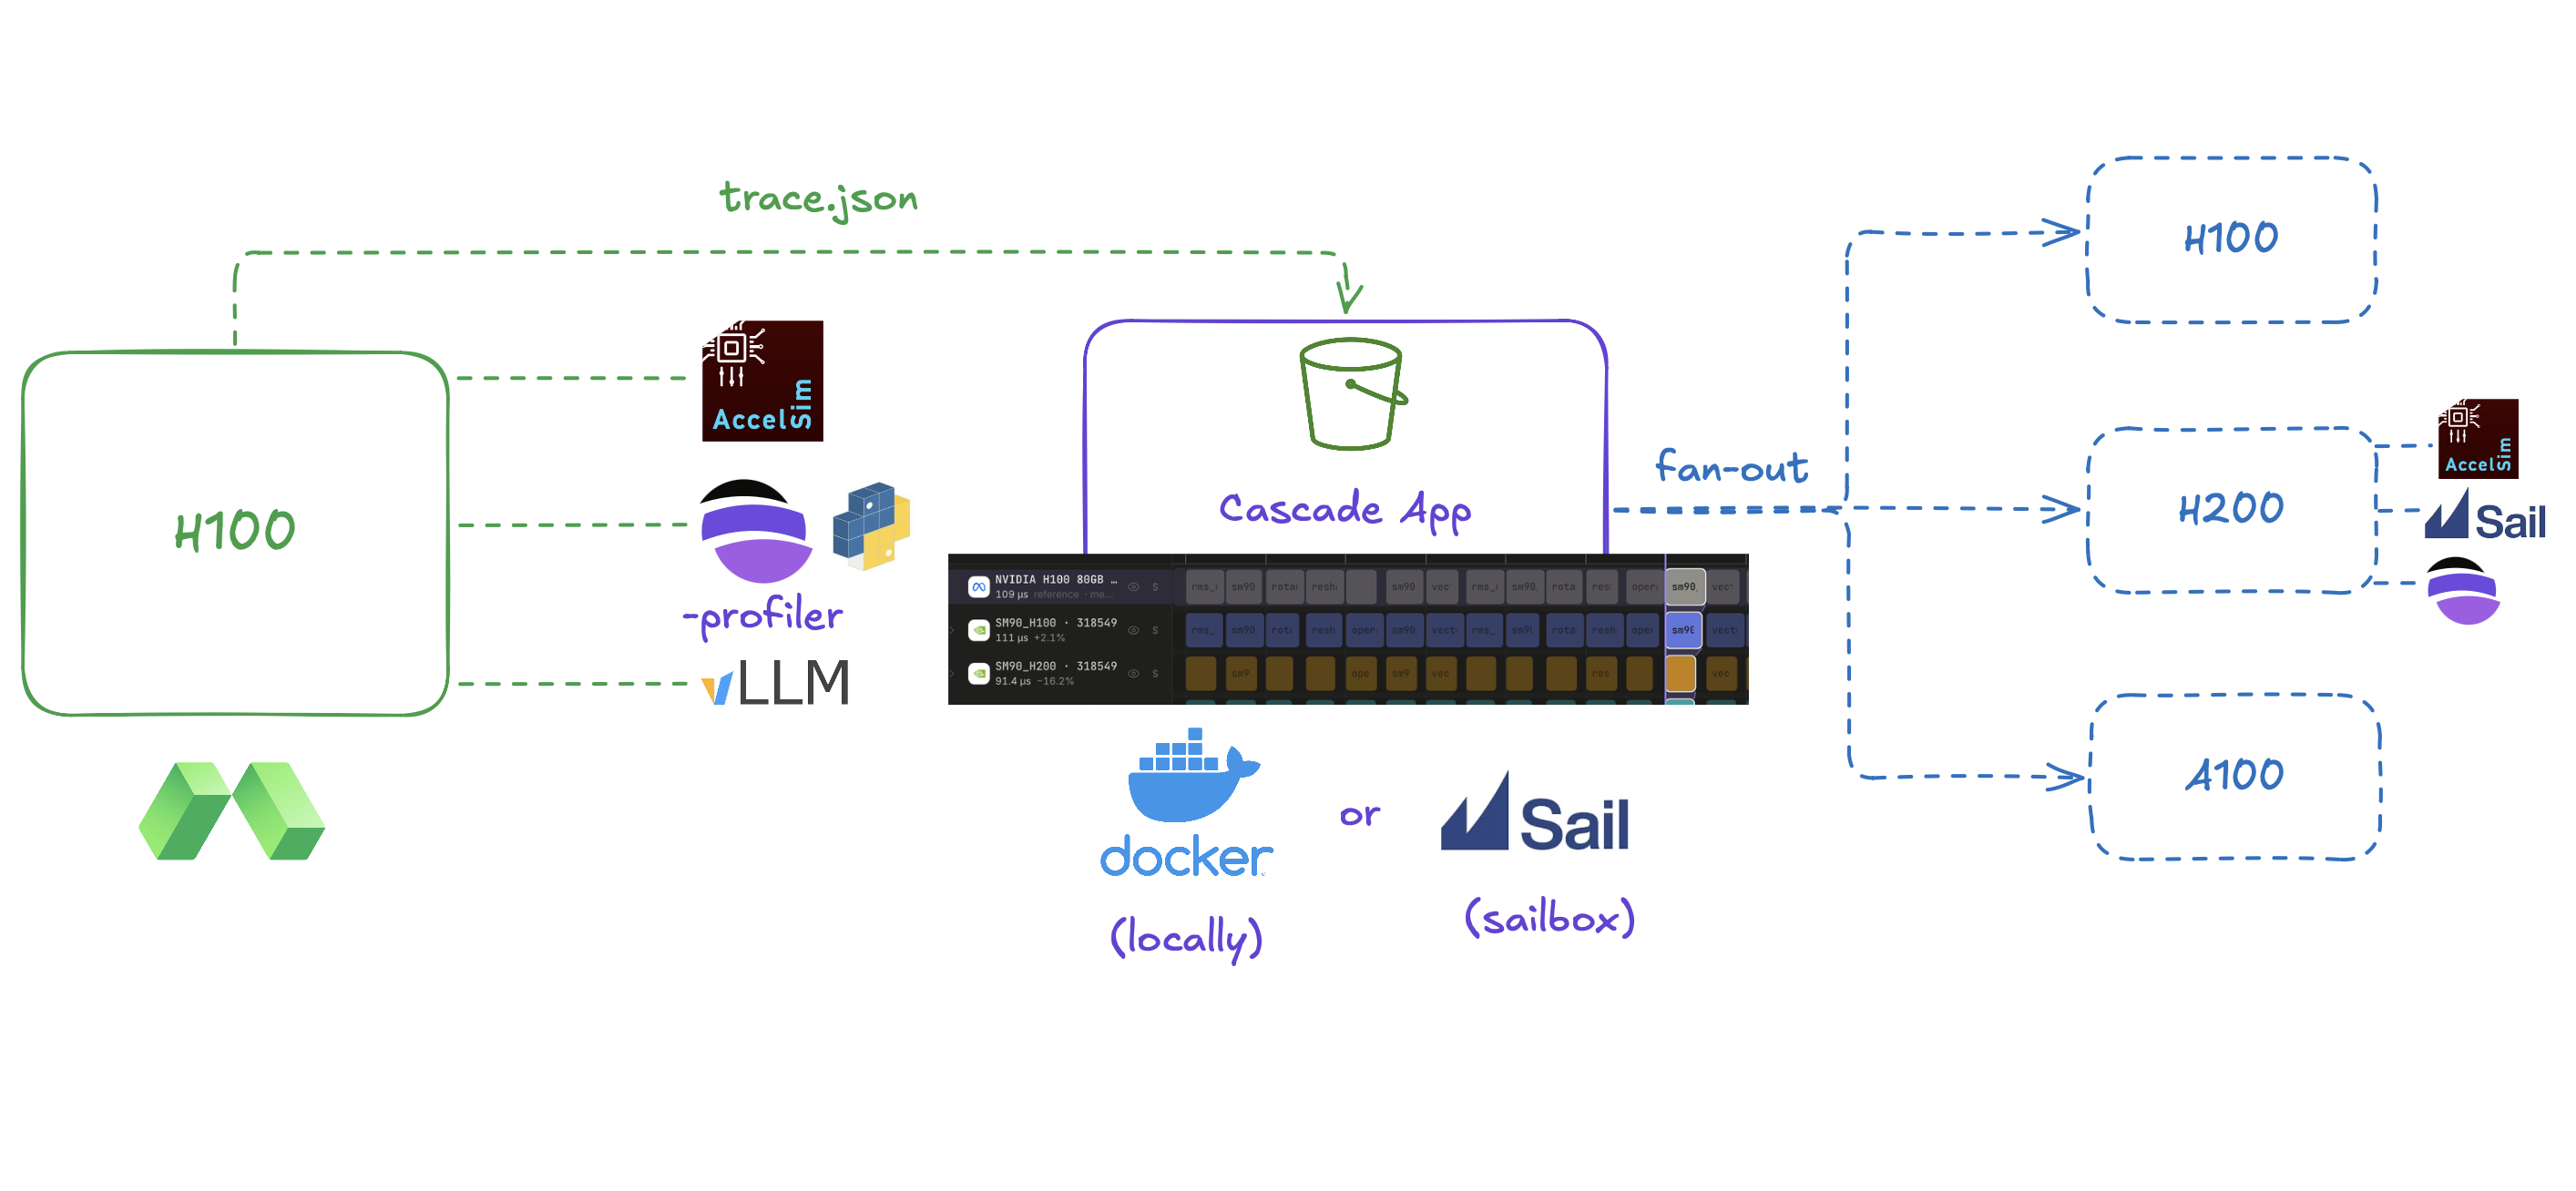
Trace once, simulate everywhere. Take a single real GPU trace of an LLM workload and simulate it on many GPU configurations in parallel, so you can see how a model would run on hardware you don't have.
Inspiration
Trace-driven simulation is the process of taking workload profiles from real devices and simulating them on different hardware architectures. Simulators such as gem5 and AccelSim have high-fidelity models for GPU simulation and are widely used by chip designers.
However, for LLM inference, which encompasses both model kernels and request-level scheduling, the industry and research communities lack a performant, modular platform for offline, end-to-end simulation of workloads.
Teams testing new parallelism strategies, LLM routing policies, and inference engine configurations must deploy live GPUs, benchmark, and relaunch. This feedback loop is slow and burns precious resources.
What It Does
Cascade takes one real GPU trace from an ML workload and simulates it on many GPU configurations at the same time. We currently support models running through the vLLM inference engine.
1. Trace Once
Run the profiler on a real GPU and it records every kernel of your vLLM workload with AccelSim's NVBit hardware counter, streaming the trace into Cascade while it's still tracing. By the time profiling ends, the trace is already in your workspace and ready to simulate.
Profiling is easy to set up:
- Import our public Python package
- Plug in your app's storage endpoint
- Specify the HuggingFace model you would like to profile
2. Fork per Configuration
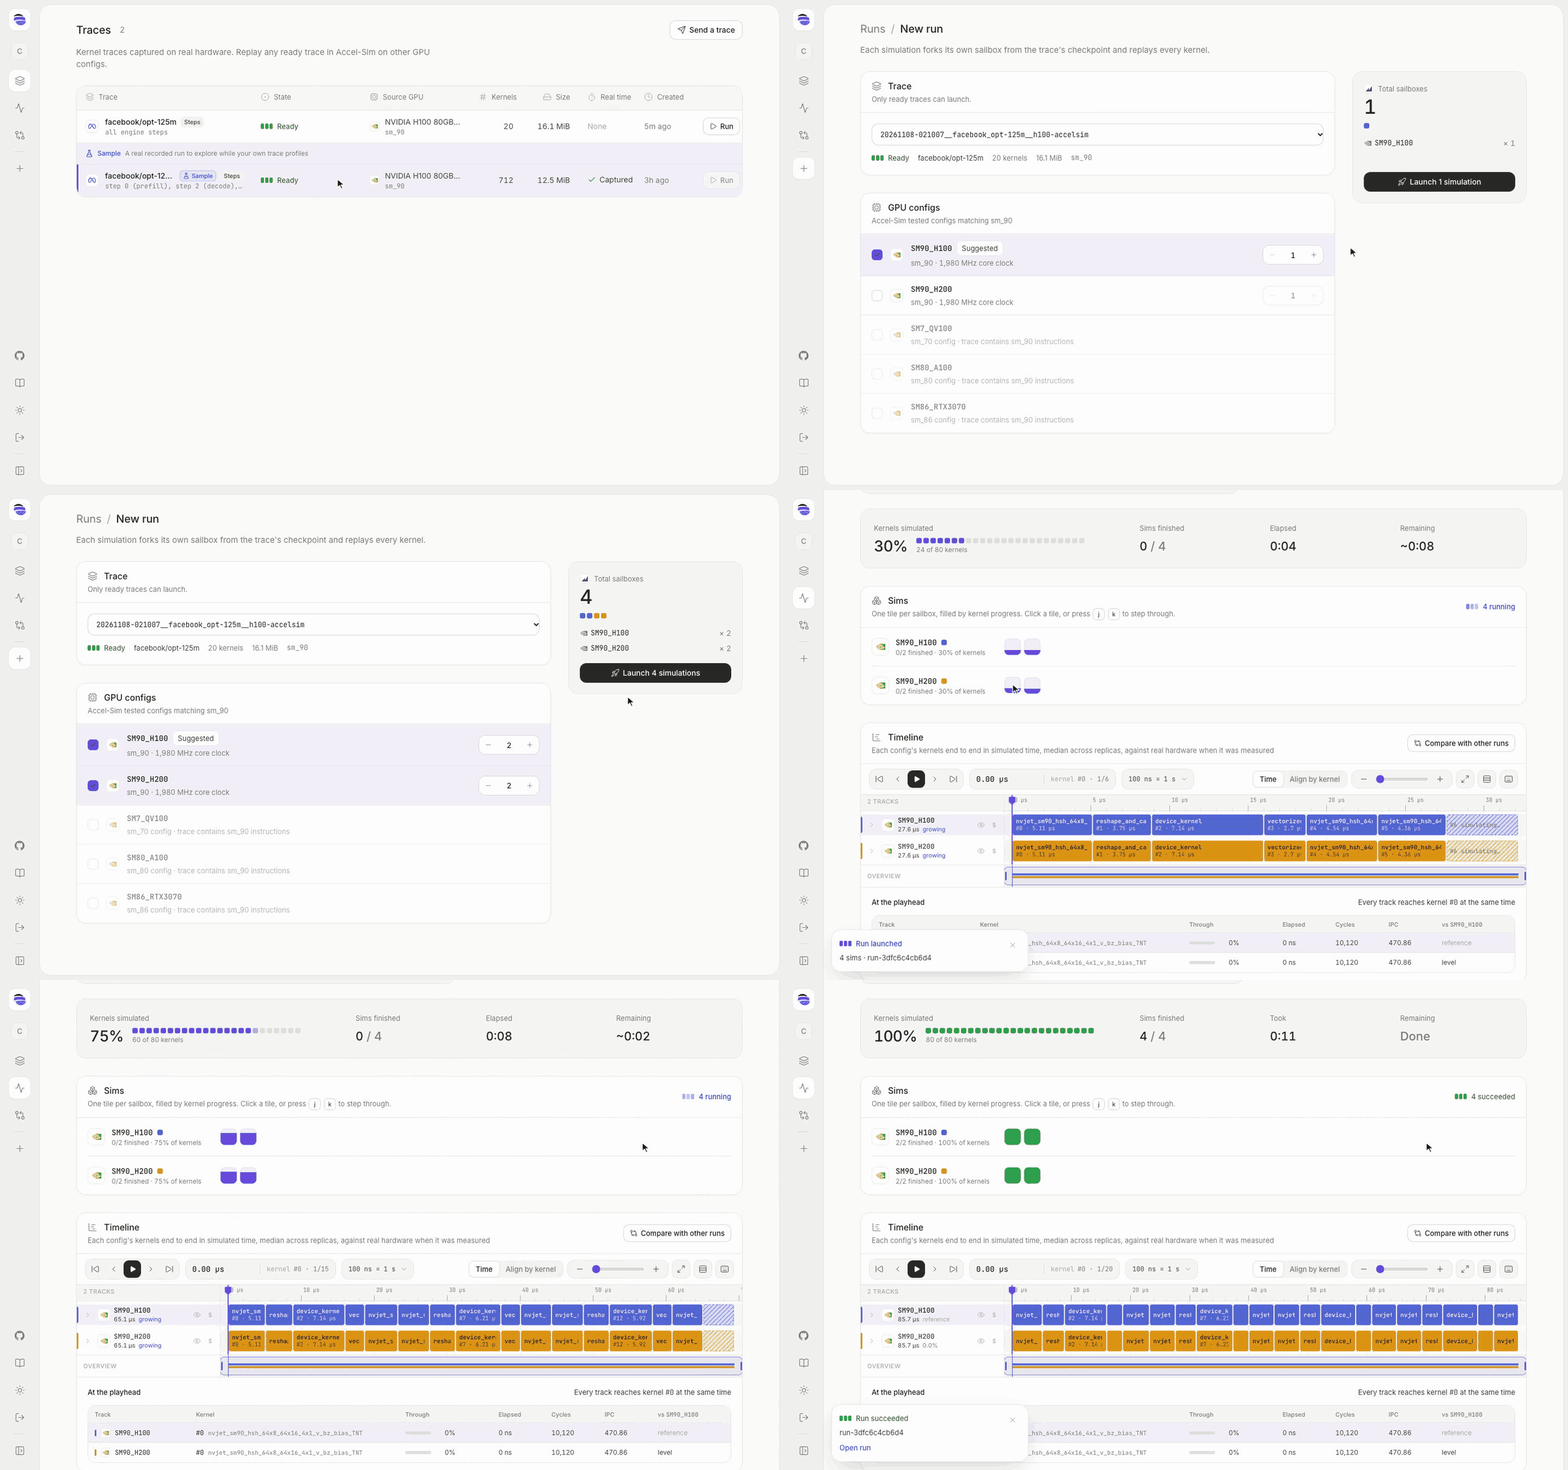
Pick the GPU configs you want (for example, an H100 and an H200 with two replicas each) and hit Run. Cascade checkpoints its own sandbox and forks a Sailbox per sim, each starting with the traces already on disk. In our runs, all forks run in parallel.
3. Watch It Happen
Every sim streams its output back live:
- Tiles fill as kernels finish
- Live output: open any simulator to read its output as it arrives
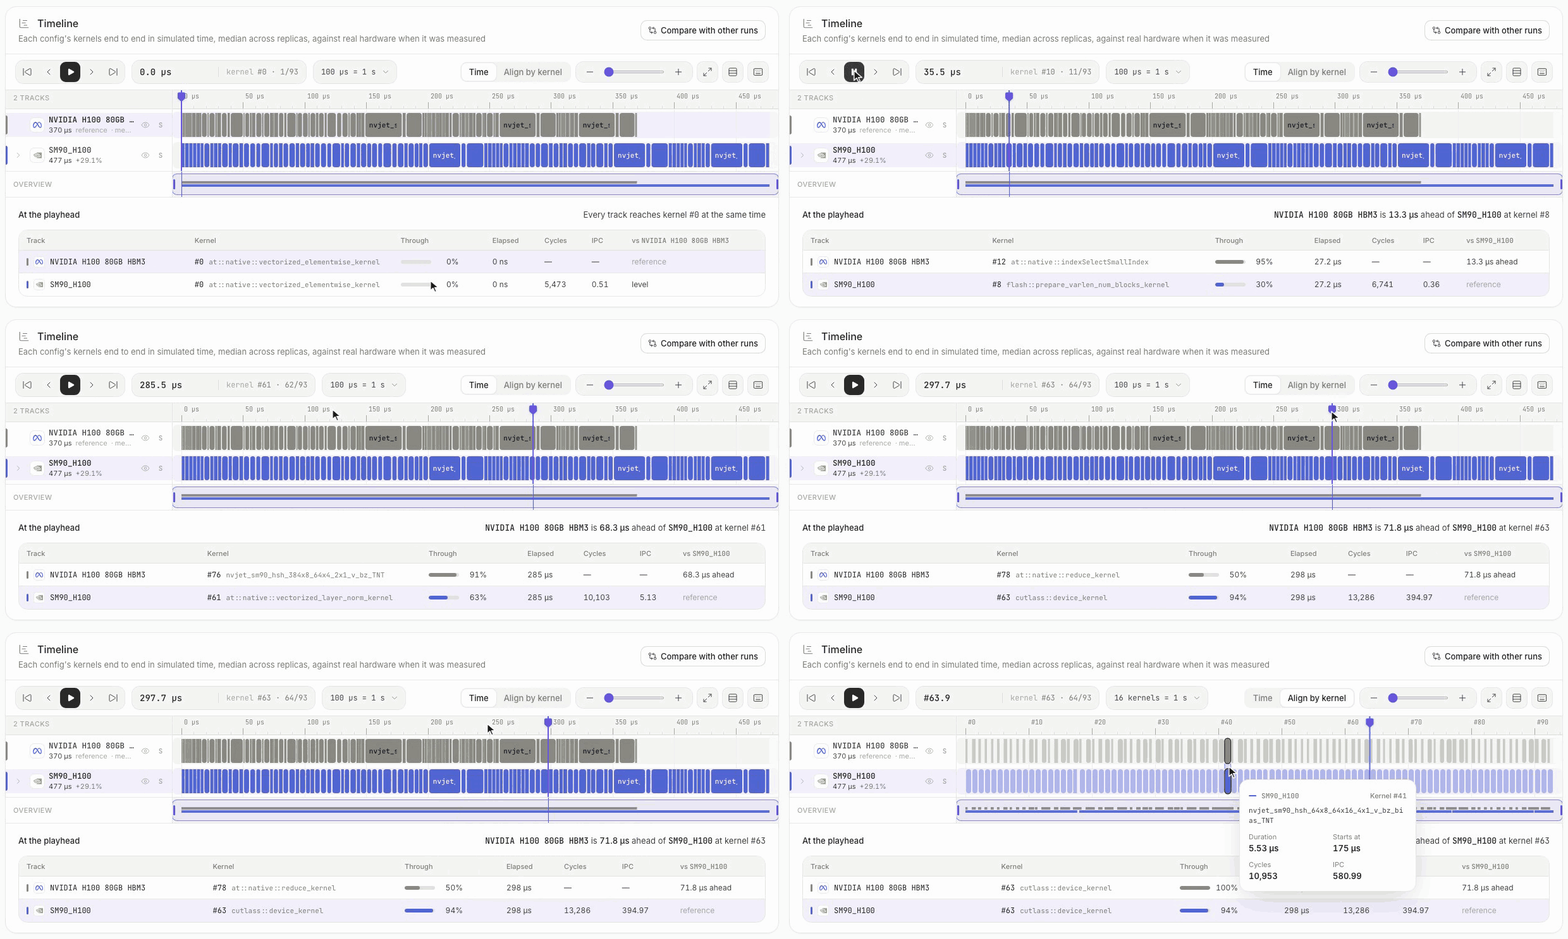
- Timeline: a video-editor-style / Rerun-style timeline grows by kernel for every config
- Compare: scrub through simulated time, line configs up by kernel, or lay multiple runs side by side
4. Read the Simulator Outputs
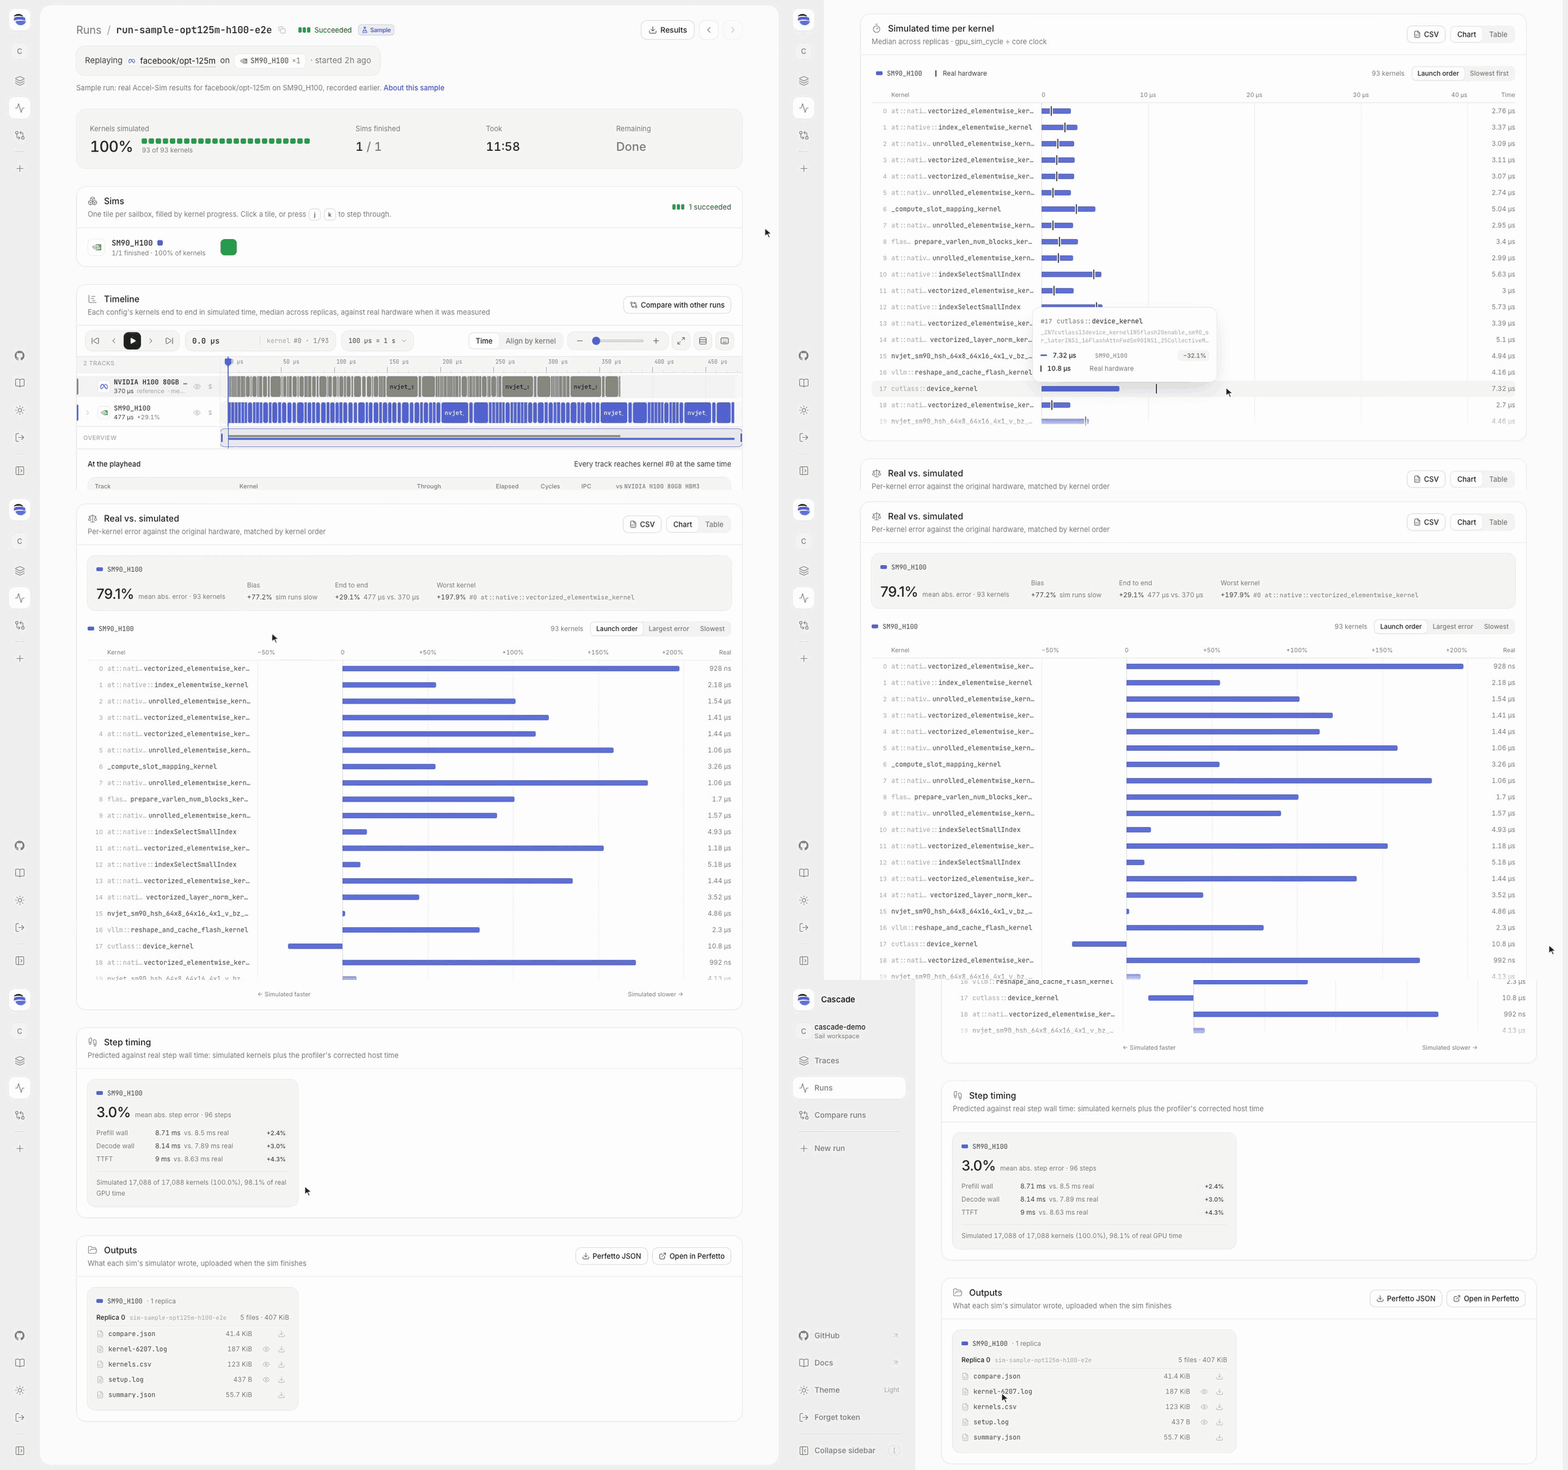
- Per-kernel charts show where the time goes on each GPU.
- When the trace includes real hardware timing, Cascade shows simulated time vs. real runtime for each kernel, along with every config's average error.
- It also predicts how long the whole request takes, combining the simulated kernels with the host time the profiler measured to estimate prefill and decode step times and time to first token (TTFT).
How We Built It
Back-end
We built the backend around two systems: a profiler and a simulator. Both leverage the AccelSim library, which provides profiling and simulation primitives for kernel instructions.
On top of AccelSim's capabilities, we used the Nsys Compute Profiler to get kernel-level timings, which are used to calculate the entire-request duration using the relative order from the profiled trace.
- The profiler ships as a Python package.
- The simulator runs as a subcommand on our main app's container.
Front-end
The frontend is a React + TypeScript app built with Vite, served by the sim FastAPI server that runs the API, so a workspace is a single URL.
- Every run page subscribes to a server-sent event (SSE) stream. A reducer folds each sim update, log chunk, and finished kernel into the page, which is how tiles fill, logs scroll, and the timeline grows live without polling.
- We drew the charts ourselves so a 1000-kernel run stays readable.
- The Rerun-style timeline renders on canvas, with per-frame state kept outside React.
- Some static pages are hosted on Vercel, where a small serverless function spins up a user's own workspace on Sail from just a name and API key.
Sail makes the live view possible: pressing Run checkpoints the workspace's sandbox and forks a Sailbox per sim in seconds. Each one starts with the trace already on disk, and every tile on the page is one of the forks reporting back as it works.
Challenges We Ran Into
Storing and sharing large trace files
A user of Cascade expects their profile to be shared seamlessly with the simulator backend. However, trace files are large (sometimes hundreds of GB!). We needed to deal with the costs of moving profiles from real GPUs to our app and distributing the traces to our many simulators.
We realized that if we wanted a central storage system for a user's profiled traces, a one-time transfer over the public internet couldn't be avoided. However, once our app receives the trace, we can use Sail Research's Sailboxes to run our app, checkpointing the filesystem once the trace is received and forking that filesystem as we fan out to Sailbox-powered simulators.
Running AccelSim efficiently
Profiling side: AccelSim provides a custom listener for NVIDIA's CUDA Profiling Tools Interface (CUPTI). However, profiling a live LLM pass is extremely slow, especially across many tokens. We realized that after running AccelSim on each individual GPU kernel, we could extrapolate per-kernel timings across context length.
Simulator side: We took the same approach as profiling, extrapolating certain kernel timings instead of repeating the same kernel simulation. Our simulator stitches together kernel timings and extrapolates across tokens, allowing for cheap, end-to-end predictions with <5% error against real GPU timings.
Accomplishments We're Proud Of
We are really proud of the accuracy of our simulator. Testing a prompt on Facebook's OPT-125m on a Modal H100:
| Simulated runtime | Real runtime | Error |
|---|---|---|
| ~261 ms | ~253 ms | ~3% |
This error accumulates not from our platform's timings but from AccelSim's instruction-level simulation, an irreducible error in the profiling process.
What We Learned
Alessio
The ecosystem behind characterizing fine-grained instructions on various GPU architectures is well-established. Hence, one would think that running these tools would be easy! It turns out that building a good simulator and running one is mainly a systems challenge: existing simulators are designed for a small set of instructions, maybe for chip designers testing a small machine learning workload. When large, trillion-parameter models enter the mix, traces explode in size and fused kernels can take minutes to hours to simulate.
Also, extrapolation works really well for profiling. A lot of what a transformer does is repetitive execution of a small number of layers. It makes perfect sense to take these per-request timings and extrapolate them to larger contexts, multiple users, and various KV-cache hit rates. Most of the non-linearities in the system came from kernel launch overhead and host process overhead from profiling. Running a baseline profile separate from our Cascade profiler helped overcome and align these host non-linearities.
Amani
Trace-based simulation means you don't need the actual hardware to research LLM inference. You record what the workload does once and replay it on a "digital twin" of the chip, which helps get around GPU cost, regional availability, and safety in one go. Chip design research does this by matching every instruction in a trace to a simulated model of the hardware.
TPUs show how much hardware choice is a design decision rather than just getting a super fast GPU:
- Systolic arrays do the matrix math
- Caches are skipped because the XLA compiler plans every memory access ahead of time
- OCS lets slices be wired into whatever torus shape fits the parallelism
What's Next for Cascade
- [ ] Larger models. Support efficient simulation on larger model sizes; our current experiments benchmark models with fewer than a billion parameters.
- [ ] Long-horizon simulation. Cascade mainly operates at the per-request level today. We'd like to extend it to simulate work across requests and across user sessions with different KV-cache states.
- [ ] Richer execution model. Our execution model is limited, lacking CUDA graph capture. We want to support kernel fusion for LLM inference workloads.
- [ ] Scale-out strategies. Run GPUs in parallel on an RDMA-connected cluster.
- [ ] More hardware. While we support various NVIDIA GPU architectures, we'd love to support other simulators for AMD ROCm and Google TPUs.
- [ ] Prefill-decode disaggregation. An ambitious goal: support disaggregation between the same GPU, and possibly between different GPUs, as companies approach heterogeneous physical integrations.
References
Papers and resources that were helpful in our exploration of trace-based simulators:
Ko, H. (n.d.). TPU Deep Dive. https://henryhmko.github.io/posts/tpu/tpu.html
Lowe-Power, J., Ahmad, A. M., Akram, A., Alian, M., Amslinger, R., Andreozzi, M., Armejach, A., Asmussen, N., Beckmann, B., Bharadwaj, S., Black, G., Bloom, G., Bruce, B. R., Carvalho, D. R., Castrillon, J., Chen, L., Derumigny, N., Diestelhorst, S., Elsasser, W., … Zulian, É. F. (2020). The gem5 Simulator: Version 20.0+ (arXiv:2007.03152). arXiv. https://doi.org/10.48550/arXiv.2007.03152
Pal, S., Liu, J., Alam, I., Cebry, N., Suhail, H., Bu, S., Iyer, S. S., Pamarti, S., Kumar, R., & Gupta, P. (2021). Designing a 2048-Chiplet, 14336-Core Waferscale Processor. 2021 58th ACM/IEEE Design Automation Conference (DAC), 1183–1188. https://doi.org/10.1109/DAC18074.2021.9586194
Pal, S., Petrisko, D., Tomei, M., Gupta, P., Iyer, S. S., & Kumar, R. (2019). Architecting Waferscale Processors—A GPU Case Study. 2019 IEEE International Symposium on High Performance Computer Architecture (HPCA), 250–263. https://doi.org/10.1109/HPCA.2019.00042
Pan, J., An, W., Baddouh, C. A., Bose, C. D., Kang, N., Barnes, A., Alawneh, A., Shen, F., Liu, Y., Nallathambi, A., Chandrashekar, A., & Rogers, T. G. (2026). Architecting the Next Generation of Asynchronous, Distributed GPUs for the AI Era (arXiv:2608.22602). arXiv. https://doi.org/10.48550/arXiv.2608.22602
Dang, J., Raj, R., Man, C., Tong, J., & Krishna, T. (2026). SCALE-Sim TPU: Validating and Extending SCALE-Sim for TPUs (arXiv:2603.22535). arXiv. https://doi.org/10.48550/arXiv.2603.22535
Built With
- gpu
- profiling
- sandboxes
- simulation

