-
-
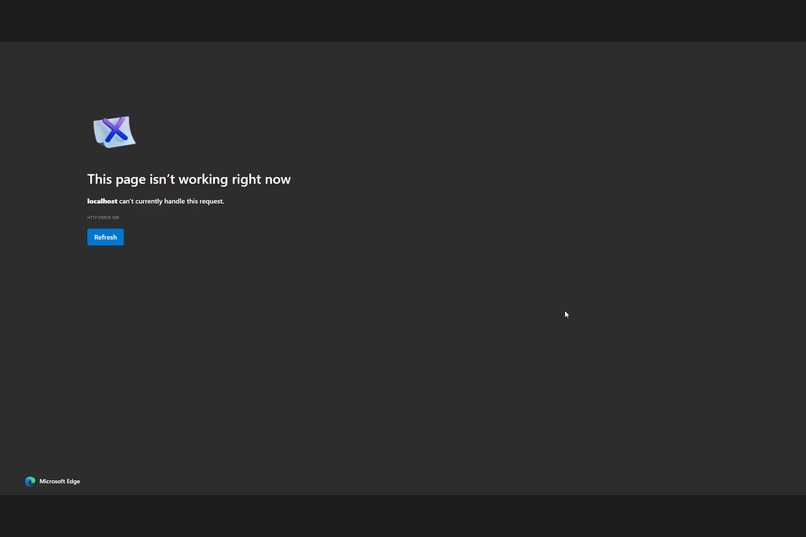
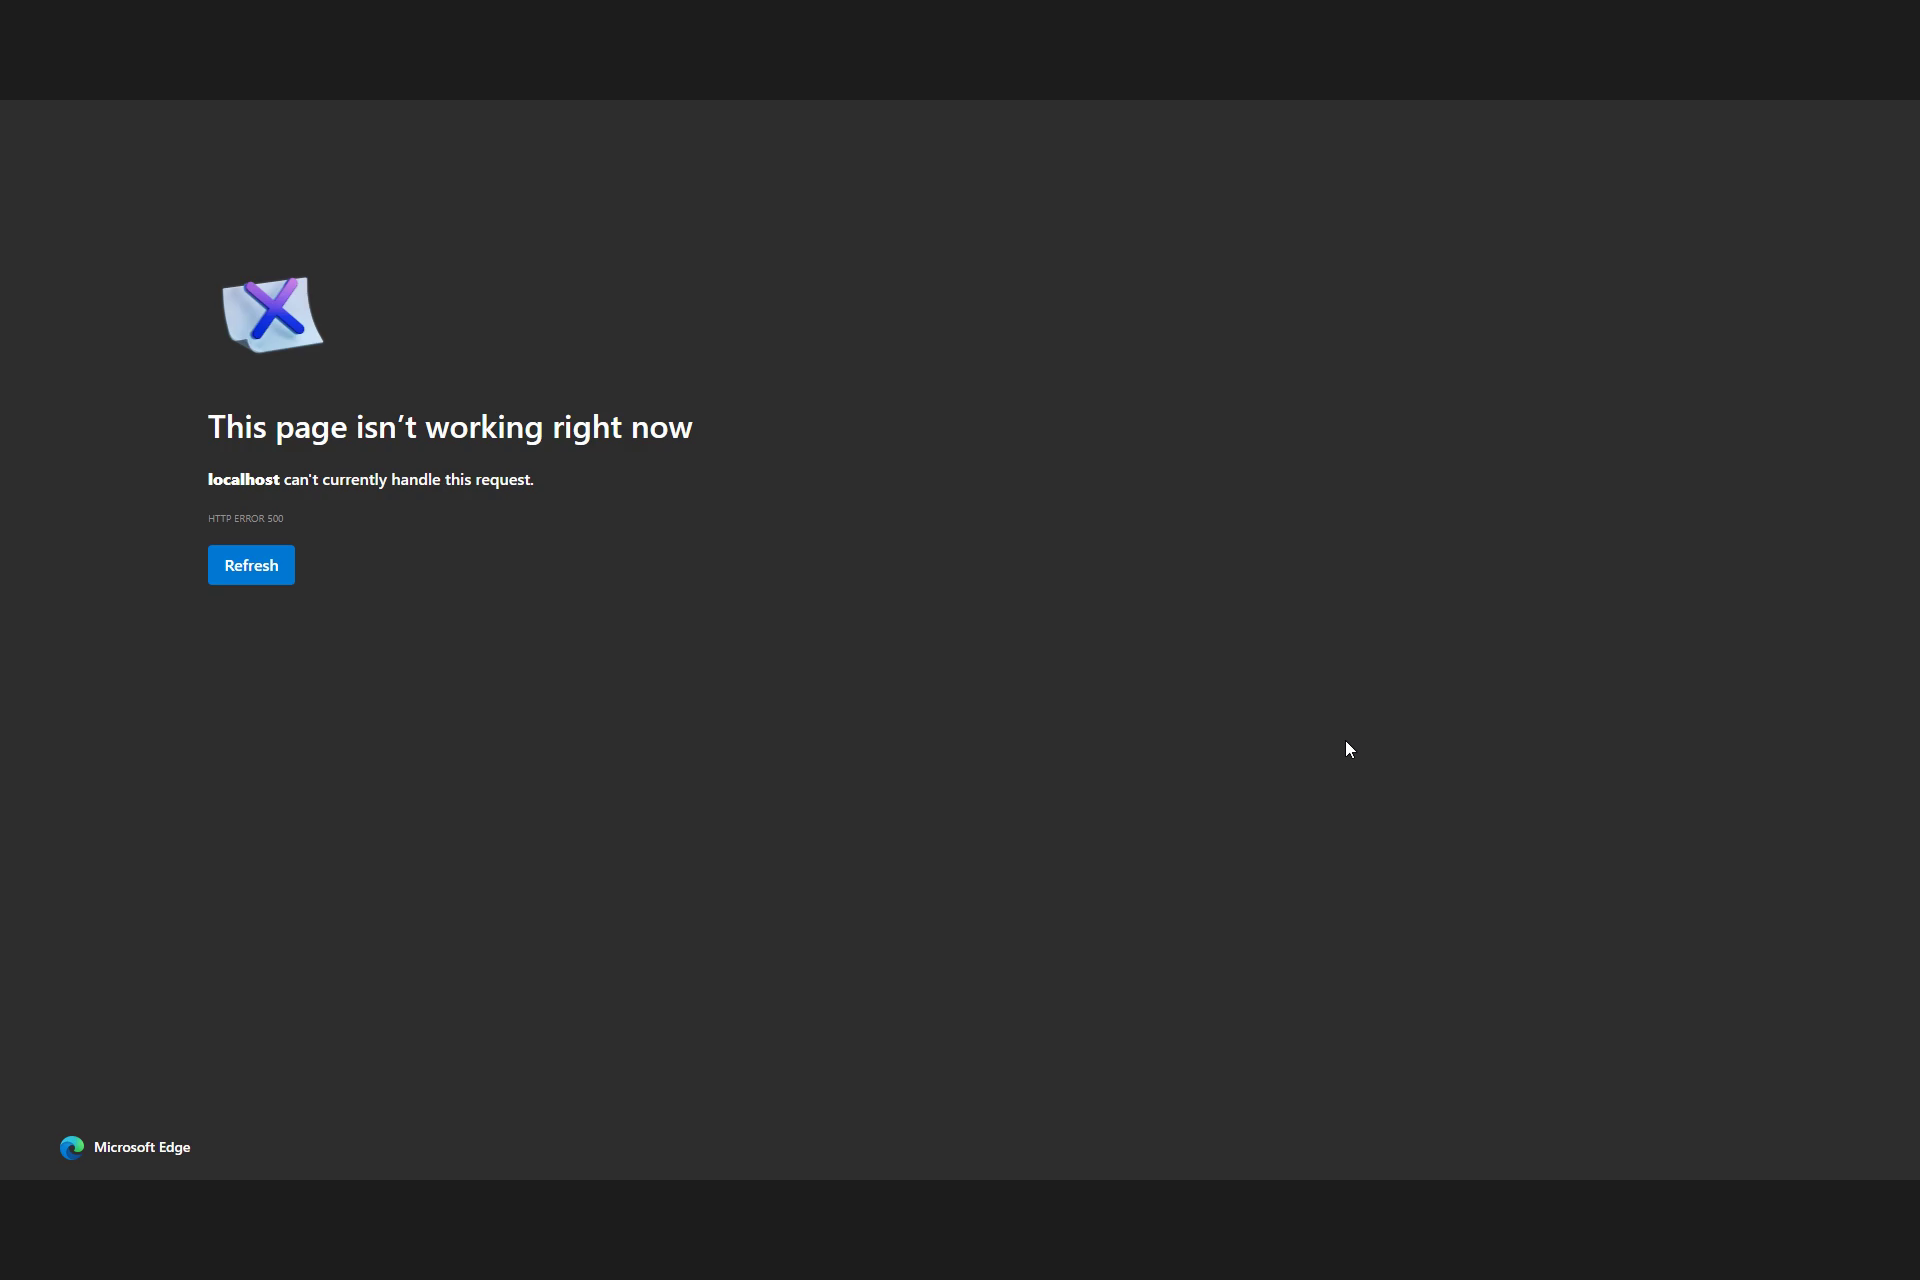
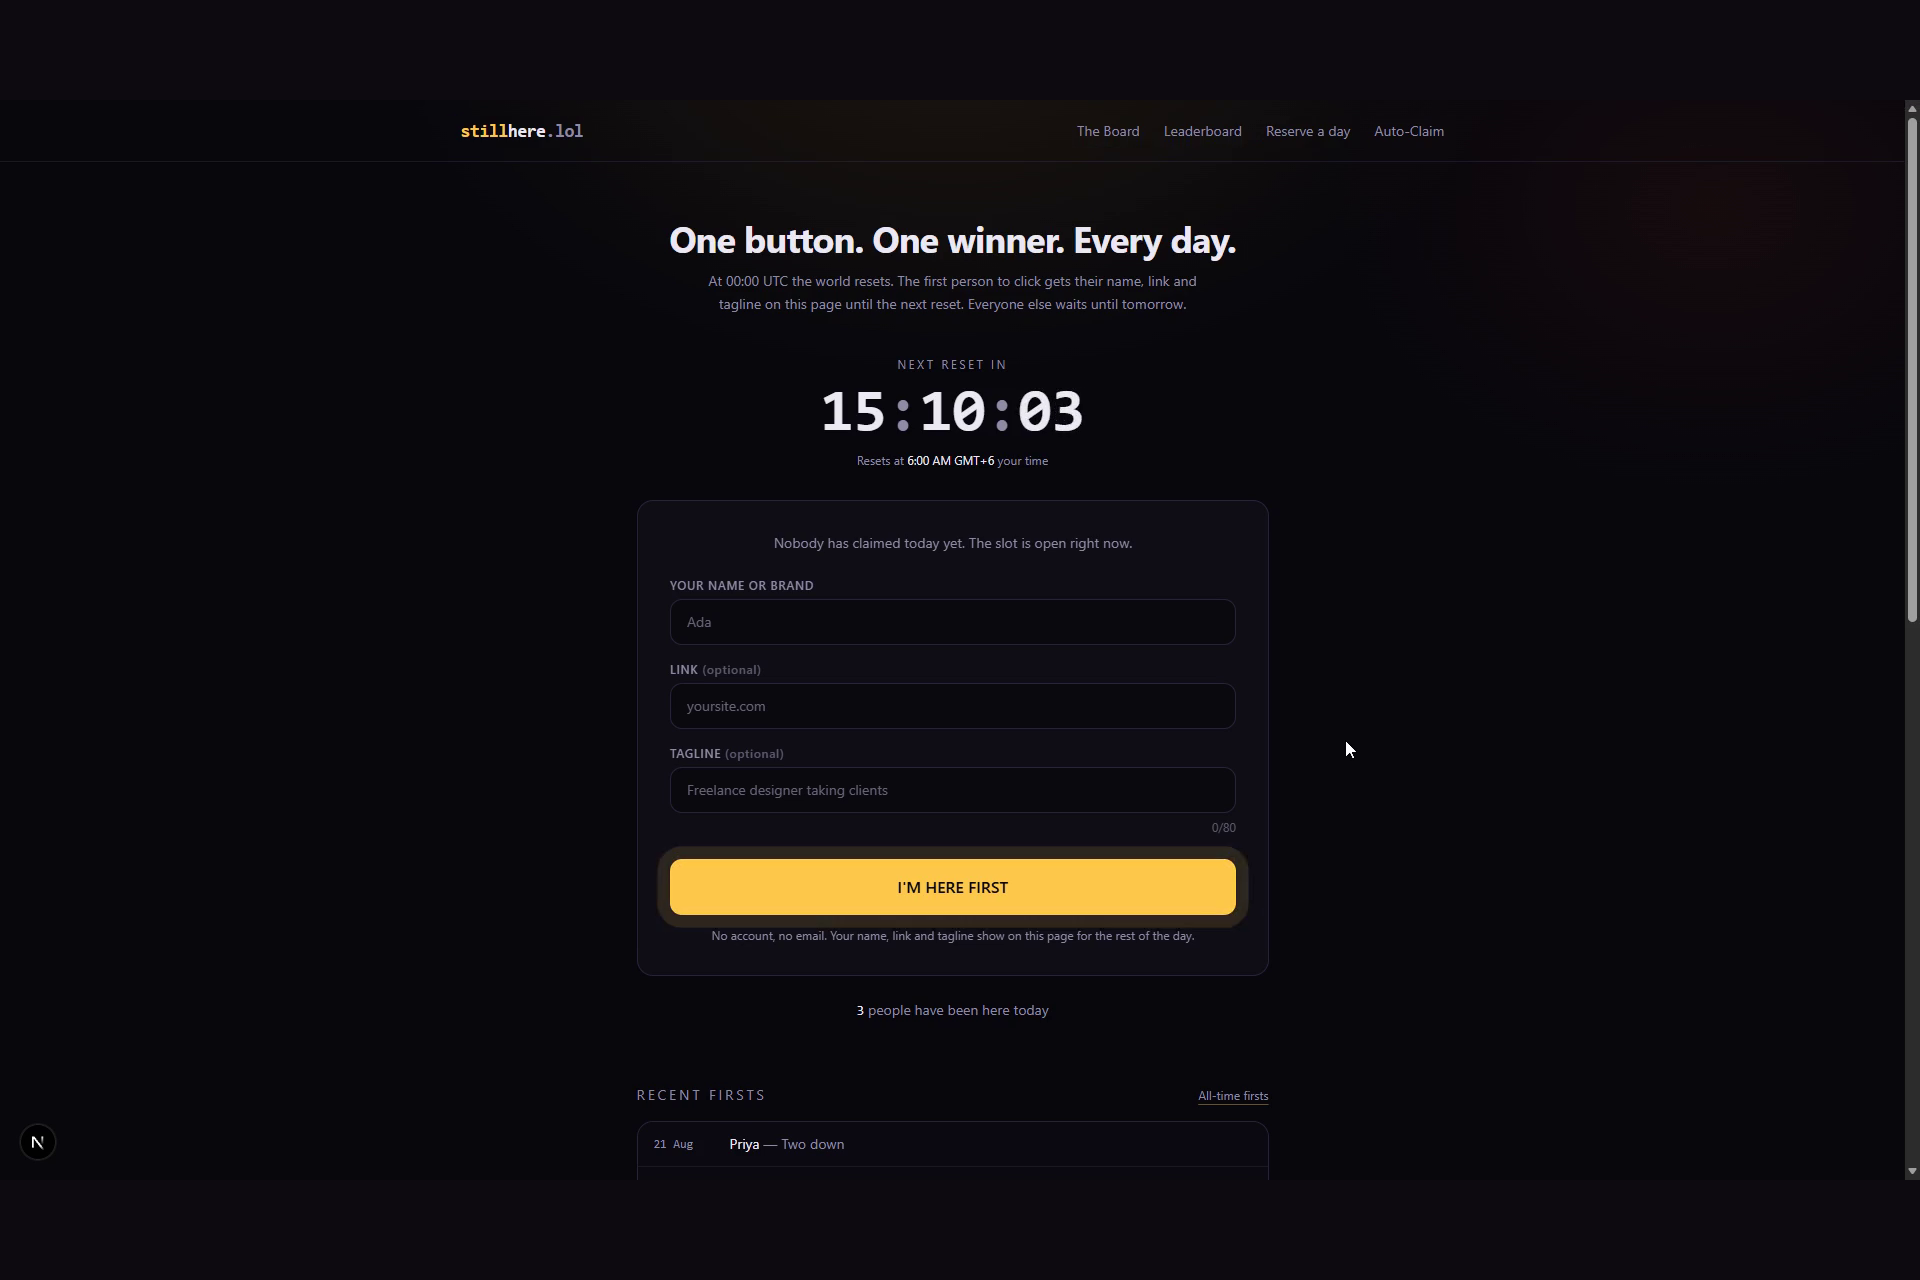
The app down after the database kill
-
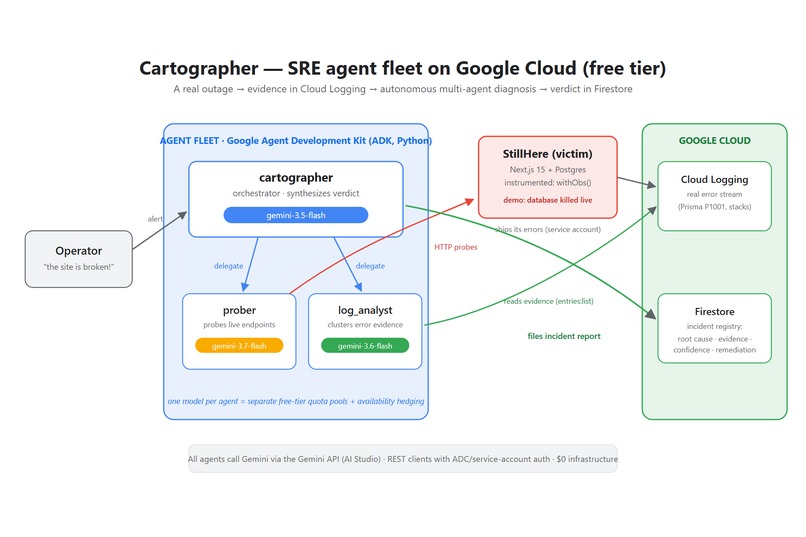
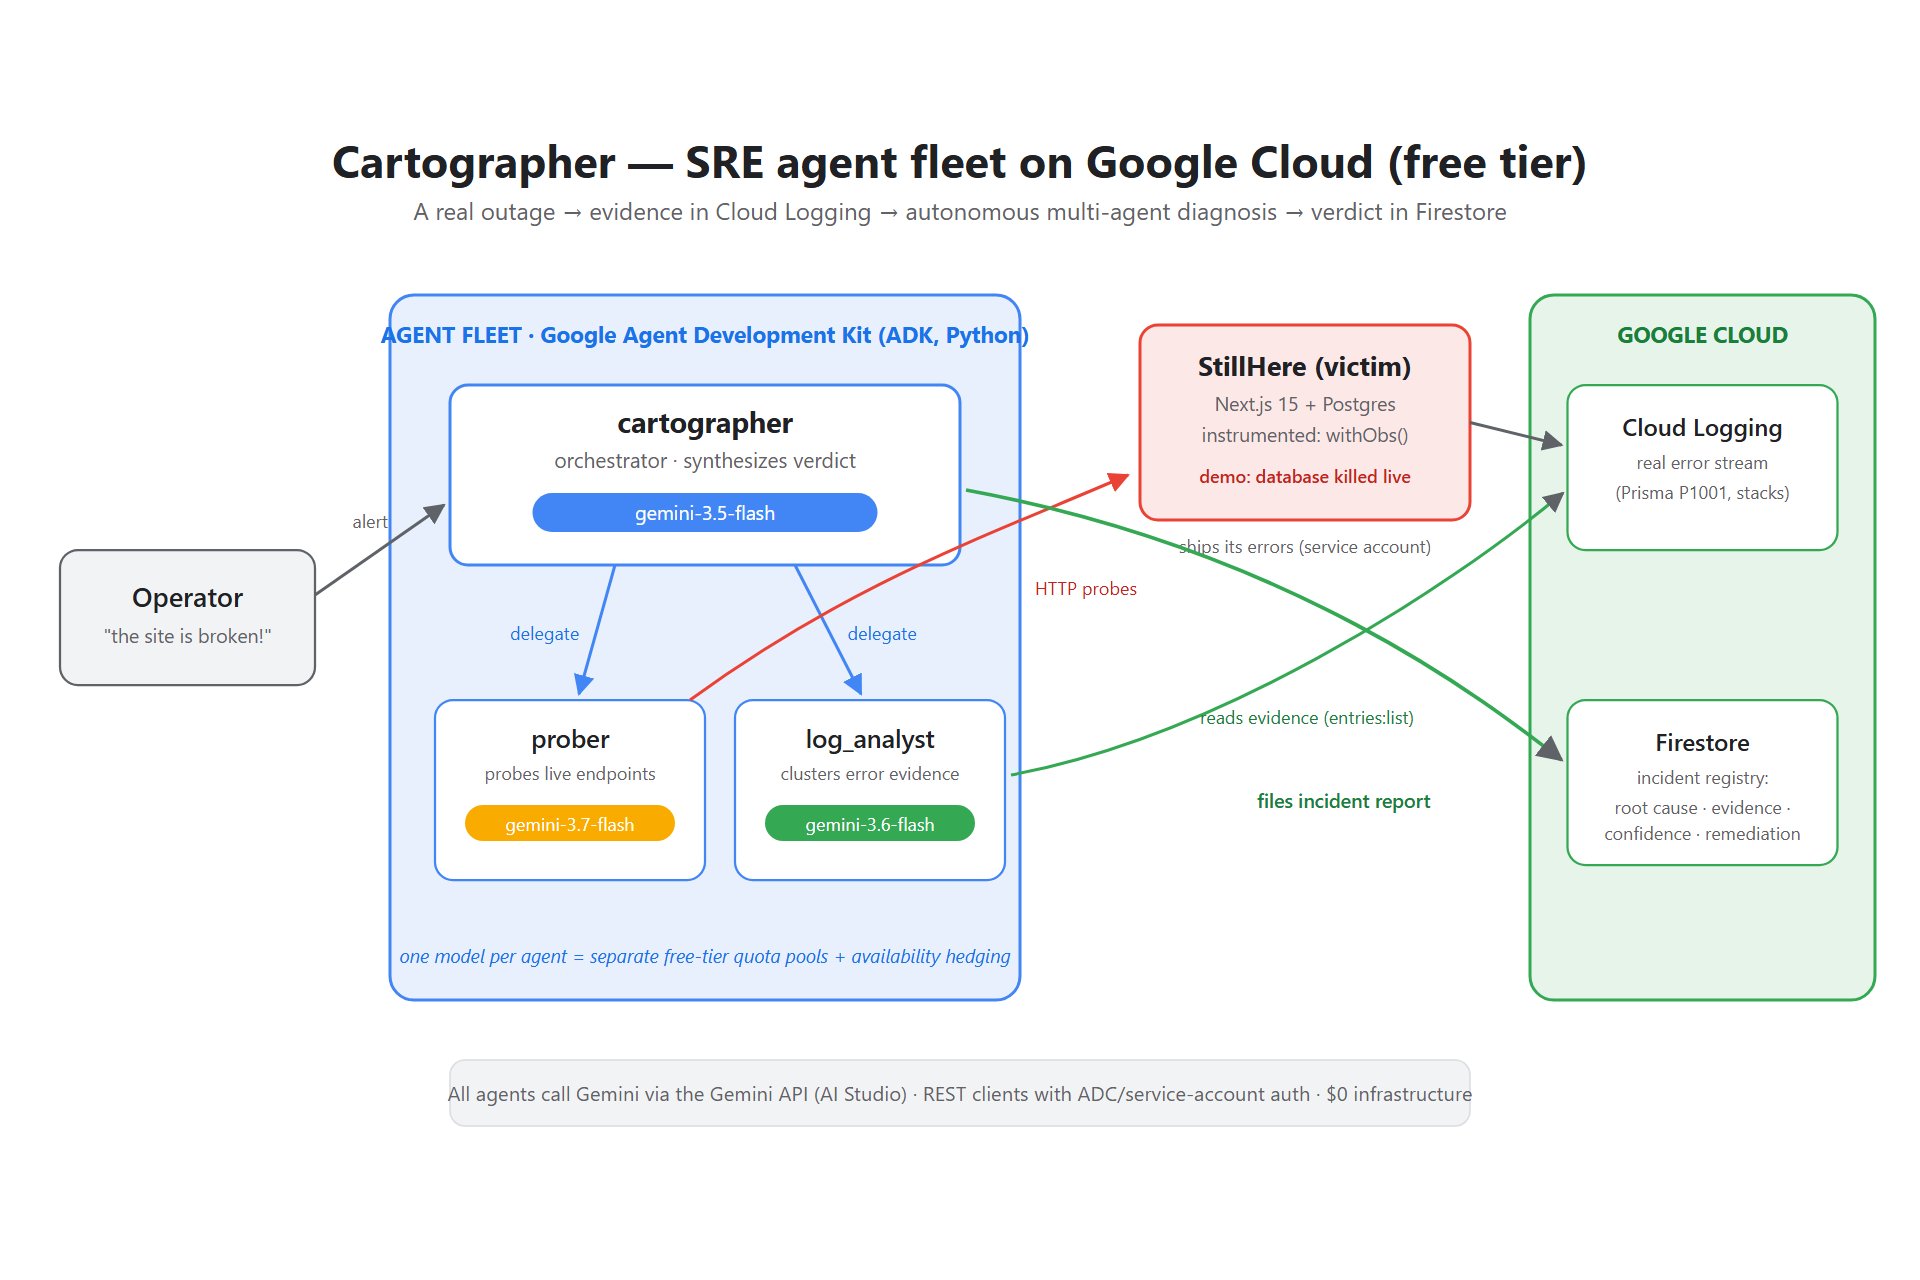
The system architecture diagram
-
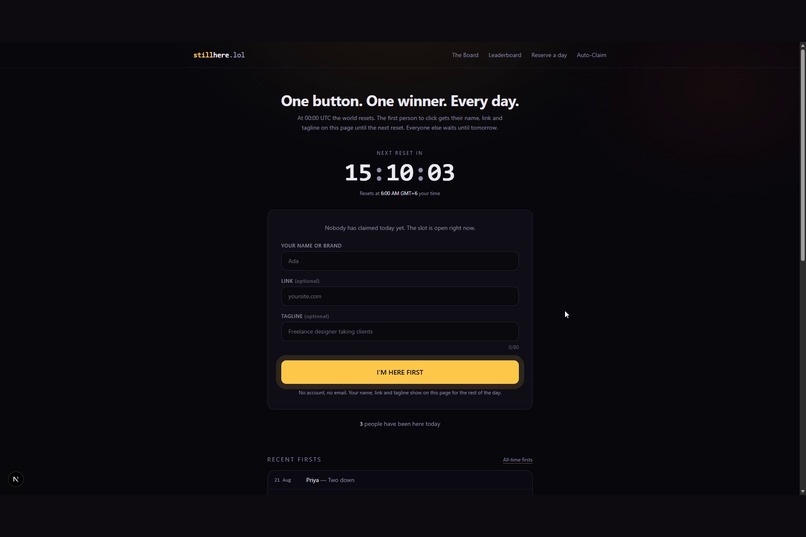
Restored after the agent's own remediation
-
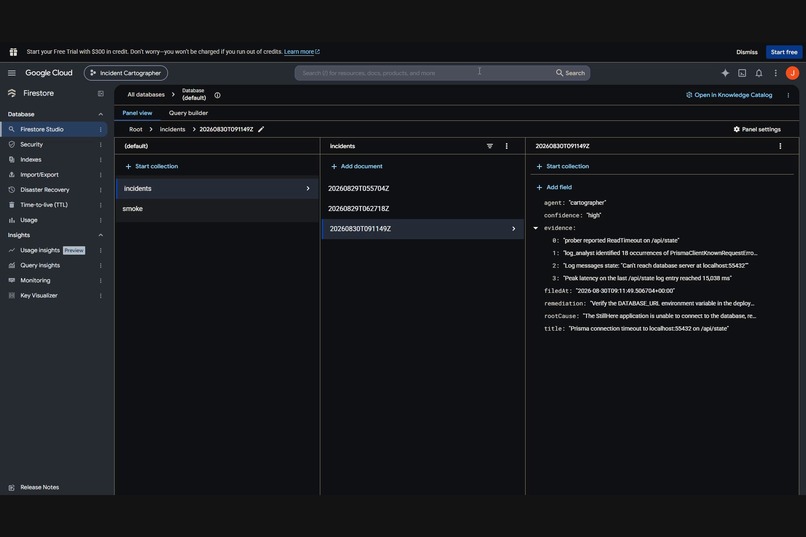
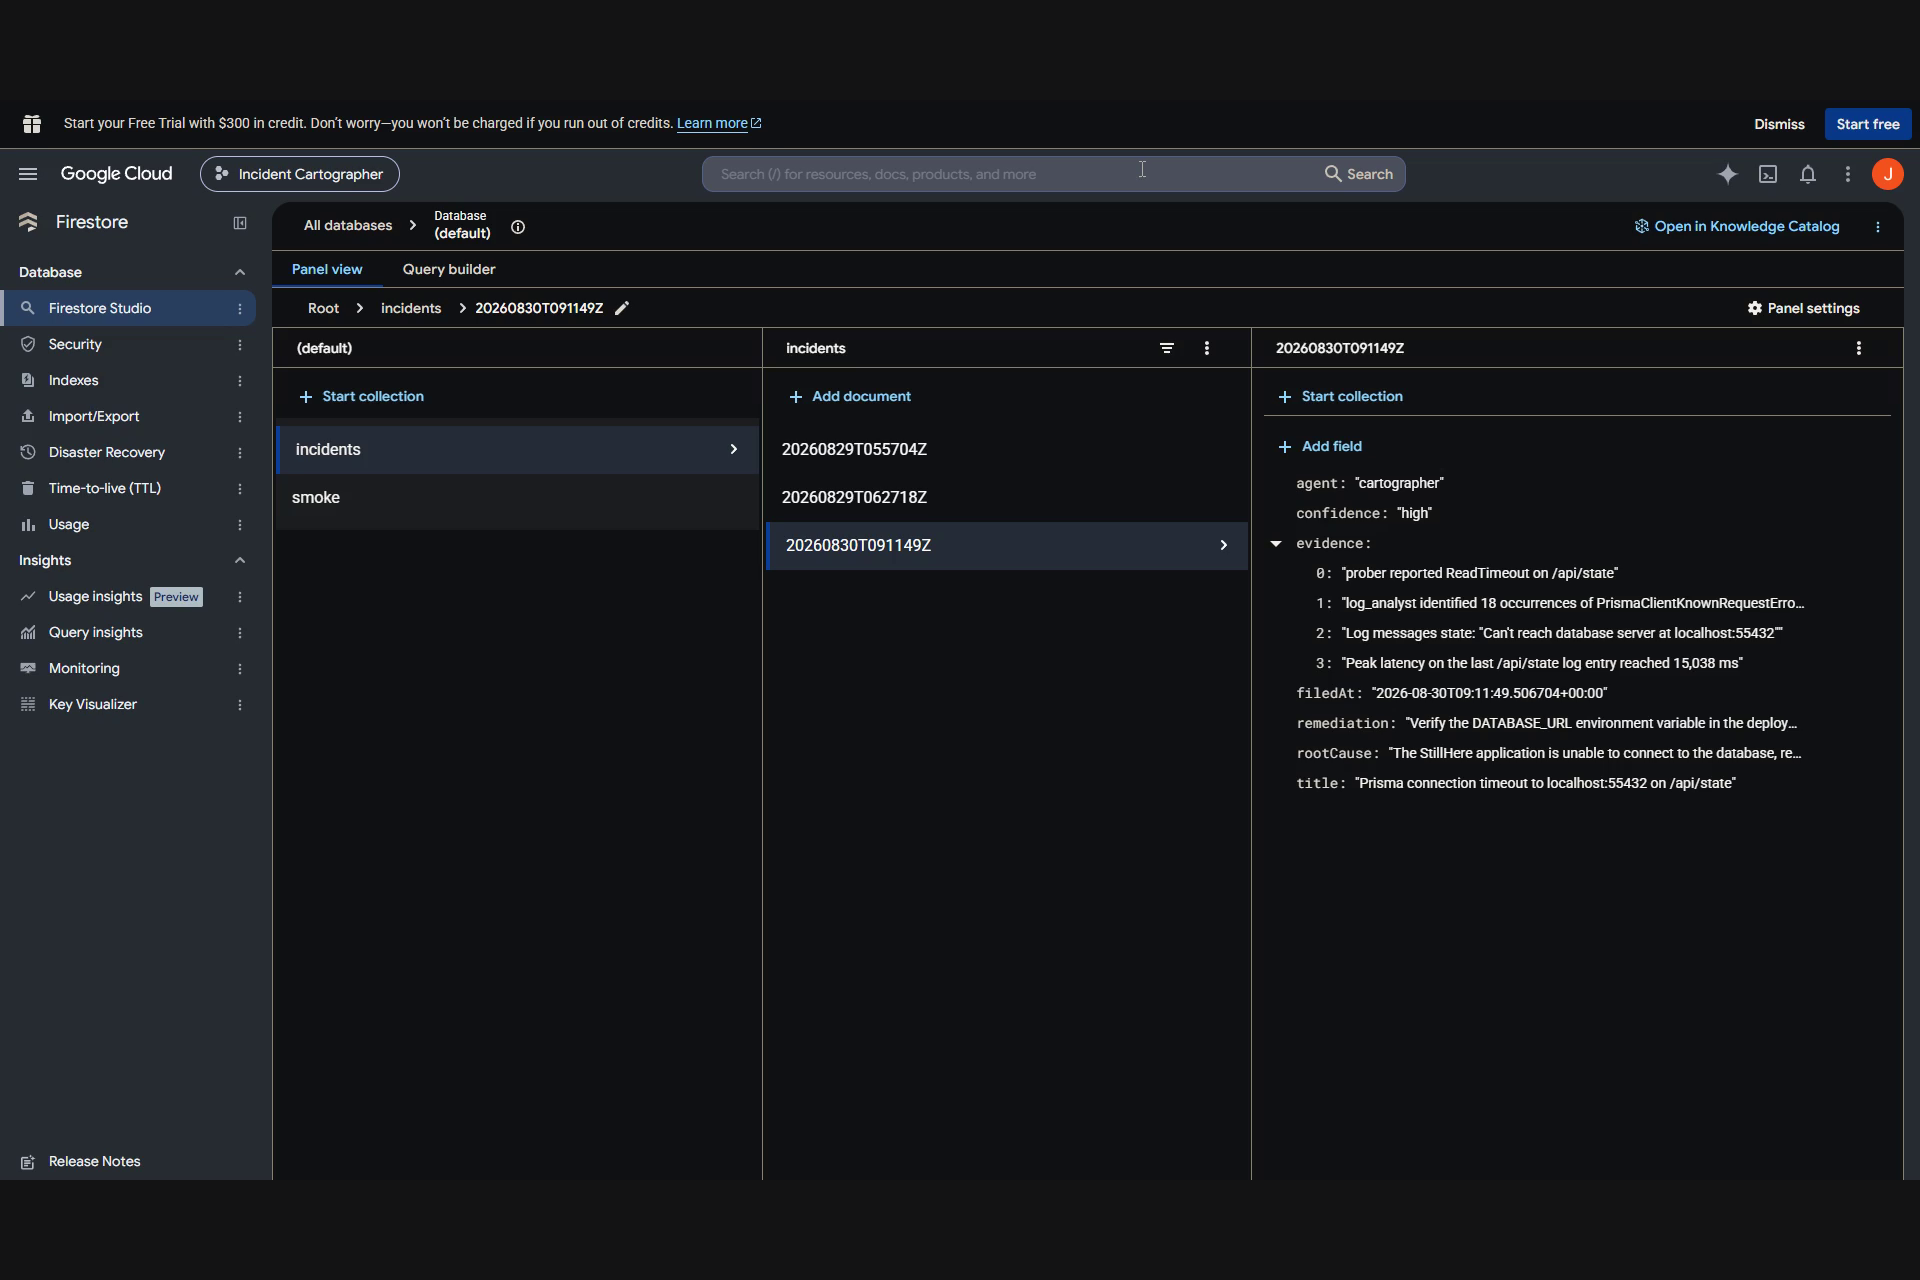
The filed incident report in Firestore
-
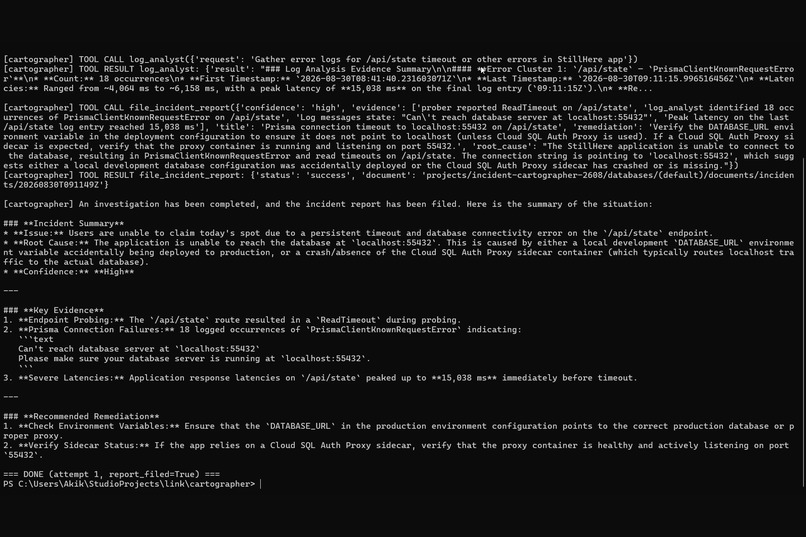
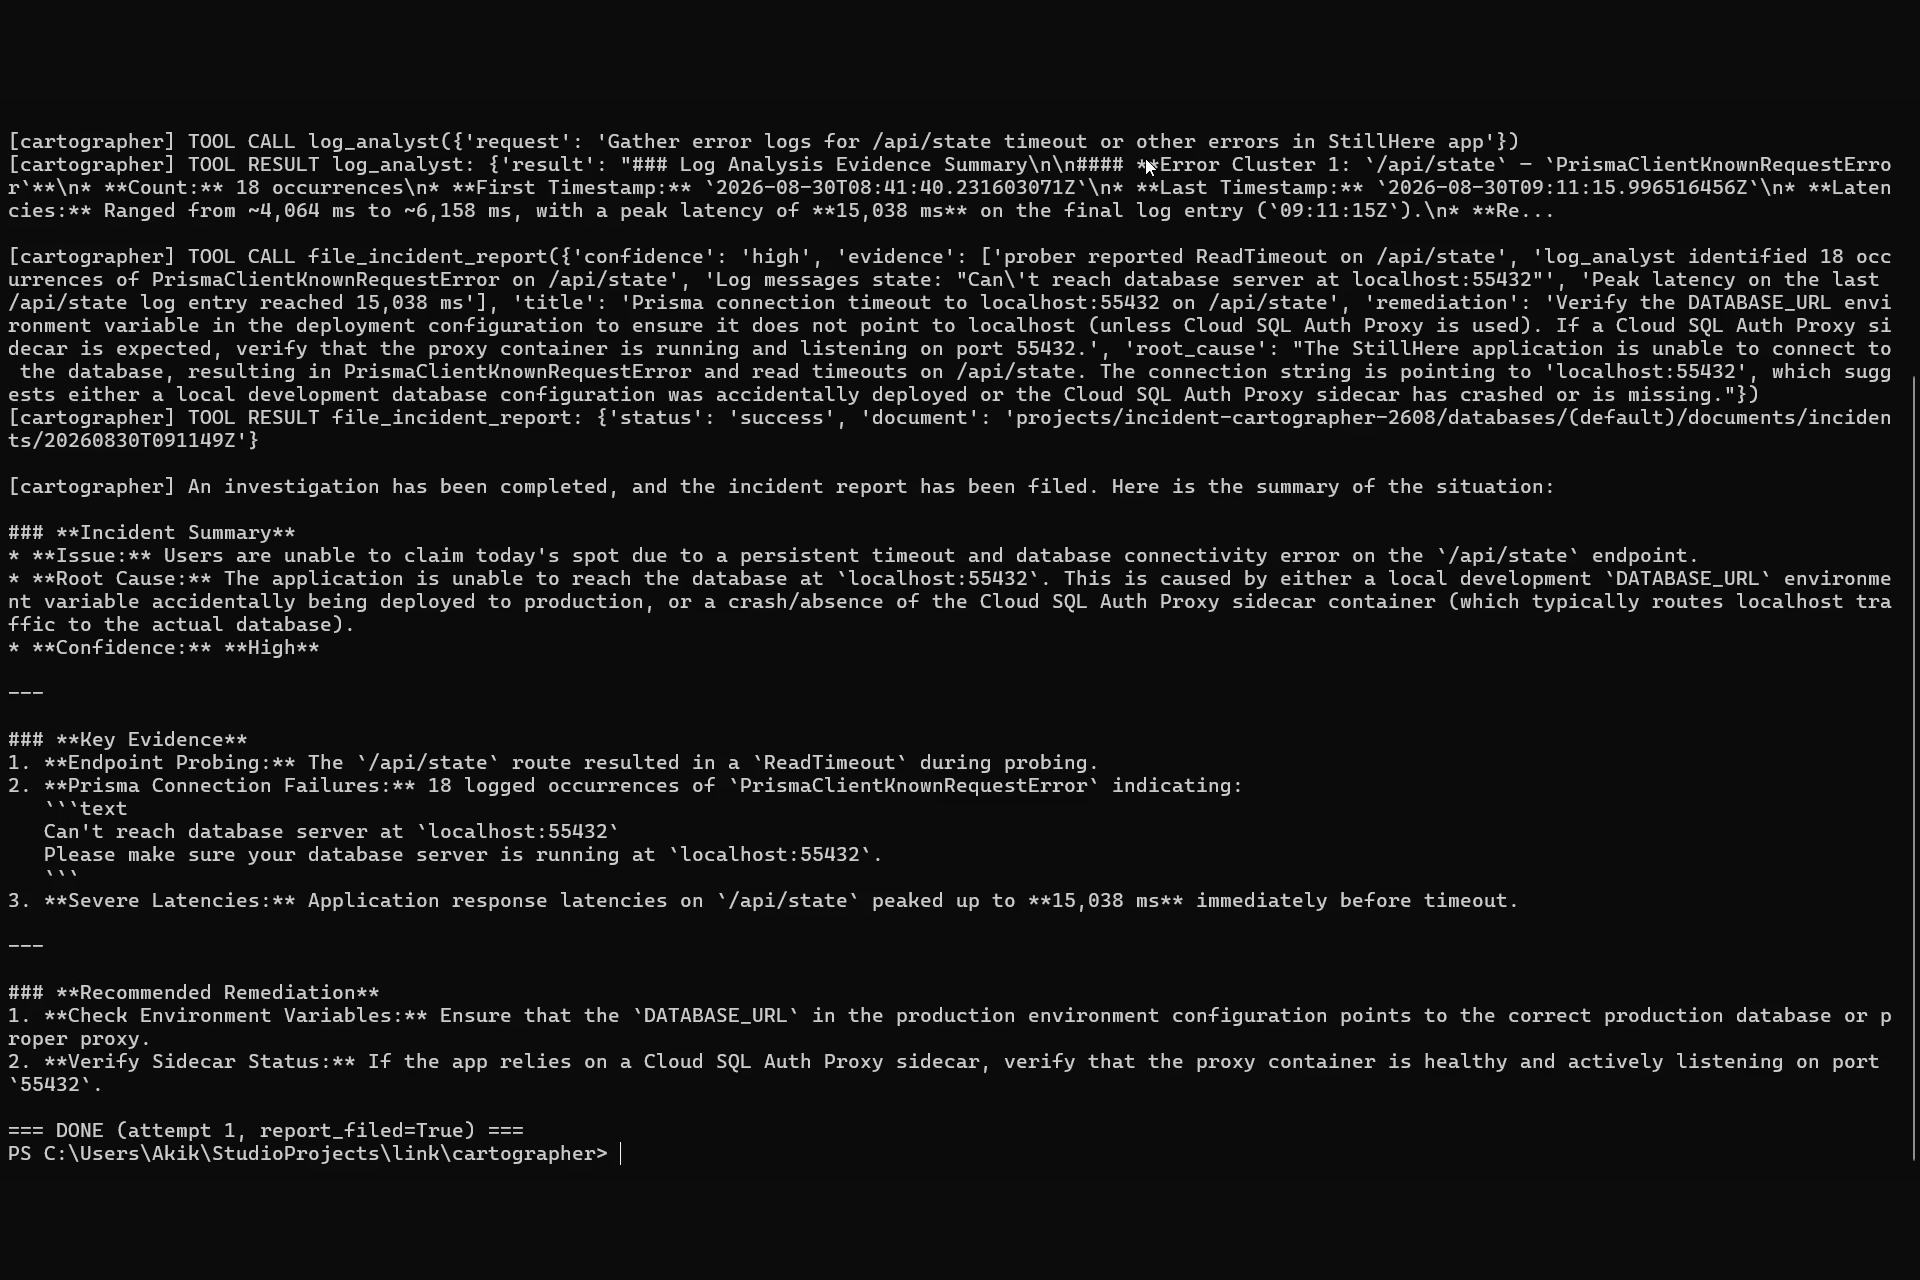
The fleet's investigation and verdict in the terminal
-
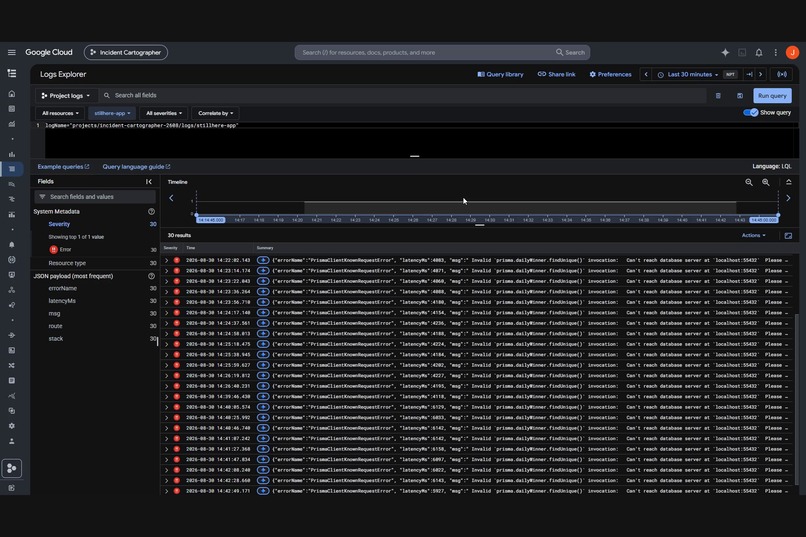
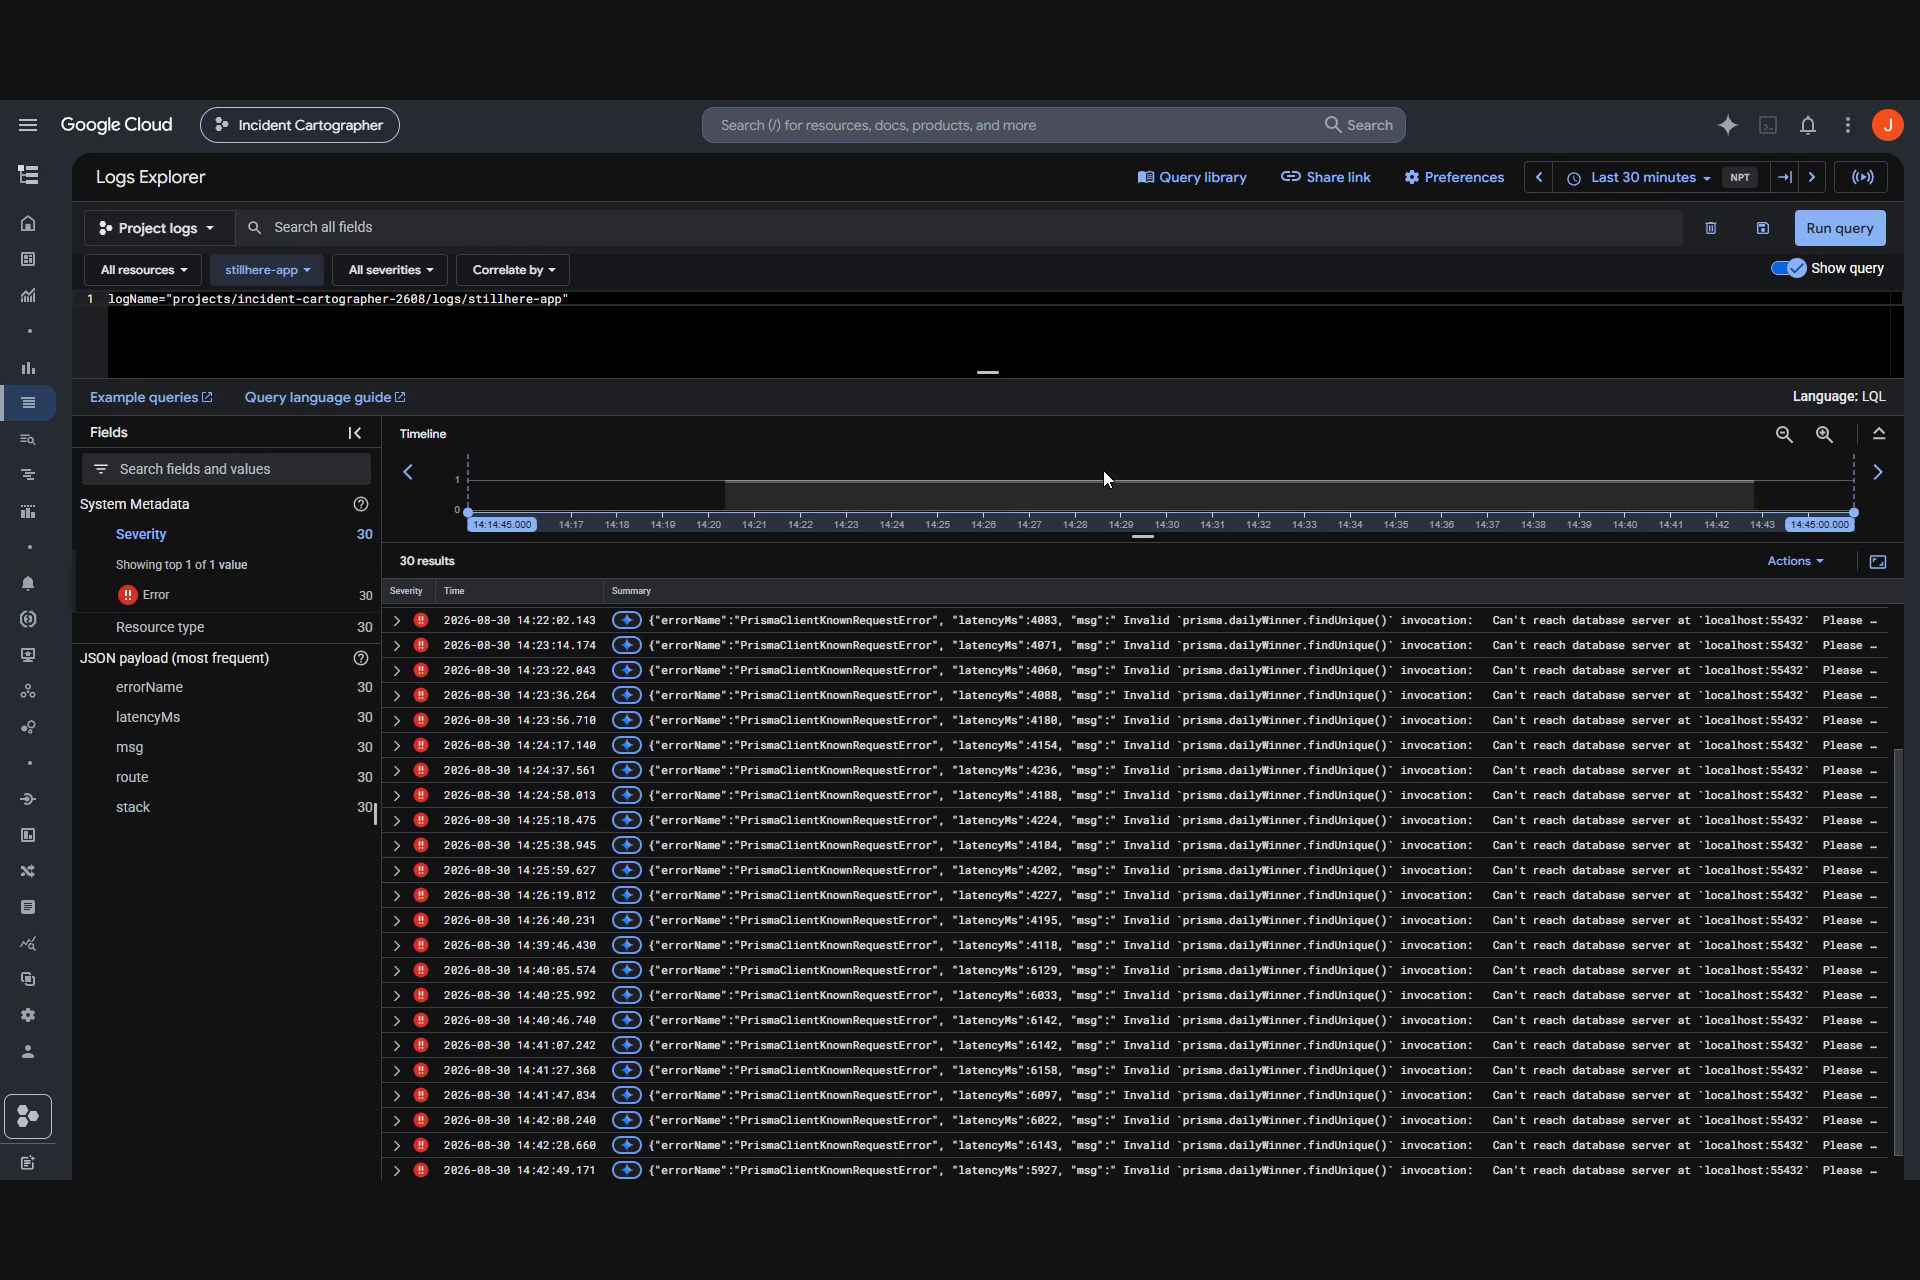
30 real errors in the Cloud Logging console
Inspiration
Every on-call engineer knows the 3 a.m. ritual. An alert fires, the site is down, and the one line that explains everything is buried under a thousand log entries. The loop you run — probe the endpoints, read the logs, correlate, form a hypothesis, test it — is mechanical, evidence-driven, and multi-step. That is exactly the shape of work an agent should own. So I gave it to one.
What it does
Cartographer is a three-agent fleet that investigates real incidents in a live web application and files a written diagnosis, with no human in the loop.
- An orchestrator (
gemini-3.5-flash) receives the incident and delegates. - A prober (
gemini-3.7-flash) hits the live endpoints and returns a symptom table — status codes, latencies, timeouts. - A log analyst (
gemini-3.6-flash) mines the application's error stream in Cloud Logging and returns clustered evidence — error types, counts, first/last timestamps. - The orchestrator correlates both, reasons to a root cause, and files a structured verdict to a Firestore incident registry: root cause, confidence, the specific evidence it cited, and a remediation an operator can execute immediately.
In the demo I kill the application's database live, on camera. Real Prisma connection errors flow into Cloud Logging — the app instruments itself and ships its own stack traces through a service account. The fleet then diagnoses it correctly and unaided: "Prisma connection timeout to localhost:55432 on /api/state", confidence high, citing 18 logged PrismaClientKnownRequestError occurrences and a peak latency of 15,038 ms. Then I run its prescribed fix and the site comes back.
How I built it
- Agent Development Kit (ADK 2.7, Python) — the orchestrator wraps both specialists as
AgentTools, so delegation is a tool call and the whole fleet is one composable agent. - Gemini API — three models, one per agent. This is deliberate model-tiering: narrow specialists carry the cheap, bounded subtasks while the orchestrator does synthesis. Under the free tier it has a second payoff — each model is a separate daily quota pool, so one investigation draws from three budgets instead of draining one, and it hedges availability when a single model degrades.
- Google Cloud — Cloud Logging is the evidence pipeline (a
withObsroute wrapper in the monitored app ships structured errors), and Firestore is the system of record for verdicts. Both are reached through thin REST clients with ADC/service-account auth, which behave identically on a laptop, in Cloud Shell, or on Cloud Run. - The monitored app is a real Next.js 15 + Postgres application, not a toy endpoint that returns 500 on demand. Its failure modes are genuine, which is why the diagnosis means something.
Challenges I ran into
I built this entirely on the Google Cloud free tier, with no billing account attached at any point — the hackathon's credit pool was exhausted before I could request it, and I had no card to fall back on. That constraint turned into the architecture:
- 20 flagship requests per day forced the multi-model fleet and a hard ≤6-tool-call budget per investigation, enforced in the agent instructions.
- Transient 503 load-shedding on free-tier models forced a retry harness that re-runs any investigation dying before it files its report. During the actual demo recording,
gemini-3.7-flashbegan shedding load — so I added a model-health preflight that probes every compliant model and reassigns any sick role before the run starts. That reassignment is visible in the demo video: the fleet detects the degraded model, reassigns the prober, and completes the investigation on the first attempt. - A gRPC client bug in the Firestore library (a
(default)database-id encoding failure) forced a switch to REST clients — which turned out cleaner and more portable anyway. - Cloud Logging ingestion lag of one to three minutes meant tools had to widen their own time windows rather than assume instant reads, and sort client-side after an
orderByserver error.
Accomplishments that I'm proud of
The demo cannot be faked. A genuinely killed database, genuine stack traces in Google Cloud, and a correct, high-confidence, autonomously filed diagnosis — reproducible from the README in about ten minutes. Free-tier limits did not make this a weaker project; they made it a more defensible one.
What I learned
Resource limits are a forcing function for good agent design. Budget every tool call. Tier your models to the difficulty of the subtask. Assume your dependencies will fail mid-run and design the retry path first. And make every claim traceable — the agents are instructed never to invent a log line or a status code, and to mark confidence low and say what telemetry is missing when the evidence is thin. An agent that says "I don't have enough evidence" is worth more than one that guesses confidently.
What's next for Cartographer
adk deploy cloud_run — the agent and the monitored app are already containerized and need only a billed project. Then a deploy_historian specialist that correlates incidents with recent releases, and Pub/Sub-triggered investigations so production alerts page the agent instead of a human.
Built With
- cloud-logging
- firestore
- gemini
- gemini-api
- generative-ai
- google-adk
- google-cloud
- multi-agent
- next.js
- node.js
- postgresql
- prisma
- python
- react
- rest-api
- typescript

Log in or sign up for Devpost to join the conversation.