-

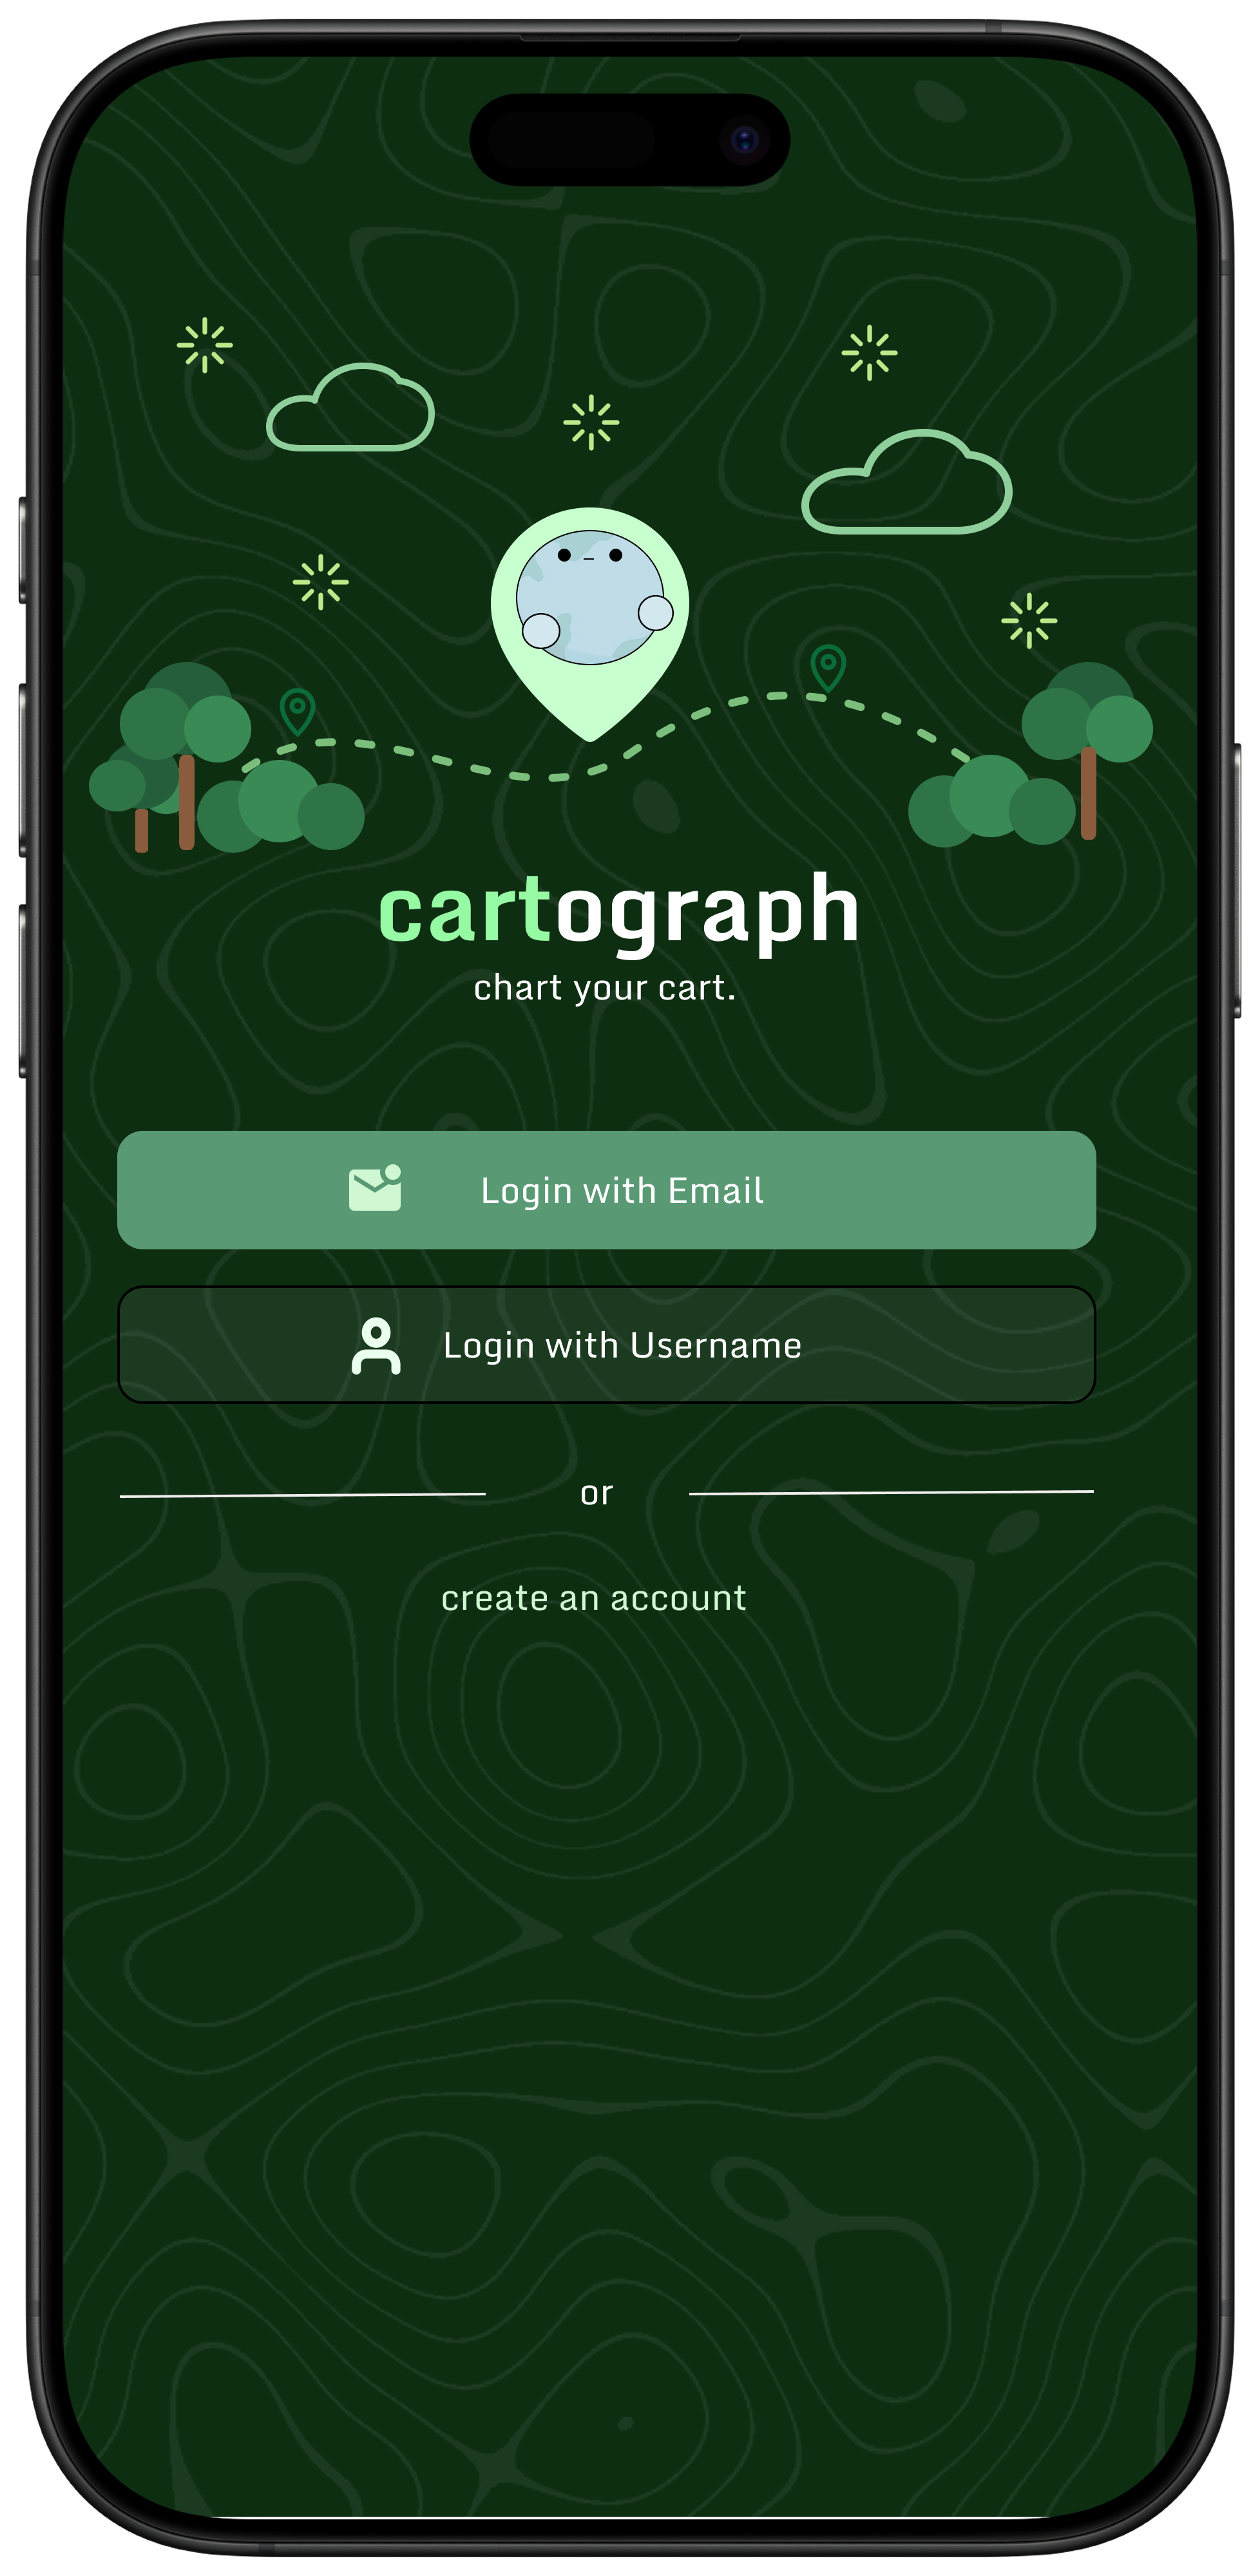
app logo with carter (our mascot) - please click our images for a better view
-
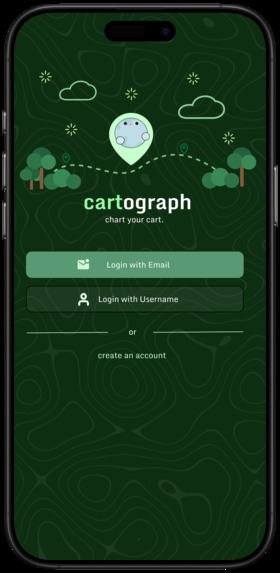
logging-in screen
-
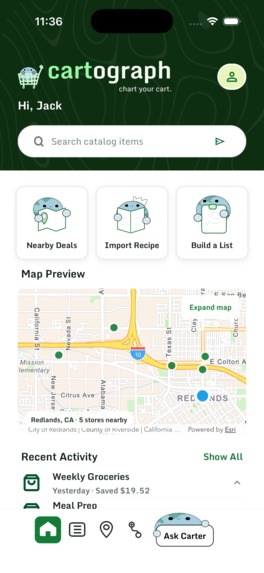
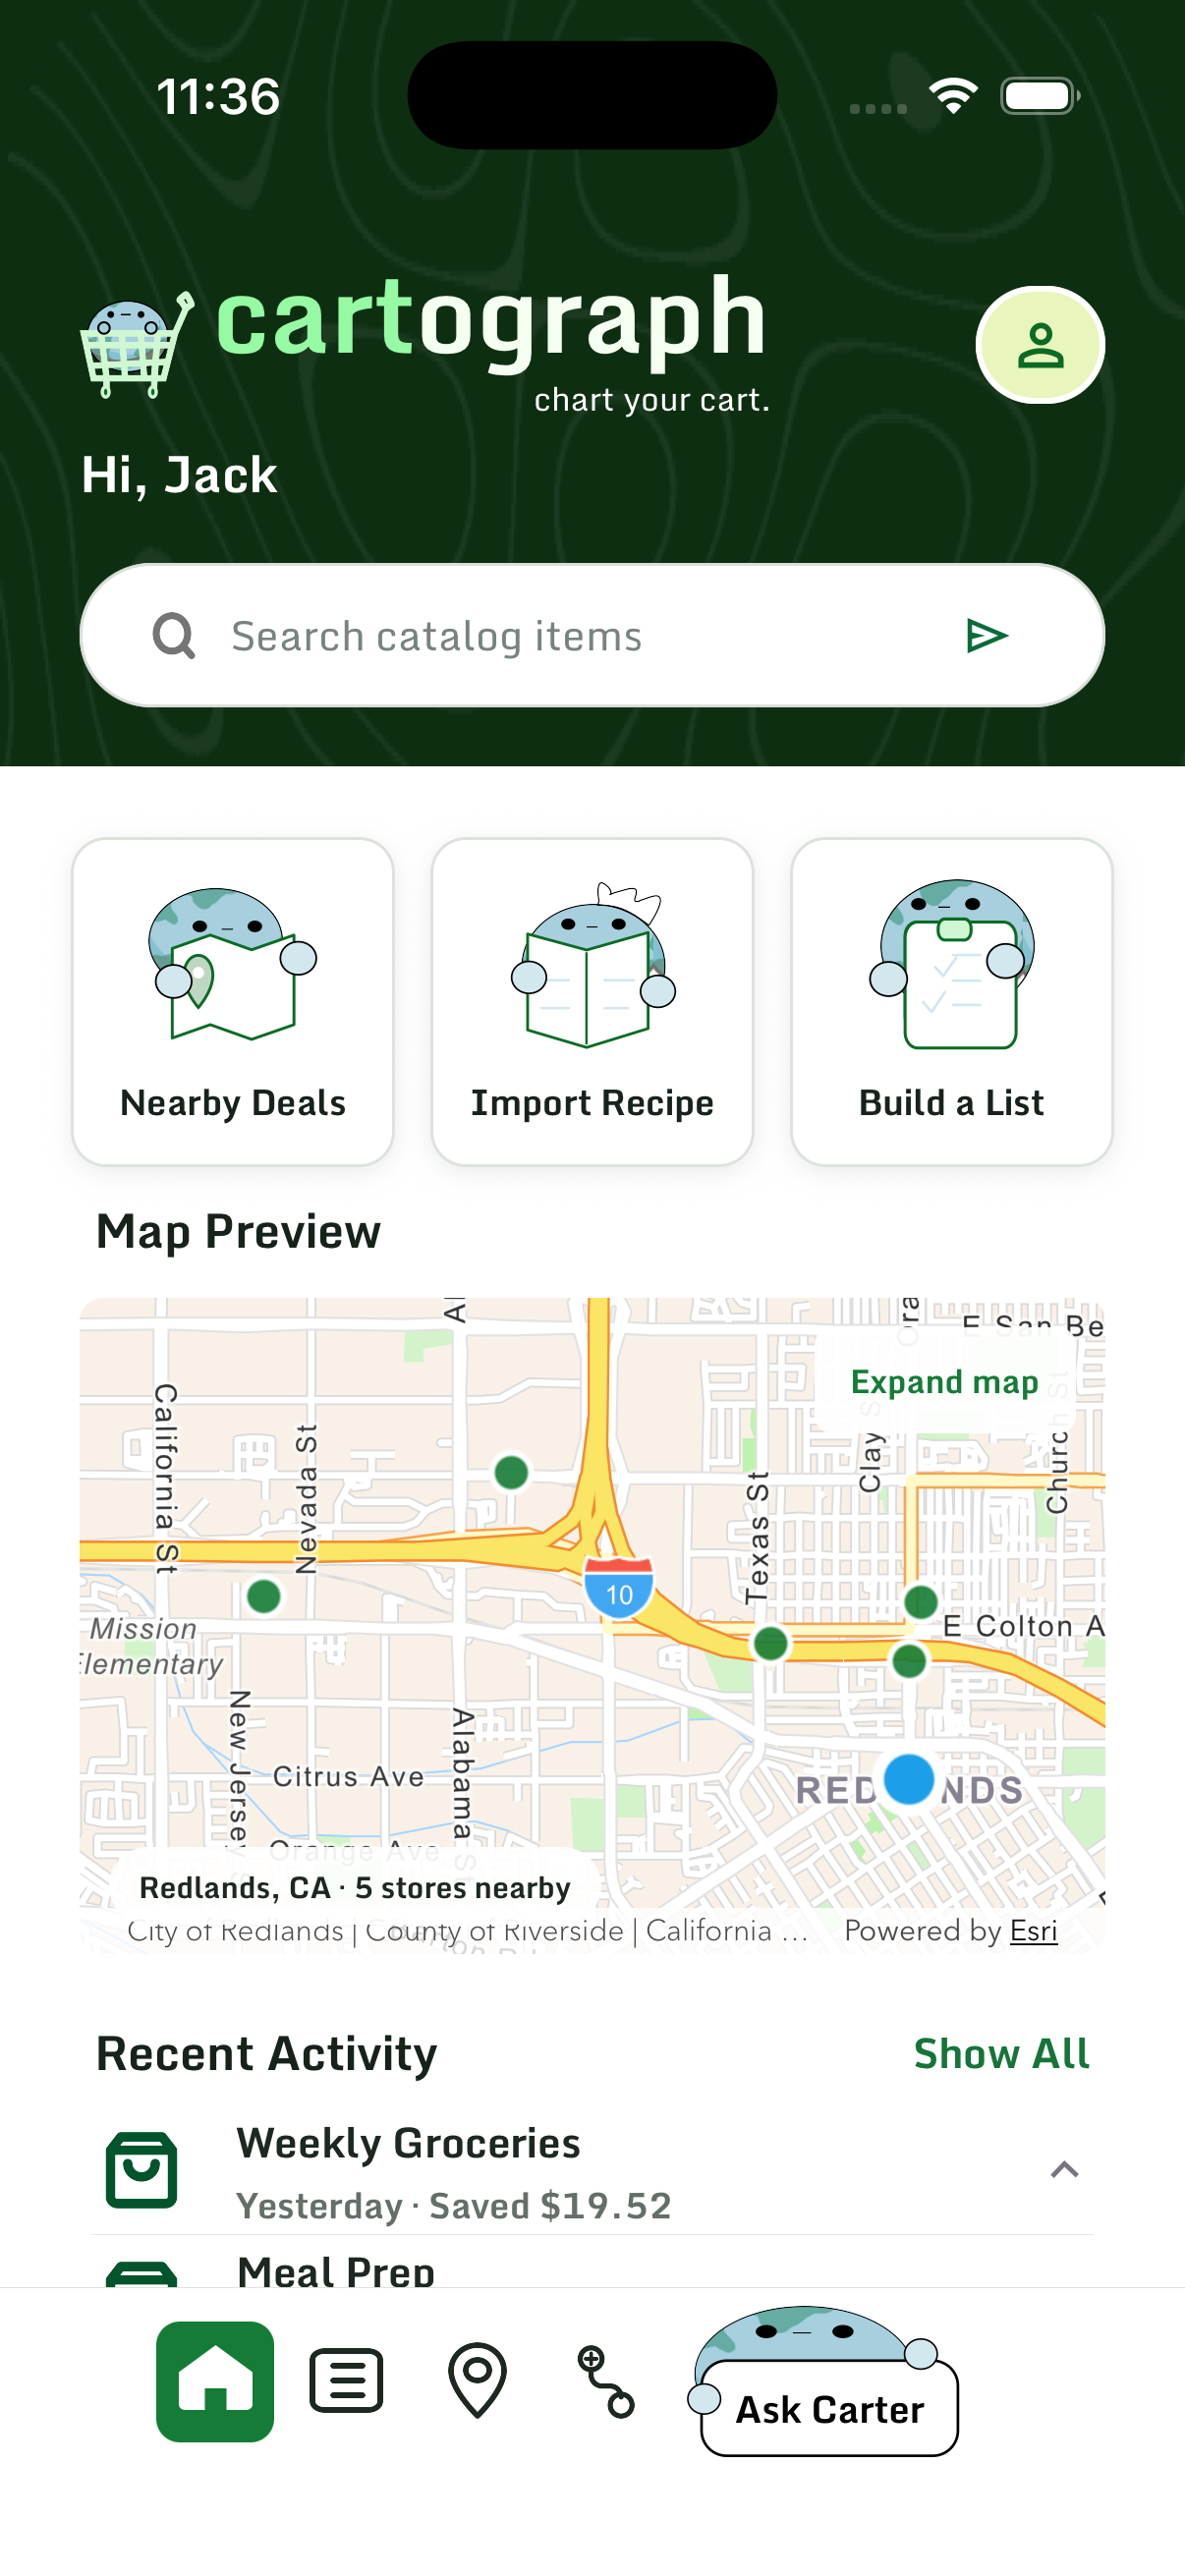
home screen - ios app
-
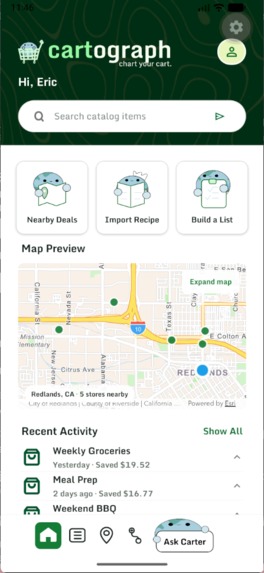
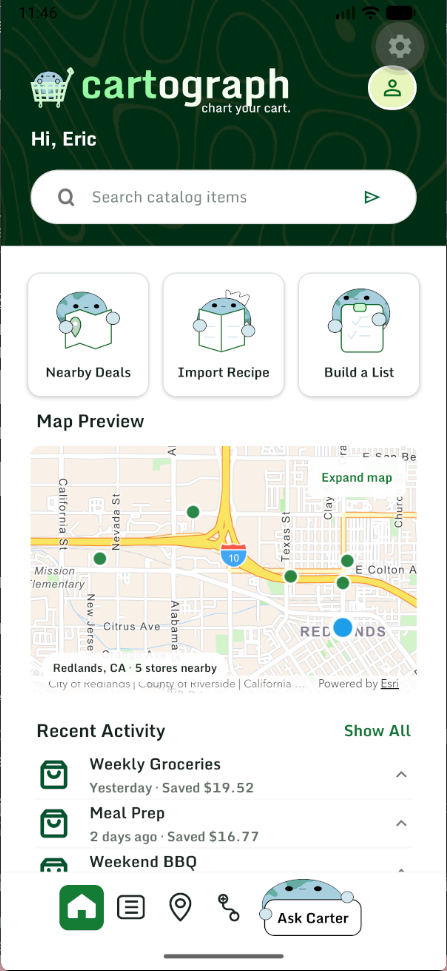
home screen - android
-
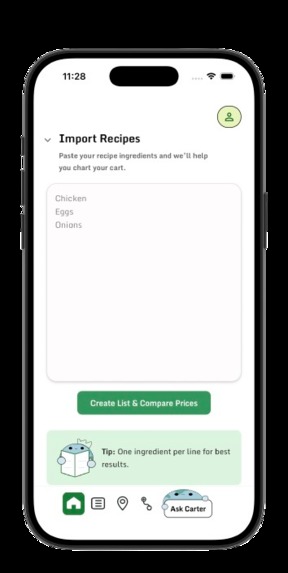
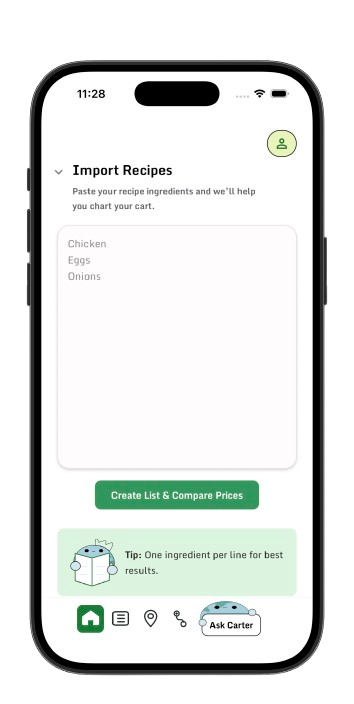
import a recipe screen
-
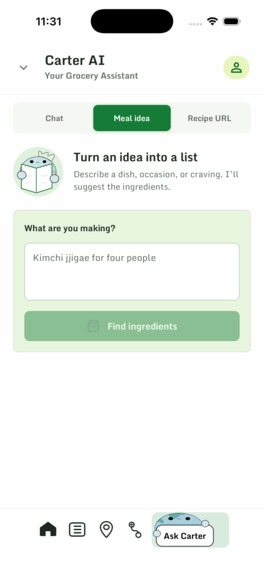
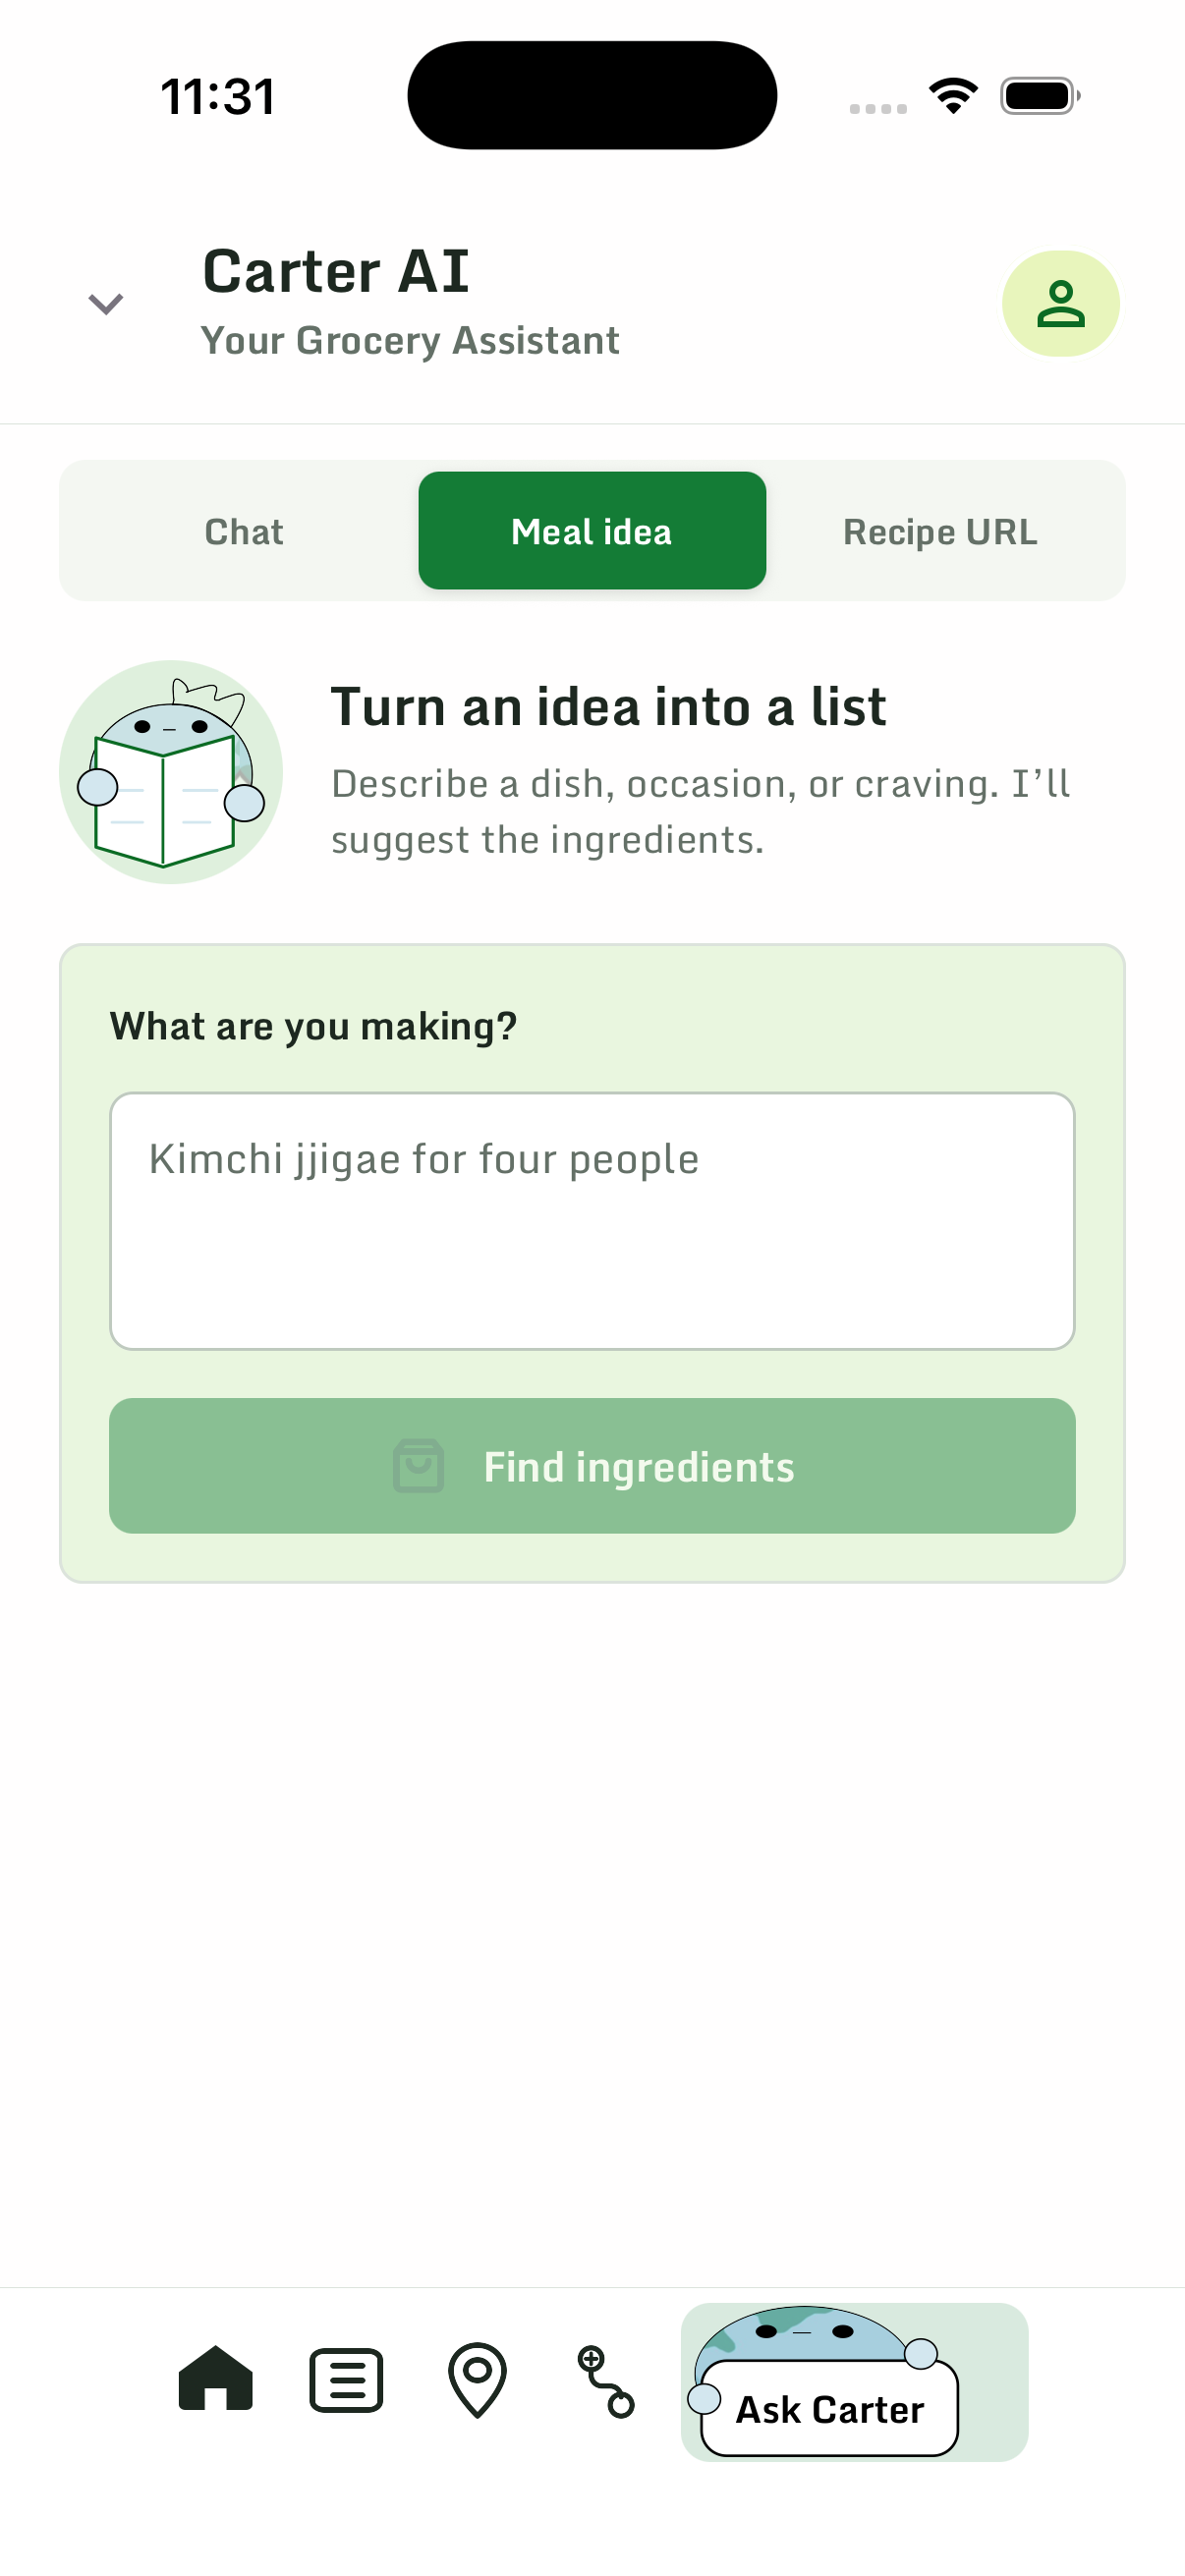
our mascot's chatbot!
-
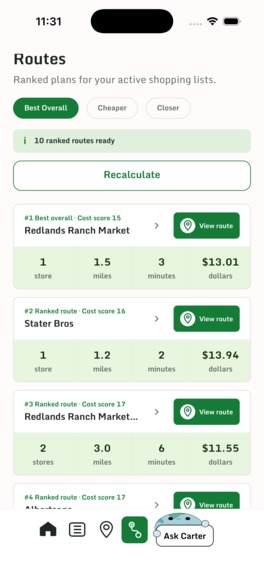
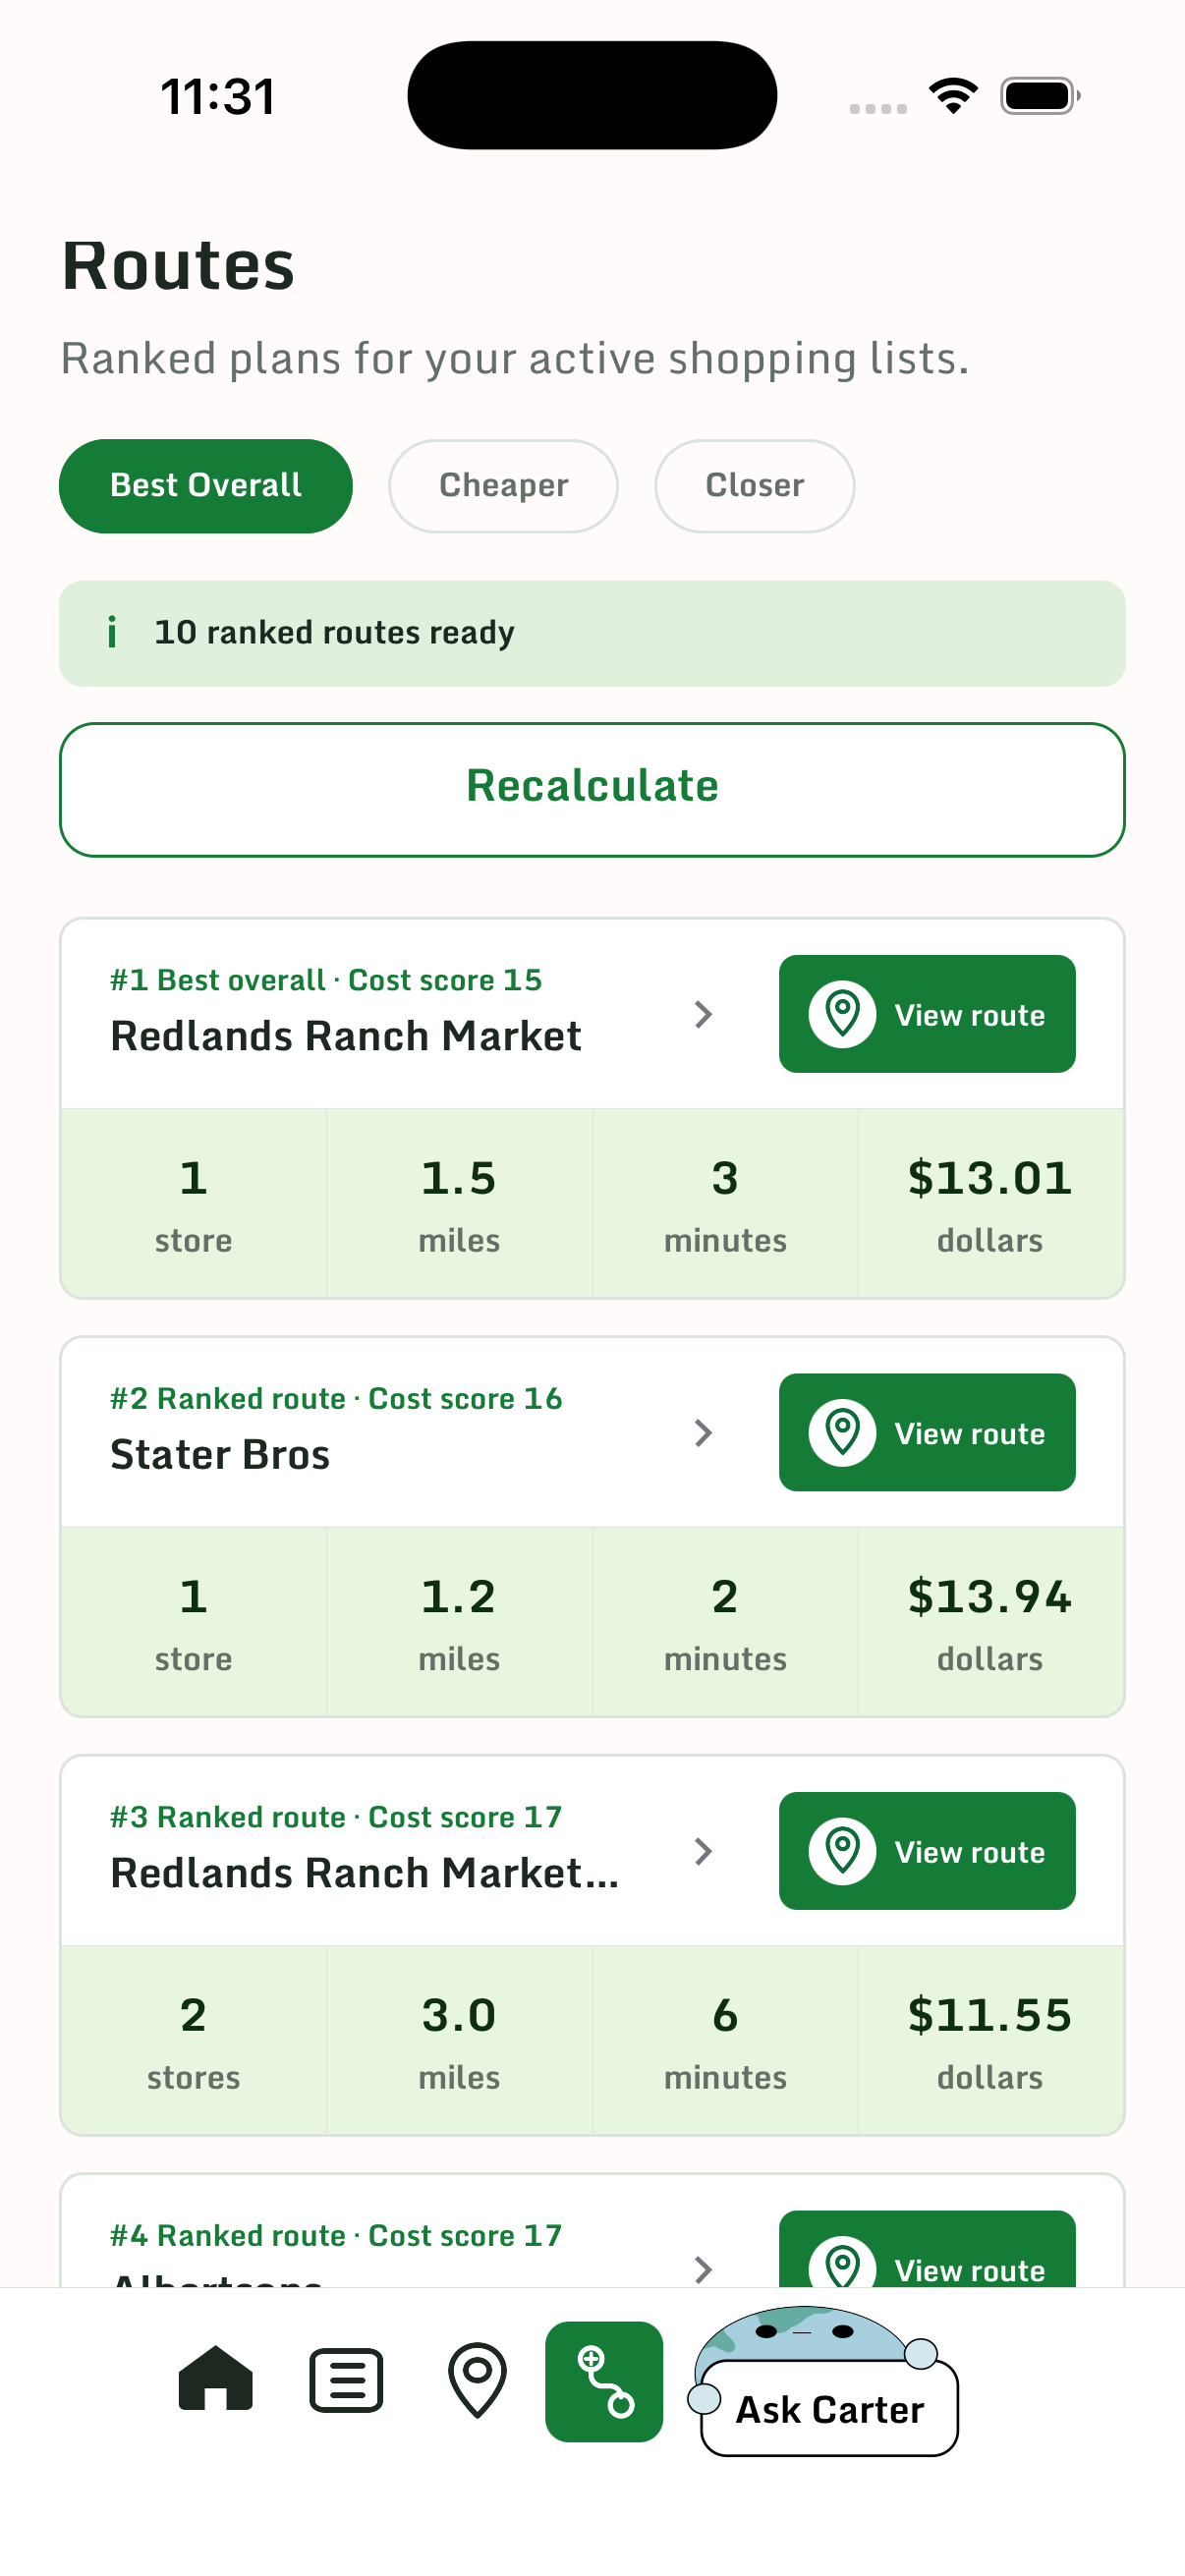
optimized routes page
-
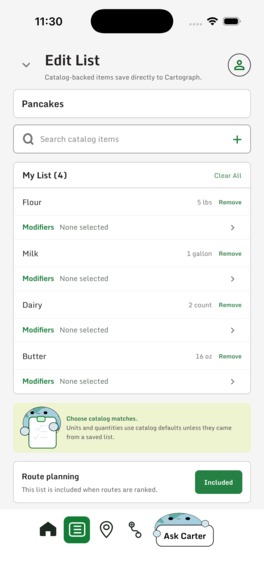
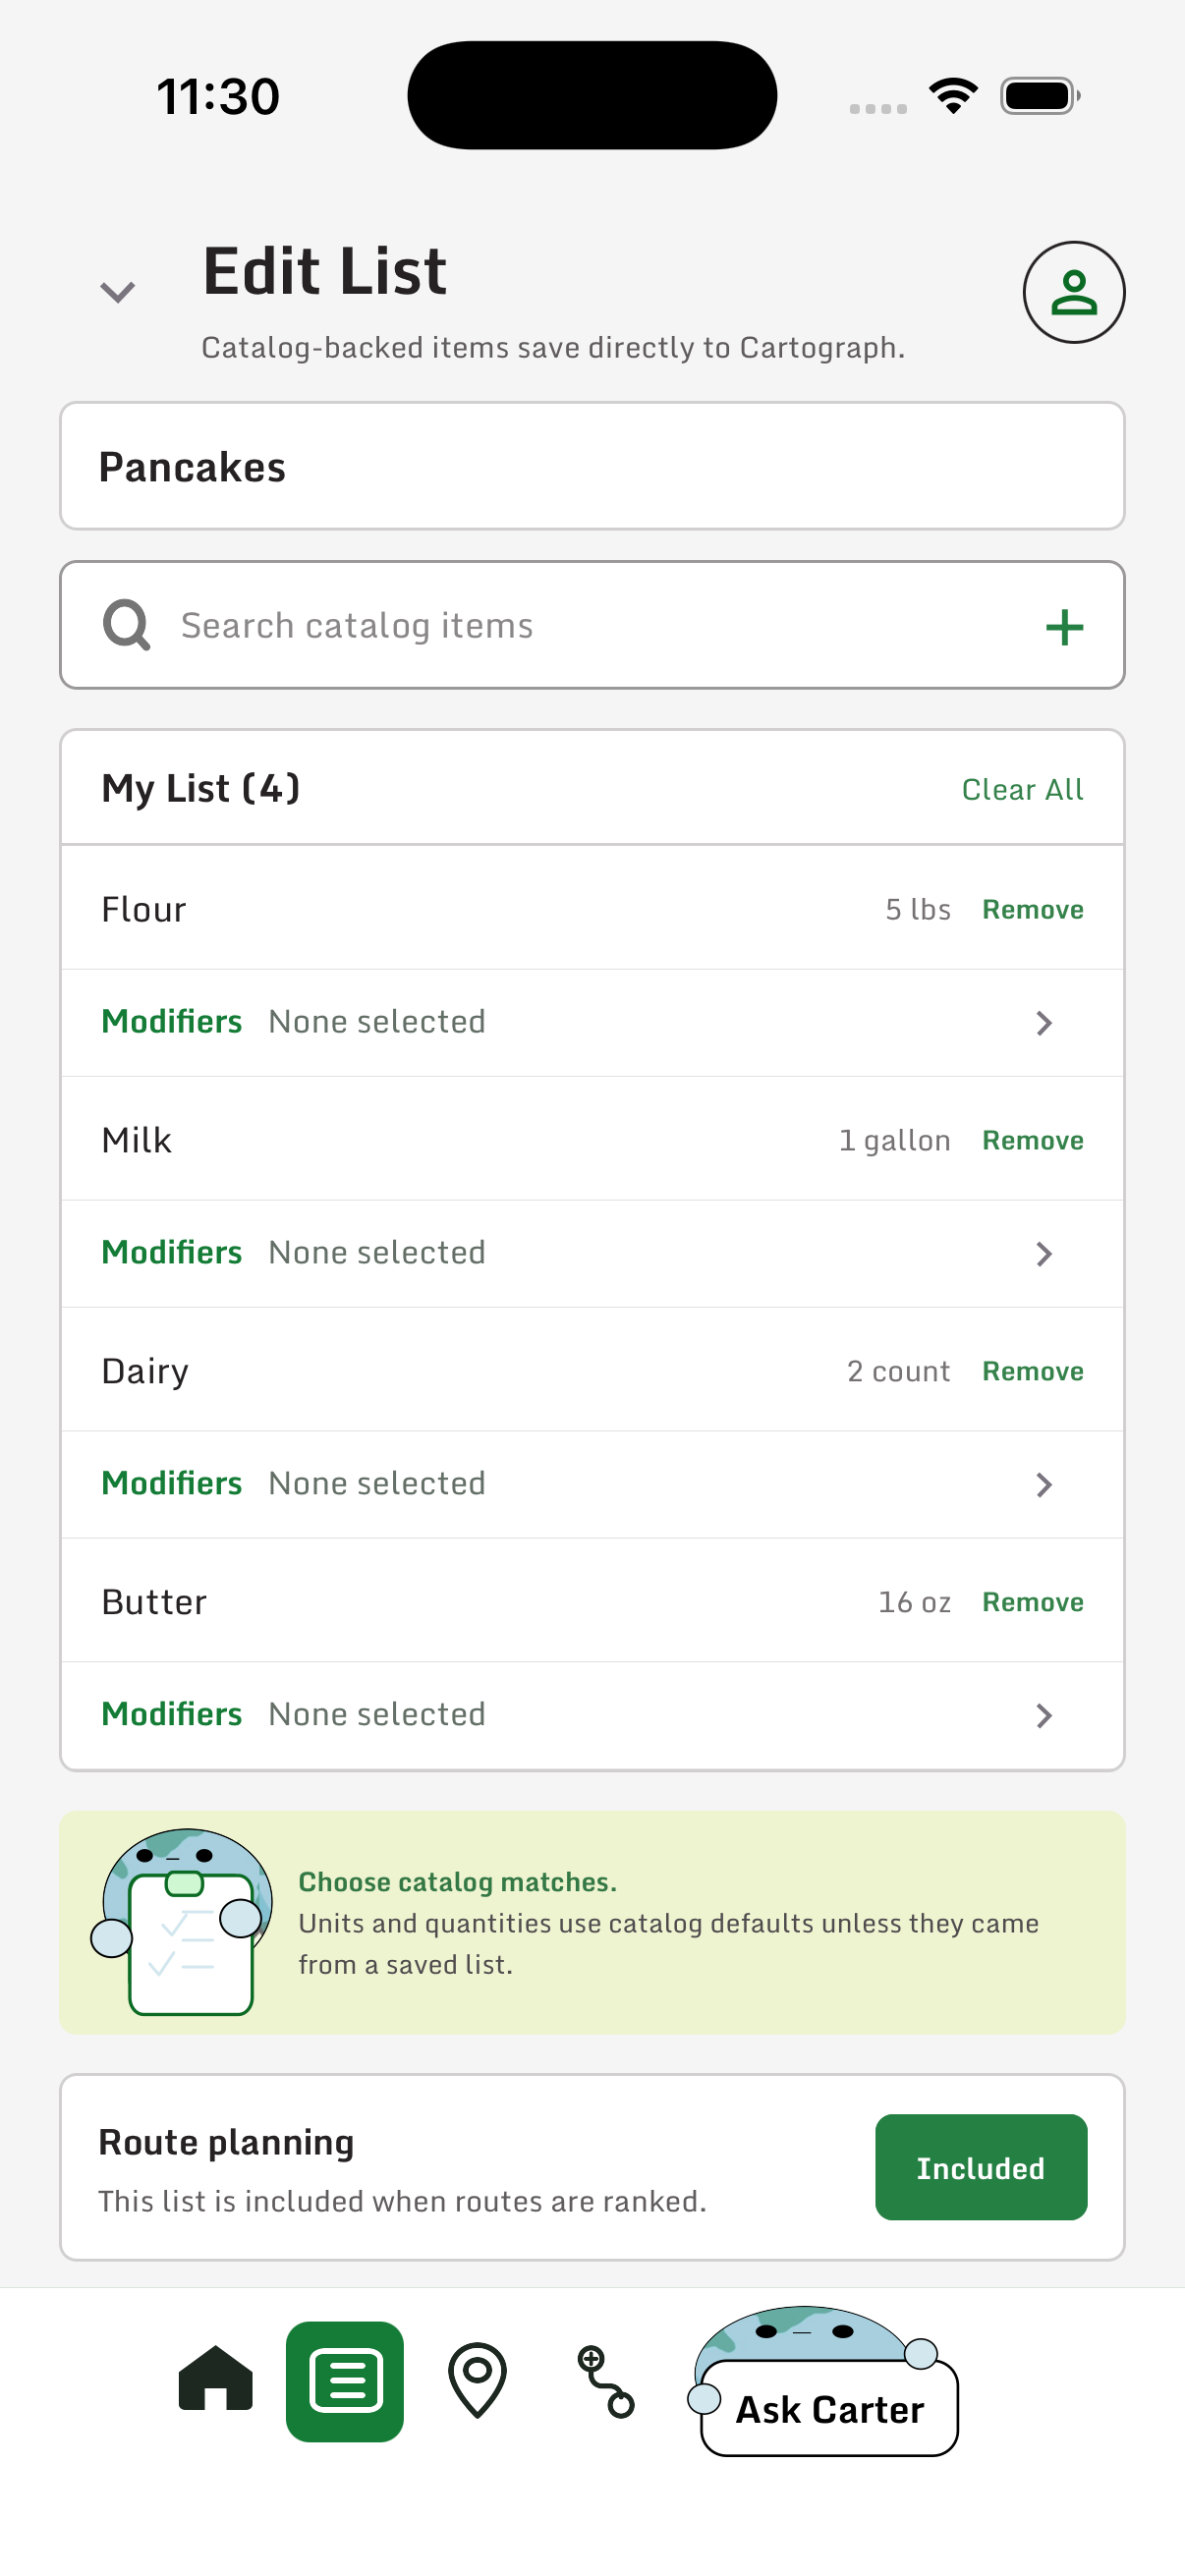
edit list screen (includes modifiers option)
-
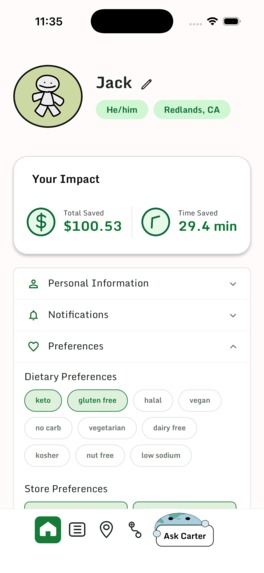
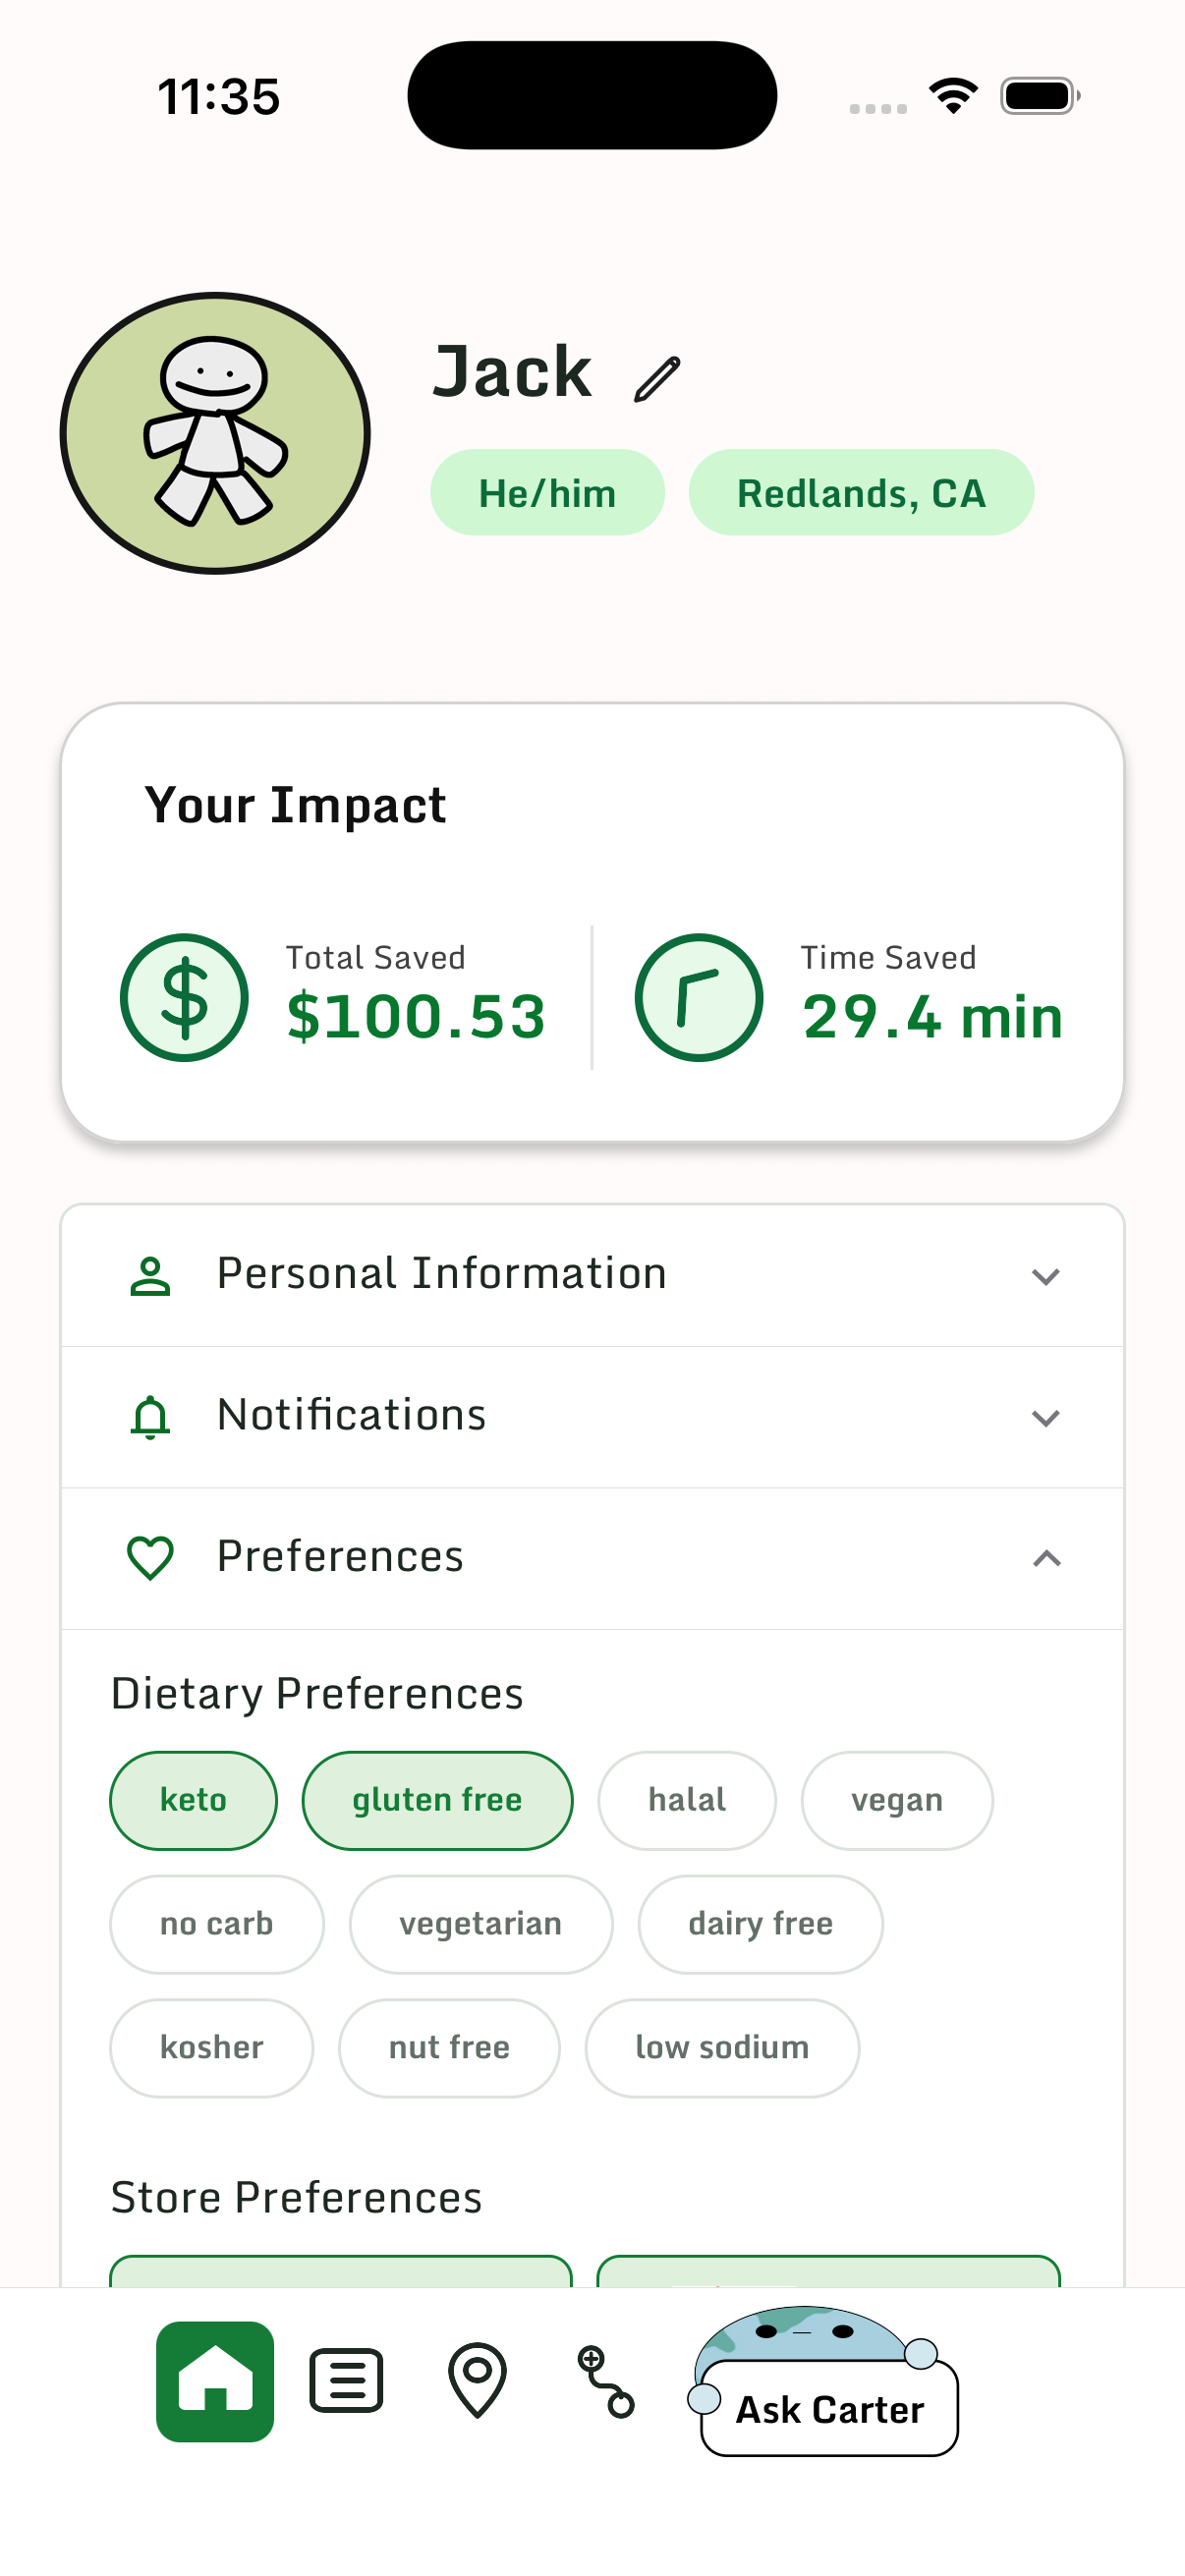
profile screen - personalization

Inspiration
Grocery shopping is something almost everyone has to do, but it can also be surprisingly stressful. We've all had moments where we got home and realized another store had the same item for less or wondered if driving to one more store would actually save us money. Planning a shopping trip often means juggling grocery lists, store apps, and navigation all at once.
That is what inspired us to build CARTograph, an interactive app that brings everything together by helping people compare prices, plan smarter routes, and make grocery shopping feel a little less overwhelming.
We hope CARTograph gives people more confidence in their shopping decisions, help them stretch their budget a little further, and makes one of life's everyday errands just a bit easier.
What it does
Think of CARTograph as your grocery companion. Whether you're planning meals for the week, picking up a few essentials, or trying to stick to a budget, CARTograph helps you find the smartest way to shop. Create a shopping list yourself or import a recipe, and the app compares prices across nearby grocery stores before recommending the best route based on overall savings. This means not just the lowest prices, but also travel time, distance, and estimated gas costs.
You can also discover nearby deals, chat with the built-in AI assistant for shopping or meal planning help and customize recommendations to match your preferences. By bringing grocery planning, price comparison, and navigation into one place, cartograph helps make every grocery trip a little easier and a little more rewarding.
How we built it
CARTograph was designed to help users compare grocery prices, plan shopping trips, and navigate between stores in a single application. We began by creating the application's interface and user experience in Figma, focusing on making grocery planning simple and intuitive. The frontend was built using React Native and TypeScript, allowing us to develop a mobile application experience, while Python was used for backend functionality and application logic. To enhance the user experience, we incorporated Azure OpenAI GPT to power an AI assistant that can help users with shopping and meal-planning tasks.
We also explored ArcGIS technology to support the mapping and routing components of the application. Store locations were geocoded using Geocode Addresses from a single-field CSV and published alongside product data as a Hosted Feature Layer on ArcGIS Online after creating a Relationship Class between the Stores and Products tables. Within ArcGIS Online, we used the Stores layer together with the World Traffic Service from ArcGIS Living Atlas to create a clean and informative map display, which was then embedded into the application by the development team. To support routing functionality, we created an Origin-Destination (OD) Cost Matrix Analysis Layer and added store locations to evaluate driving time and driving distance possibilities between stores. The resulting OD Cost Matrix Analysis output was provided to the development team for frontend and backend integration, supporting more accurate direction display when generating an optimized route.
Throughout development, GitHub Copilot assisted with testing, debugging, and generating boilerplate code, helping us accelerate prototyping during the hackathon. We additionally used Survey123 to collect feedback and better understand user perspectives on the application.
Challenges we ran into
One of the biggest challenges was obtaining reliable, real-time grocery pricing data. While individual retailers often make pricing available through their own websites and applications, aggregating accurate and dynamically updated pricing data across multiple stores is difficult. Data availability, platform differences, and considerations around data access and privacy add additional complexities. Given the limited timeframe of the hackathon, we focused on building a proof of concept that demonstrates the platform's potential while leaving room for future integration with live data sources.
Another significant challenge was integrating ArcGIS technology into the application in a meaningful way. Our goal was not simply to display store locations on a map, but to leverage location intelligence to generate optimized shopping routes that could save users both time and money. To support this vision, we developed and tested a route optimization model in ArcGIS Pro using Network Analyst and ModelBuilder. The workflow involved creating a Route Analysis Layer, adding store locations as stops, and using the Solve tool to generate an optimized route. However, when we attempted to make this model accessible through the application, we encountered licensing and permission limitations that prevented us from sharing the analysis as a web tool within the time constraints of the hackathon.
Despite this setback, the experience provided valuable insight into how routing and spatial analysis can be operationalized in a real-world application. We ultimately identified a workaround using the ArcGIS Maps SDK for JavaScript and ArcGIS routing services, allowing us to continue integrating route optimization capabilities into the prototype. Although we were unable to fully deploy the original ArcGIS Pro model, the process helped validate the concept and establish a path for future implementation.
Finally, mobile application development presented several technical hurdles, including emulator setup and troubleshooting integration issues across multiple technologies. As with any hackathon project, we had more ideas than time. Balancing ambitious functionality with a limited development window required us to prioritize core features, focus on delivering a complete end-to-end workflow, and ensure that the final product remained aligned with our vision of helping users shop smarter and save money.
Accomplishments that we're proud of
We are especially proud of successfully integrating an Azure OpenAI-powered assistant into CARTograph. Rather than functioning as a simple chatbot, the assistant provides practical value by helping users generate shopping lists, discover meal ideas, and extract ingredients directly from recipes. This allows users to move seamlessly from meal planning to grocery planning within a single experience. We are also proud of implementing route optimization and mapping capabilities that consider more than just product prices. CARTograph helps users determine whether traveling to multiple stores is actually worth the savings by factoring in distance and efficiency. Most importantly, we are proud of bringing together grocery planning, geographic analysis, AI assistance, and route optimization into one cohesive application. Building a fully functional prototype that addresses both the cost and time burdens of grocery shopping within a hackathon timeframe was something our team is extremely proud of.
What we learned
Through building CARTograph, we learned that building an application is often easier than building something people genuinely want to use. While creating features can be exciting, designing those features around real user needs requires a completely different perspective. User feedback consistently reminded us that while certain features may seem valuable or exciting from a development perspective, they must remain convenient and simple, as users are the main priority throughout the process.
We also gained a much deeper appreciation for the role that geographic analysis can play in solving everyday problems. By incorporating ArcGIS technology, we saw firsthand how location intelligence could improve decision-making in practical situations like grocery shopping. From a technical perspective, we learned the importance of connecting frontend design, backend systems, and user workflows into a seamless experience.
One of our biggest takeaways from building CARTograph was that presenting an idea effectively is just as important as building it. A strong presentation helps people understand not only what a product does, but also why it matters and how it is relevant.
What's next for CARTograph
While our hackathon prototype demonstrates the core concept, we see significant opportunities where CARTograph can continue to grow. Our next major goal is integrating real-time grocery pricing and live traffic information so that recommendations can become even more accurate and personalized. This would allow users to make decisions based on current conditions rather than static data. We would also want to widen the geographic area that CARTograph covers to beyond just Redlands, CA so all users would be able to find their ideal grocery paths.
We also envision adding social and gamified features that make saving time and money more engaging. Friends and family could compete to reach savings milestones, share shopping challenges, or compare progress over time. In the future, we would like to further expand the AI assistant's capabilities by providing more personalized budgeting and meal-planning support based on individual preferences. Ultimately, our goal is to deploy CARTograph as a fully available mobile application and continue refining it into a tool that helps people save both money and time on one of life's most common errands.
At its core, CARTograph is about more than finding cheaper groceries. It is about helping people shop with confidence, spend less time planning errands, and spend more time on the moments that matter most.
Built With
- azure
- figma
- github
- python
- react-native
- survey123
- typescript


Log in or sign up for Devpost to join the conversation.