-
-
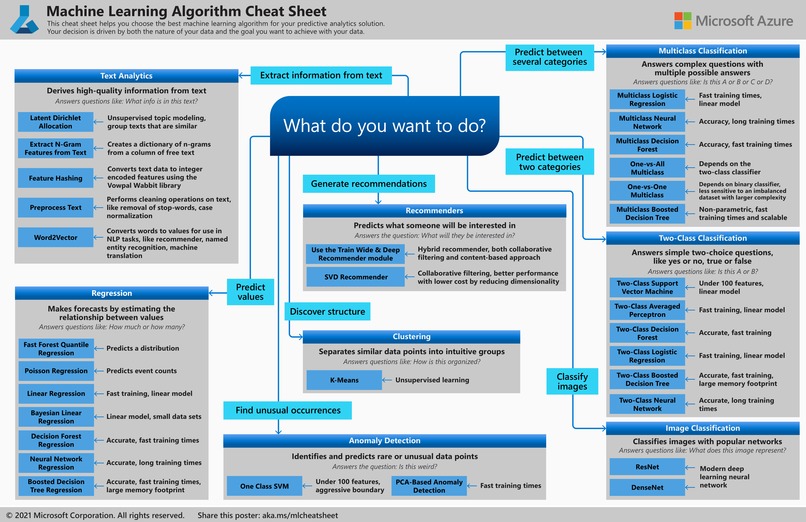
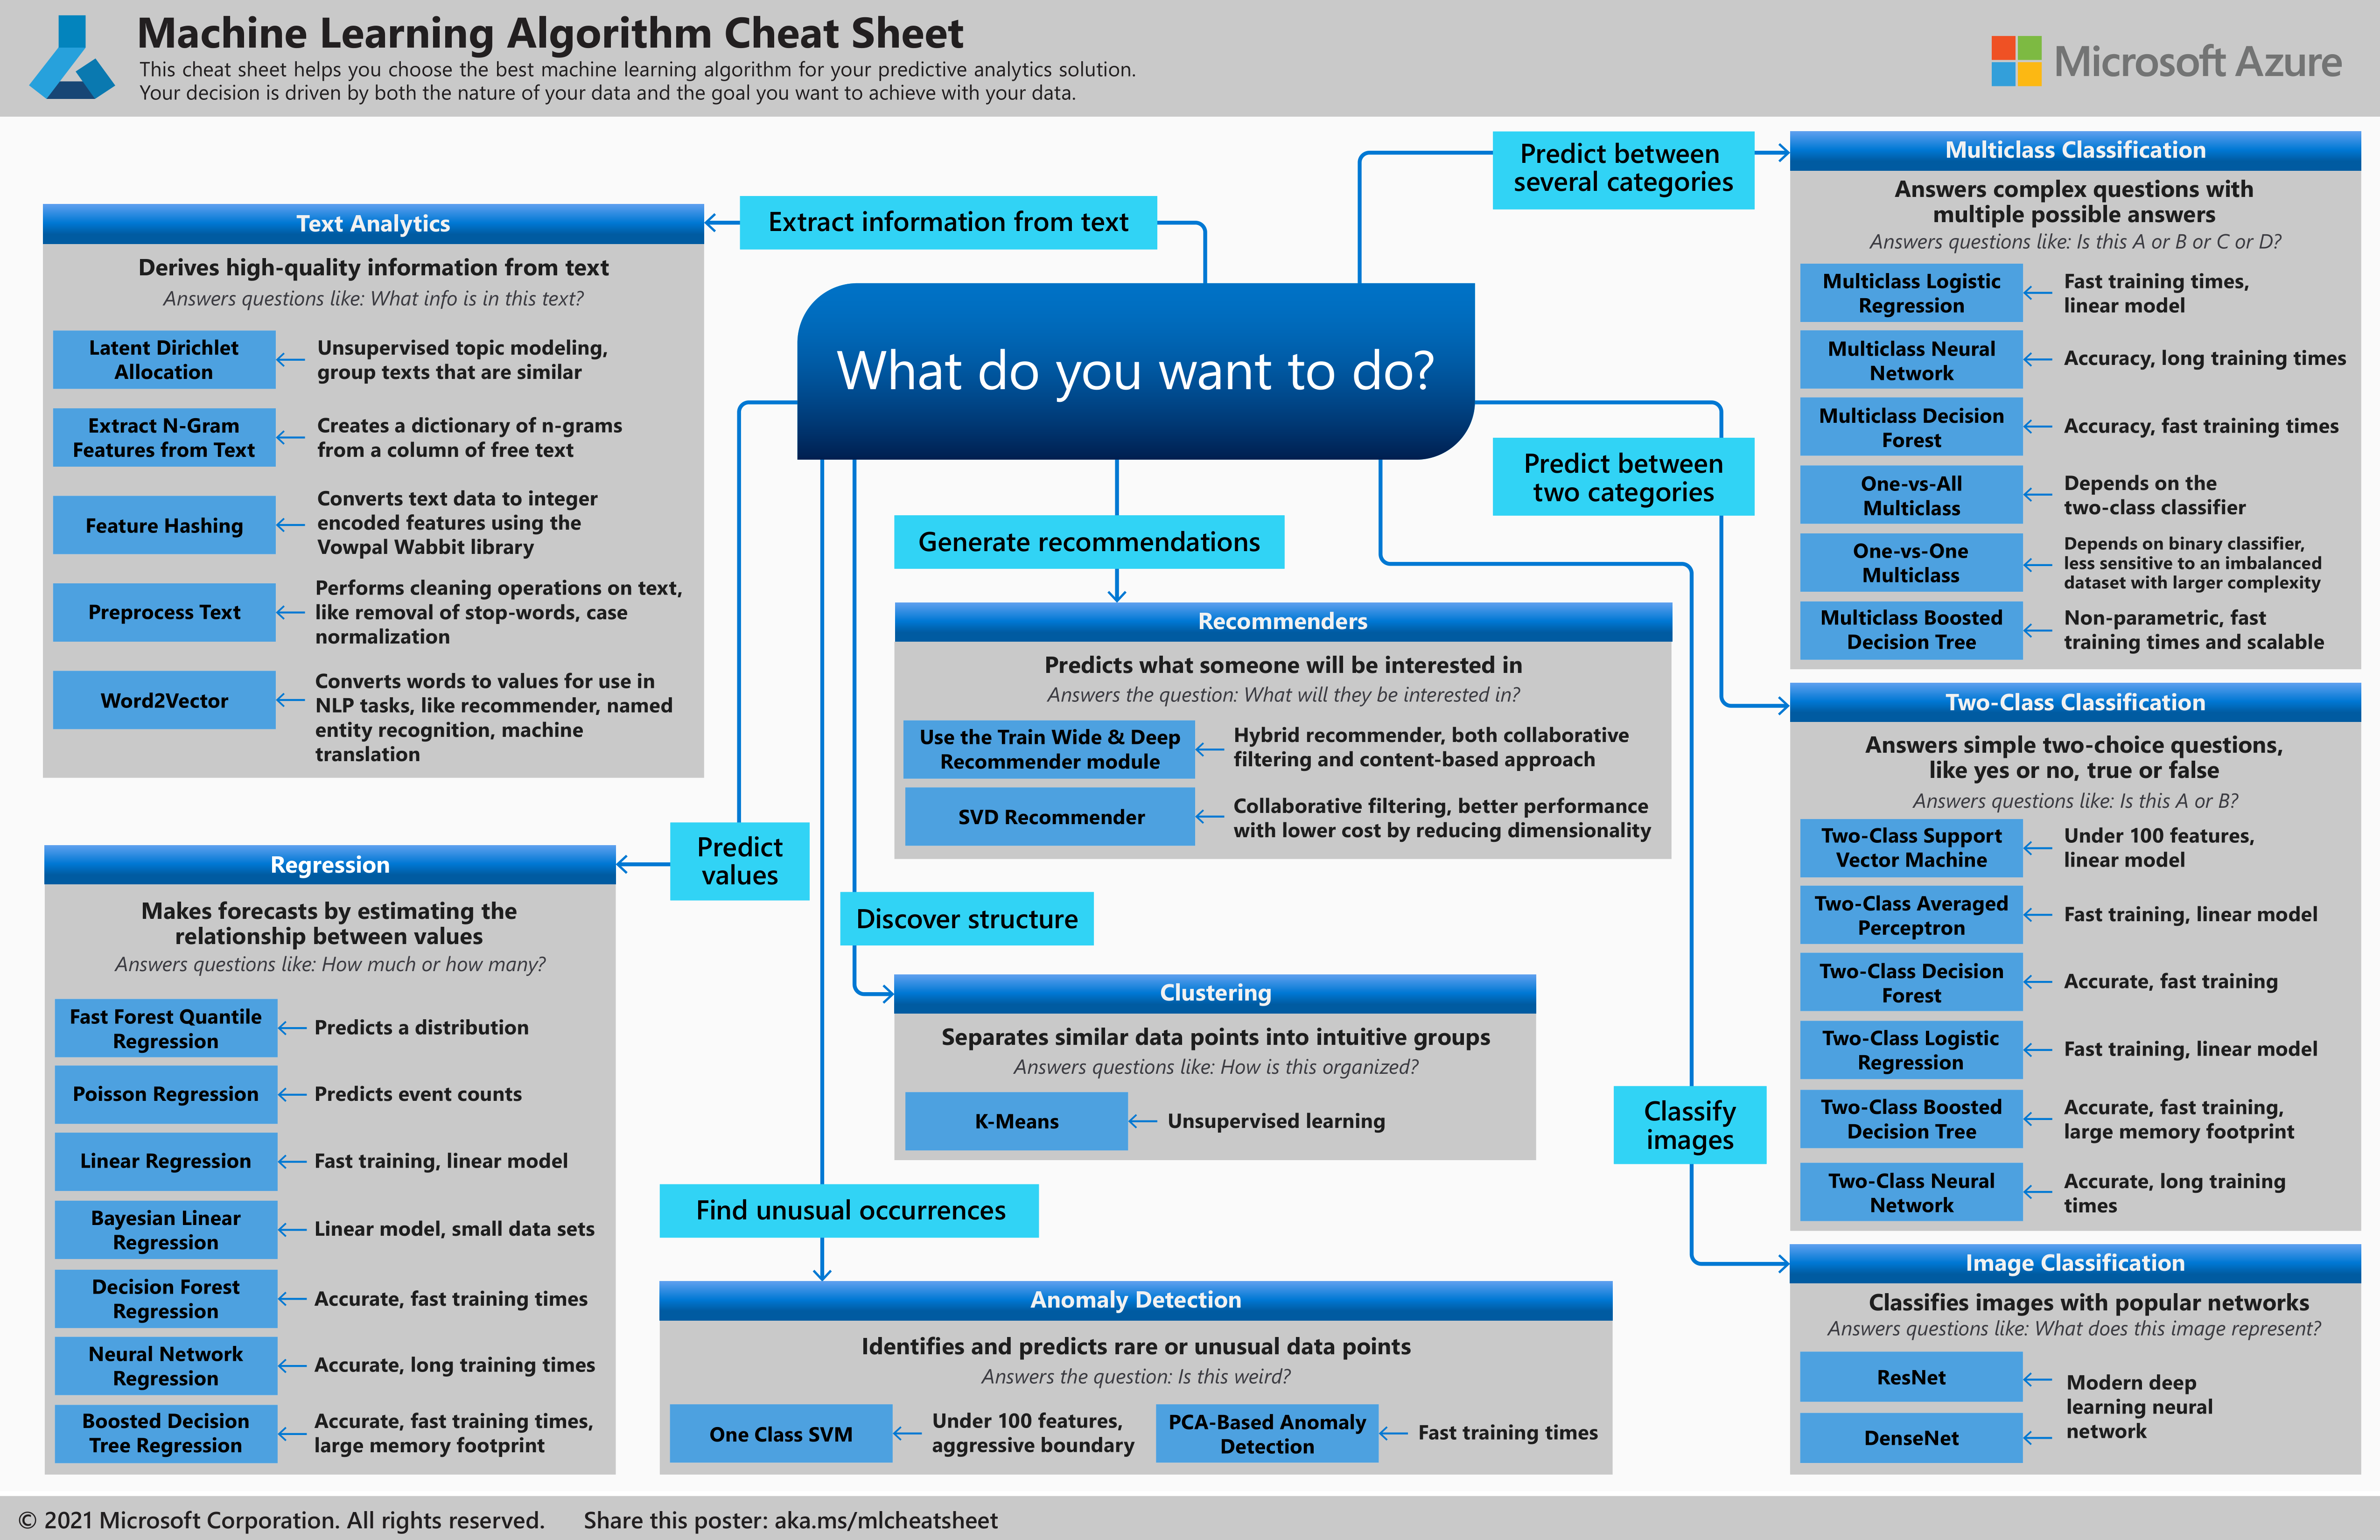
Decide a ML Algorithm for your workload
-

PowerBI: Top 10 Car Brands & Models
-

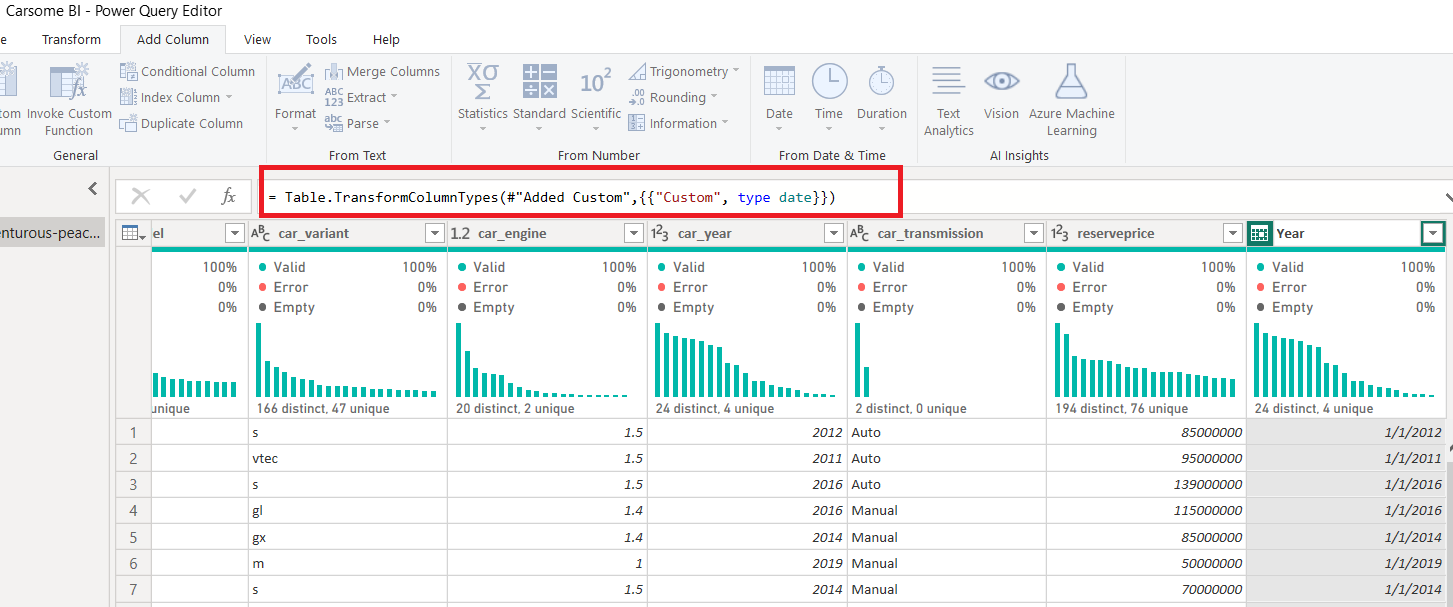
PowerBI: Change car year column data type from whole number to date
-
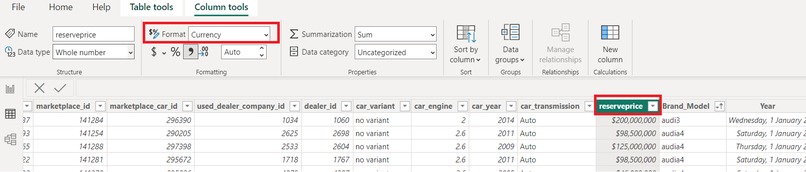
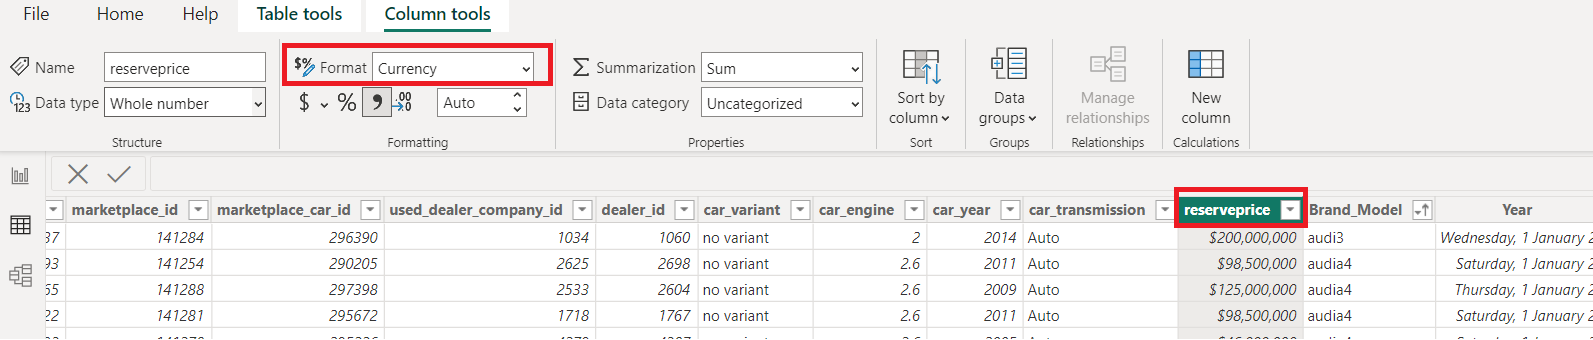
PowerBI: Reserve price as currency
-
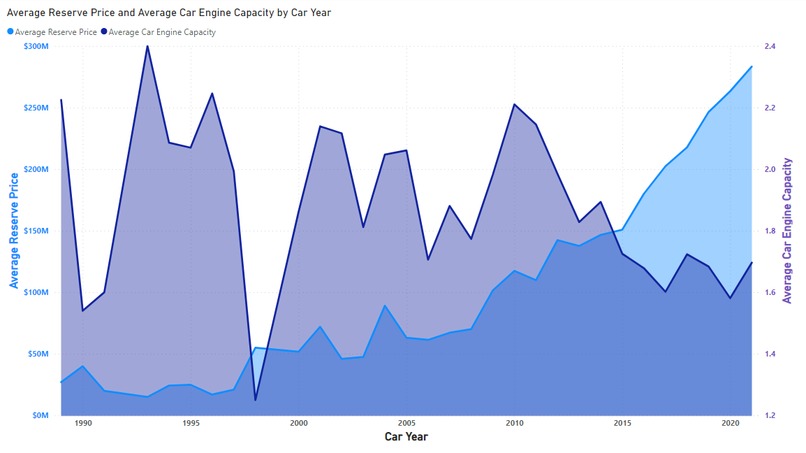
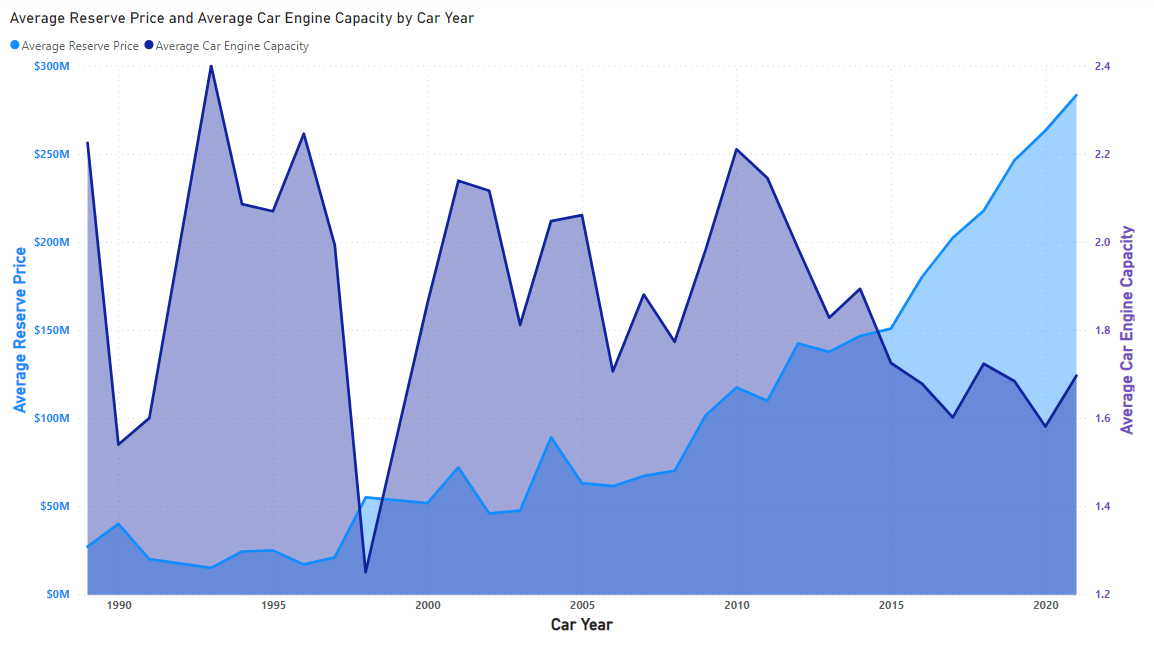
PowerBI: Price vs Engine Capacity vs Year
-

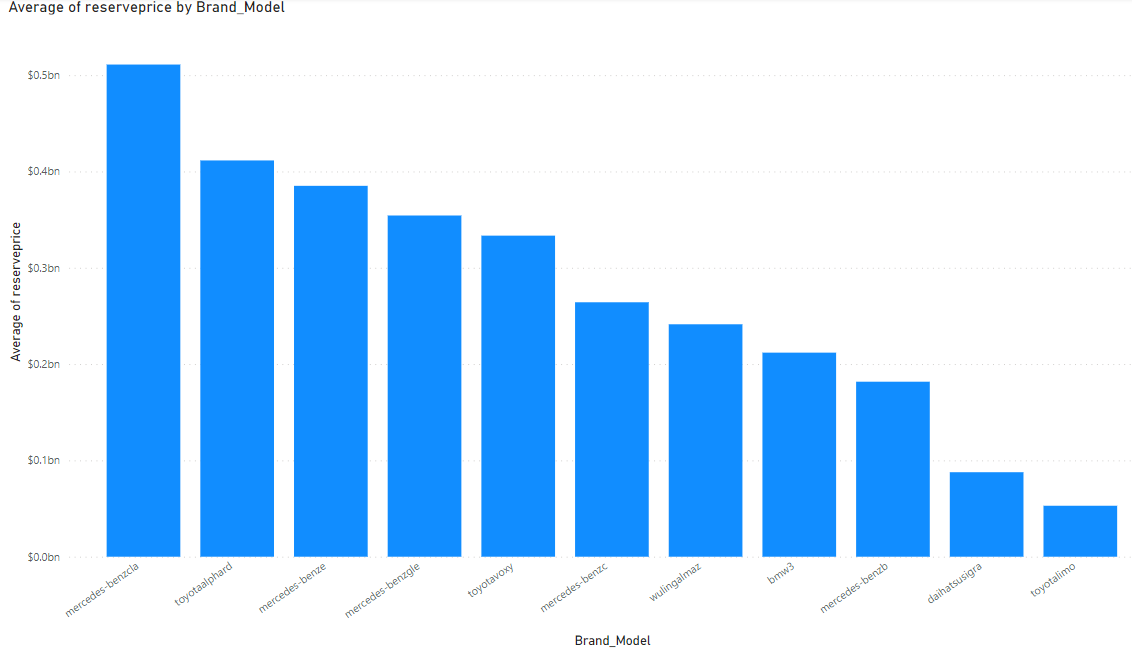
Brand Model vs Reserve Price
-

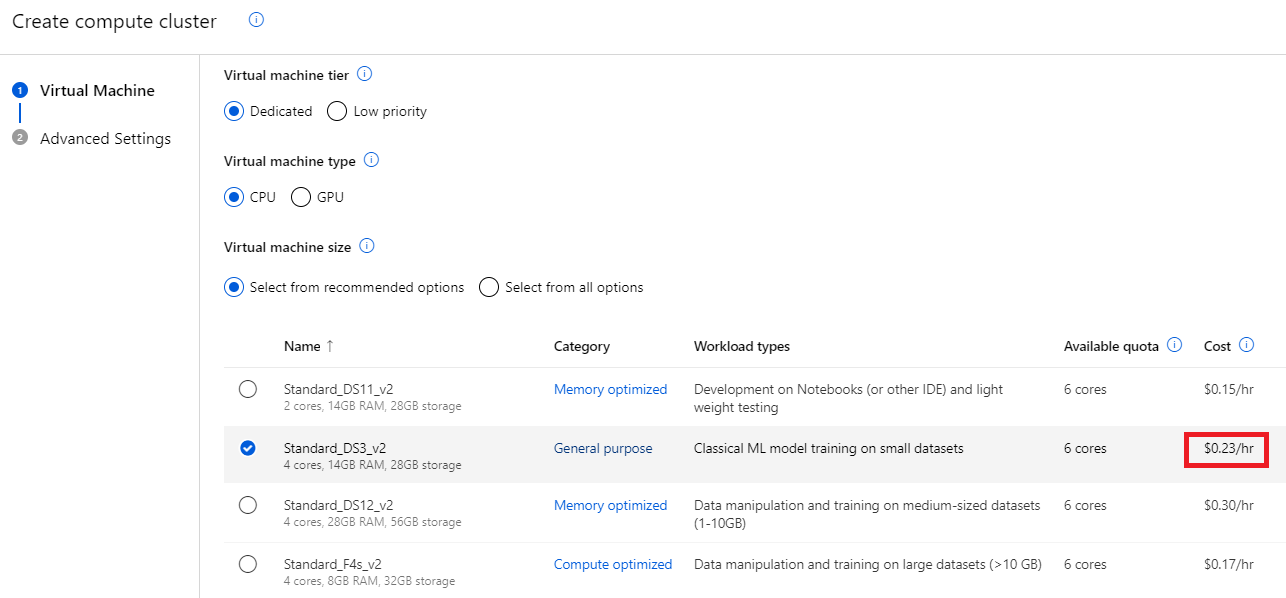
Azure ML Compute Cluster Selection
-
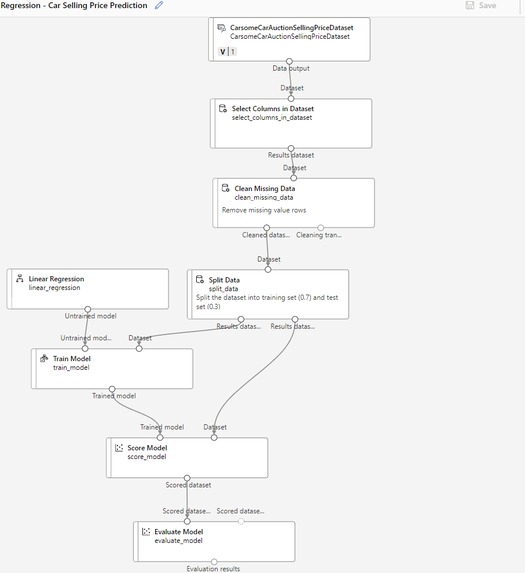
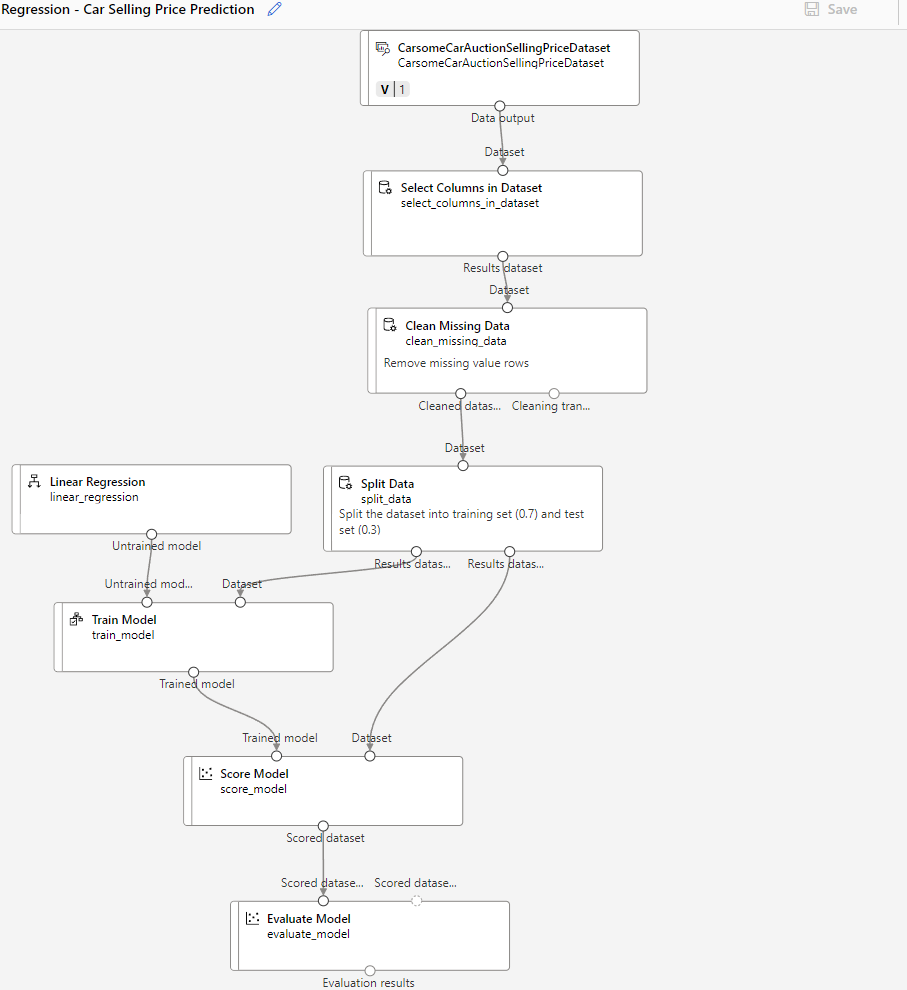
Azure ML Designer Prediction Model
-
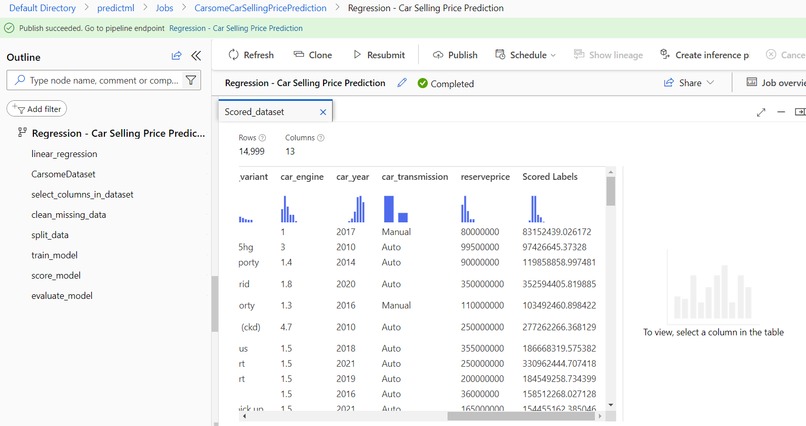
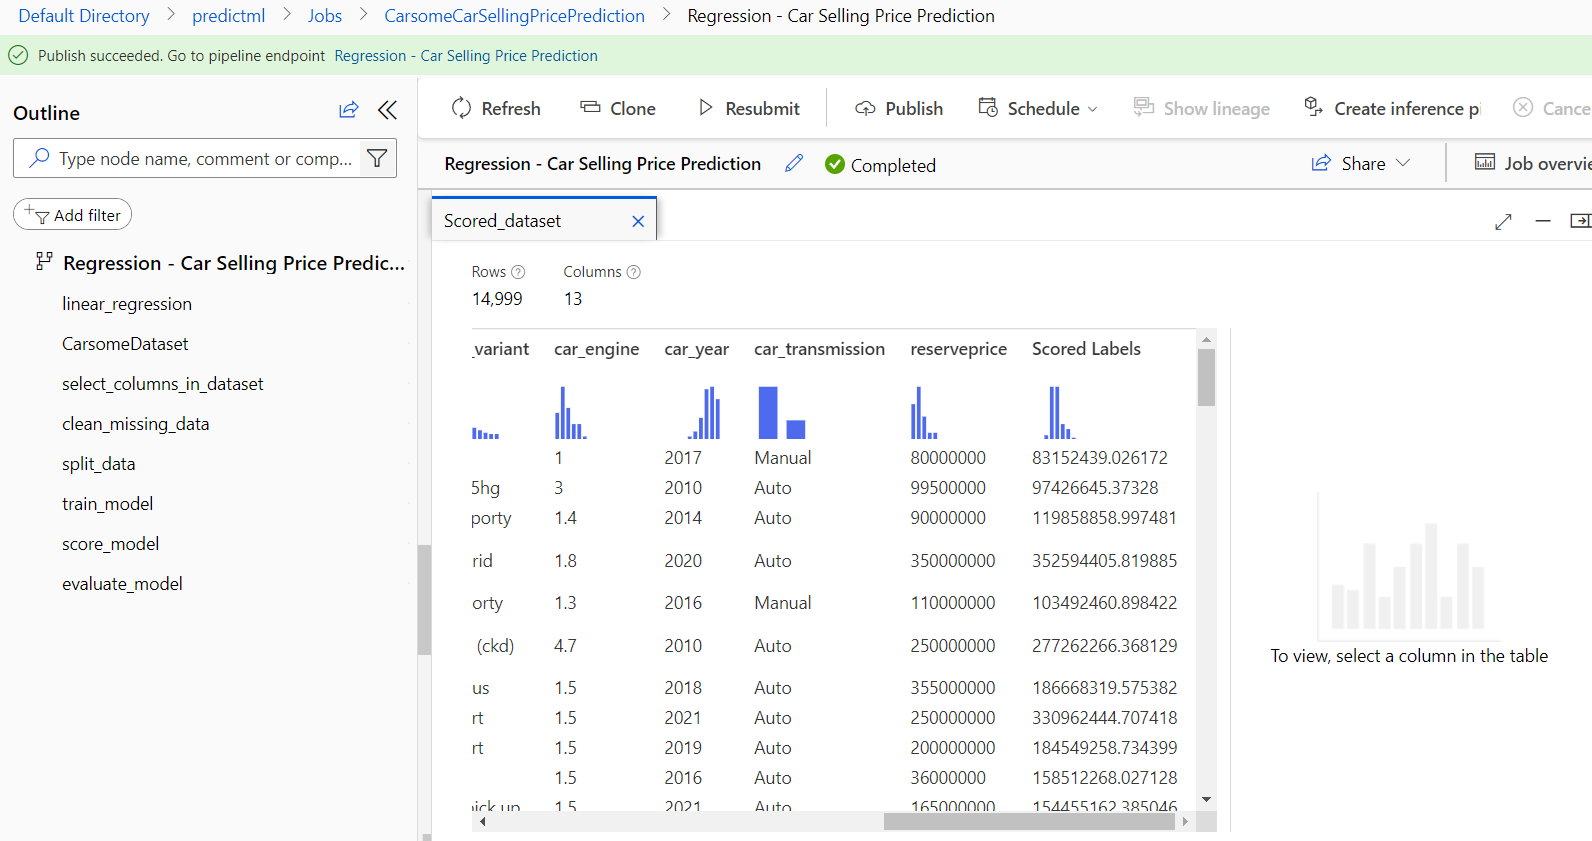
Azure ML Scored Dataset
-
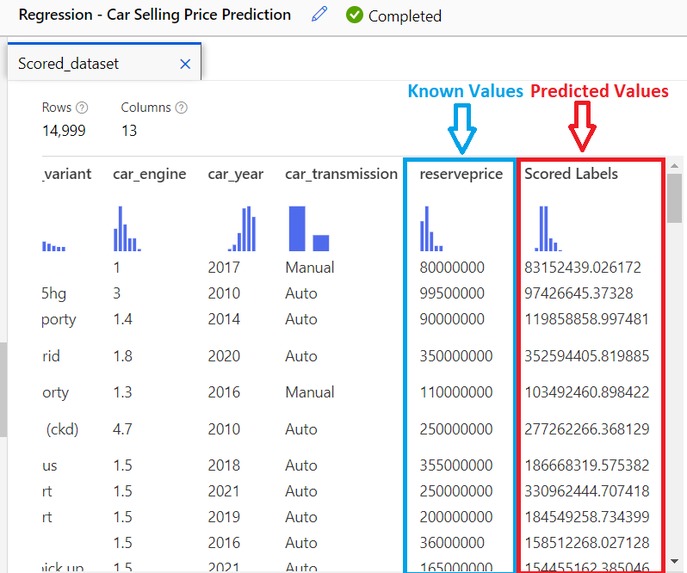
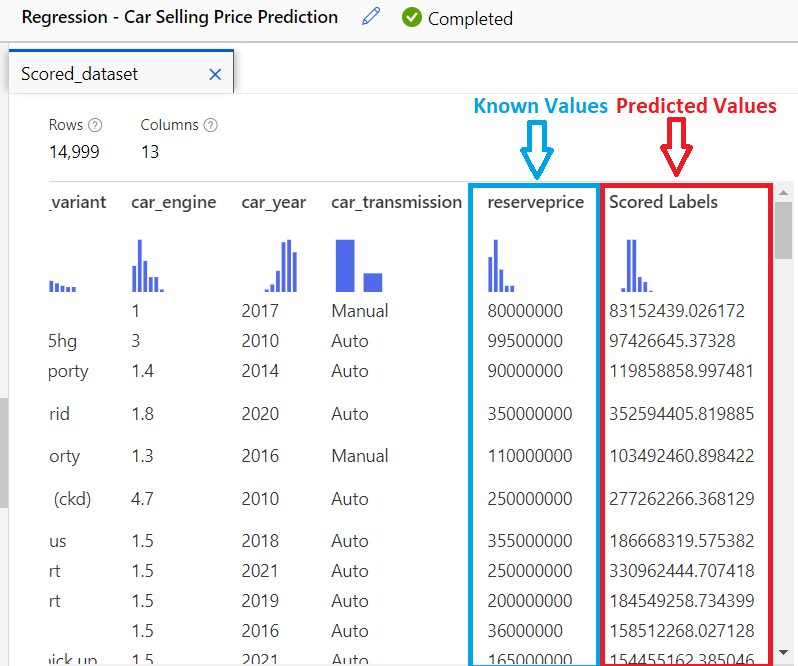
Azure ML Scored Labels
-

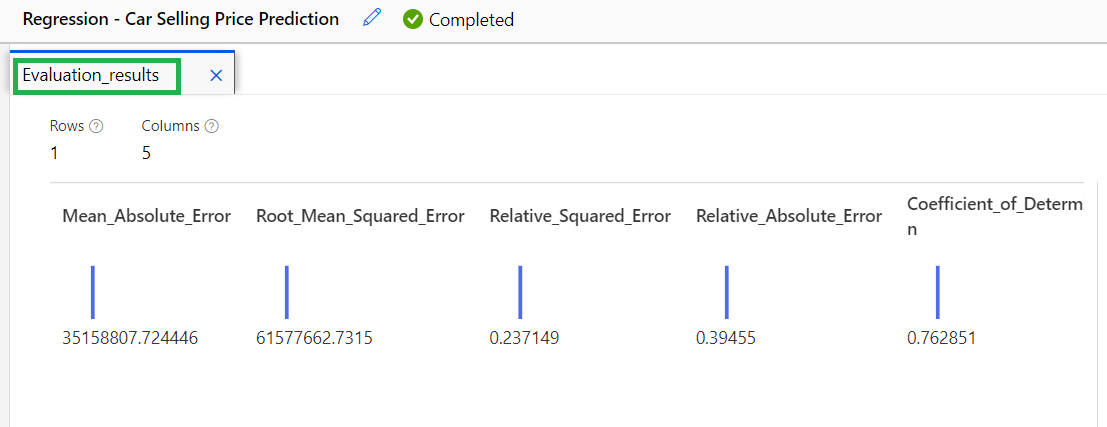
Azure ML Evaluation Results
Hi organisers, judges, fellow participants and enthusiasts! This is my first time attempting a hackathon and trying out machine learning. I came from a non-technical background and worked in the banking and financial sector. Thanks for viewing. In any way, if you have any suggestion, I am happy to further explore and finetune the idea and workaround. Thank you for creating this hackathon event and for your time and guidance. Any questions or comments are welcomed! 😀
I do not drive nor have a driving license or any knowledge about cars. I am as good as a piece of blank paper, I choose to keep an open mind and keep believing! I had fun trying out this challenge playing with Power BI and Microsoft Azure Machine Learning (ML)! 🤩
It was a great learning experience. 👍
For decades, Microsoft Excel, Word and PowerPoint have been some of the most widely used products for building and maintaining day-to-day business operation solutions for companies worldwide. With increased difficulties in solving business challenges in this ever fast-changing world with little time yet bigger amount of data, I believe in using Microsoft PowerBI and Azure ML can help businesses develop low cost, quick and efficient solutions. 💡🌏
Please see YouTube video and click next >, expand ⛶ to refer to the images I have submitted for your viewing. 📽️🖻
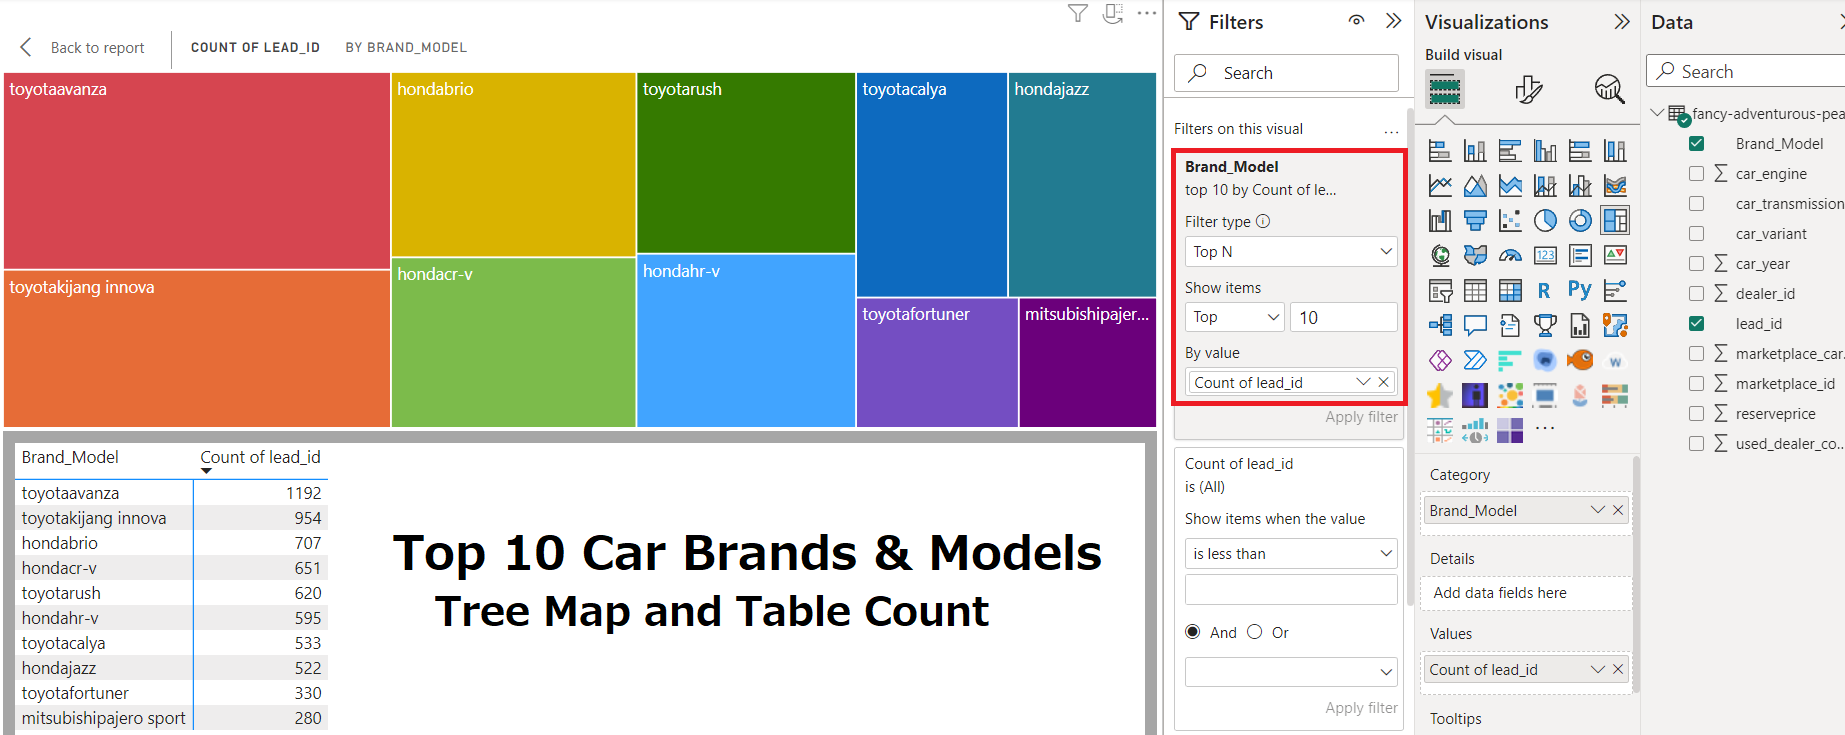
Power BI > Transform Data > Merge Columns (brand, model) from two into one merged column
Tree Map Chart, Top 10 Best Selling Cars 🚗🚘🚙
Toyota Avanza is the best selling car model, followed by Toyota Kijang Innova and Honda Brio making into the Top 3.
The Top 3 car brands are Toyota, Honda and Mitsubishi.
Area Chart, Correlation
🔵 Average Reserve Price (Blue, Y-axis, Left Vertical) and 🟣 Average Car Engine Capacity (Purple, Secondary Y-axis, Right Vertical) vs ⚫ Car Year (timeline, X-axis, Horizontal)
Auction date, car mileage and car prices are not exactly provided in the dataset. 😢💡
To develop an alternative quick solution, I decided to use Car Year to replace Auction Date;
Car Engine (capacity) to replace Car Mileage;
Reserve Price to replace Car Prices
- No significant Correlation - Engine Capacity vs Car Year;
- Additionally according to the graph, we can deduce that the engine capacity has no significant correlation with price, hence making an assumption based on weak evidence that mileage might not have much impact on car pricing
- Positive Correlation - Price vs Car Year (Upward Trend), the newer the car, the more expensive the price 📈
Column Chart, Correlation
Additionally, I decided to build a chart to find out how price is related to car Brand and Model. The result concluded that Mercedes is the most expensive brand. Among others are Toyota, Wuling and BMW for their higher-end models.
I decided to use the Linear Regression model to help me to predict car selling prices. 🤖
Azure ML Evaluation Results 📜
Azure ML uses model evaluation for the measurement of the trained model accuracy. For Regression models, Evaluate Model module provides the following five regression model evaluation metrics:
Mean absolute error (MAE) is the regression model evaluation metrics which produces the score that measures how close the model is to the actual values - the lower score, the better the model performance.
Root Mean Squared Error (RMSE) is the regression model evaluation metrics which represents the square root from the squared mean of the errors between predicted and actual values.
Relative squared error (RSE) is the regression model evaluation metrics which is based on the square of the differences between predicted and true values. The value is between 0 and 1. The closer this value is to 0, the better the model performance. Relativity of this metric helps to compare model performances for the labels in different units. My RSE for this experiment is 0.23.
Relative absolute error (RAE) is one of the regression model evaluation metrics which measures the performance of a predictive model by basing on absolute differences between predicted and true values. The value is between 0 and 1. The closer this value is to 0, the better the model performance. Relativity of this metric helps to compare model performances for the labels in different units. My RAE for this experiment is 0.39.
Coefficient of determination (R2) is the regression model evaluation metrics which reflects the model performance: the closer R2 is to 1 - the better the model fits the data. My R2 for this experiment is 0.76.
Overall, my first prediction experiment is moderately accurate and further experiments can be carried out with various adjustments to make the predictions perform better and more accurately.
Azure ML Designer is the low-code no-code option I have chosen to develop my solution for this challenge. 🖌️
The drag and drop modules are easy to use on the Designer's canvas. 🎨
The library includes Data Transformation, ML Algorithms, Model Scoring, Evaluation and other prebuilt modules which anyone with basic ML knowledge can leverage on.
Cost
Low cost of $0.23 per hour for the compute cluster I have adopted to complete the workload of developing classical ML model training on small dataset. 💰
Conclusion 🤔💭
I would love to broaden my knowledge about every available algorithm and its suitability to better match problem to solution and try out other ML algorithms by further experimenting to achieve better evaluation results of RAE 0.1 and R2 0.9. Also, I would like to learn how to better prepare data, so that it becomes second nature to get the data clean and ready for experiment. 🧪
I feel the precision of how car is priced is especially important so that it can build customer trust that the price offered is the most attractive in the market. Eventually, my idea would be to incorporate the best prediction model into Carsome website, to better predict the price potential buyers are looking for and enhance the browsing experience of customers, so that the purpose of their visit to the website can be met with great satisfactory. It would also be good to setup a budget calculator on the website, so that customer can get insightful results of car models that met their needs and budget. 👛
What I have learned, My eureka moment 💡
As an unskilful tech amateur with little knowledge, it can be very intimidating taking baby steps to complete something which seemed almost impossible at first. I choose to reframe my thinking by believing I'm possible to accomplish something in the end, and this end is just another beginning of something even bigger in the near future. Life is about constantly learning, unlearning and relearning.
My eureka moment was after trying to complete this challenge and putting the puzzle together. I have a slightly clearer view when I relooked at the Area Chart. Understanding the correlation between various data information we have, I can see the linear and non-linear relationships formed. I am thinking of exploring Random Forest Regression and if I can also try out Decision Tree Regression whereby Decision Trees are great for non-linear relationship problem.
Azure ML Pipeline Job ID: 75921f4e-7cdc-41a1-aa35-1f113a63ff22
Built With
- auzreml
- powerbi

Log in or sign up for Devpost to join the conversation.