-
-
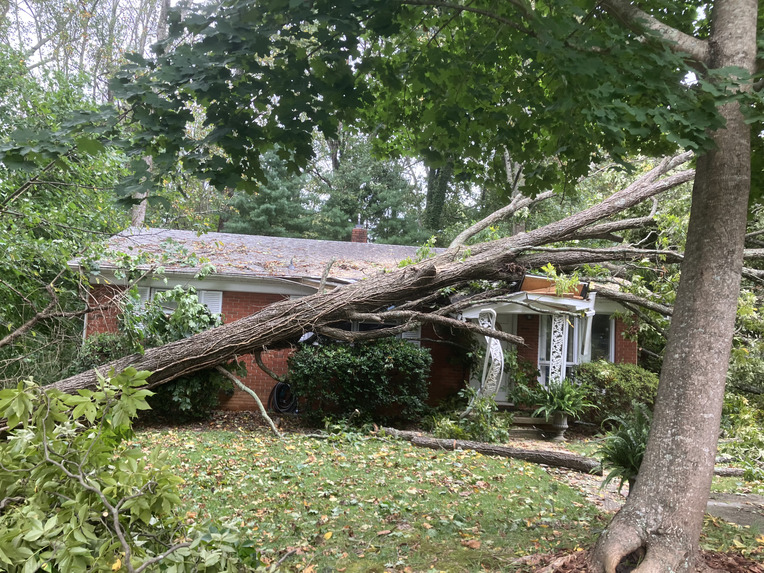
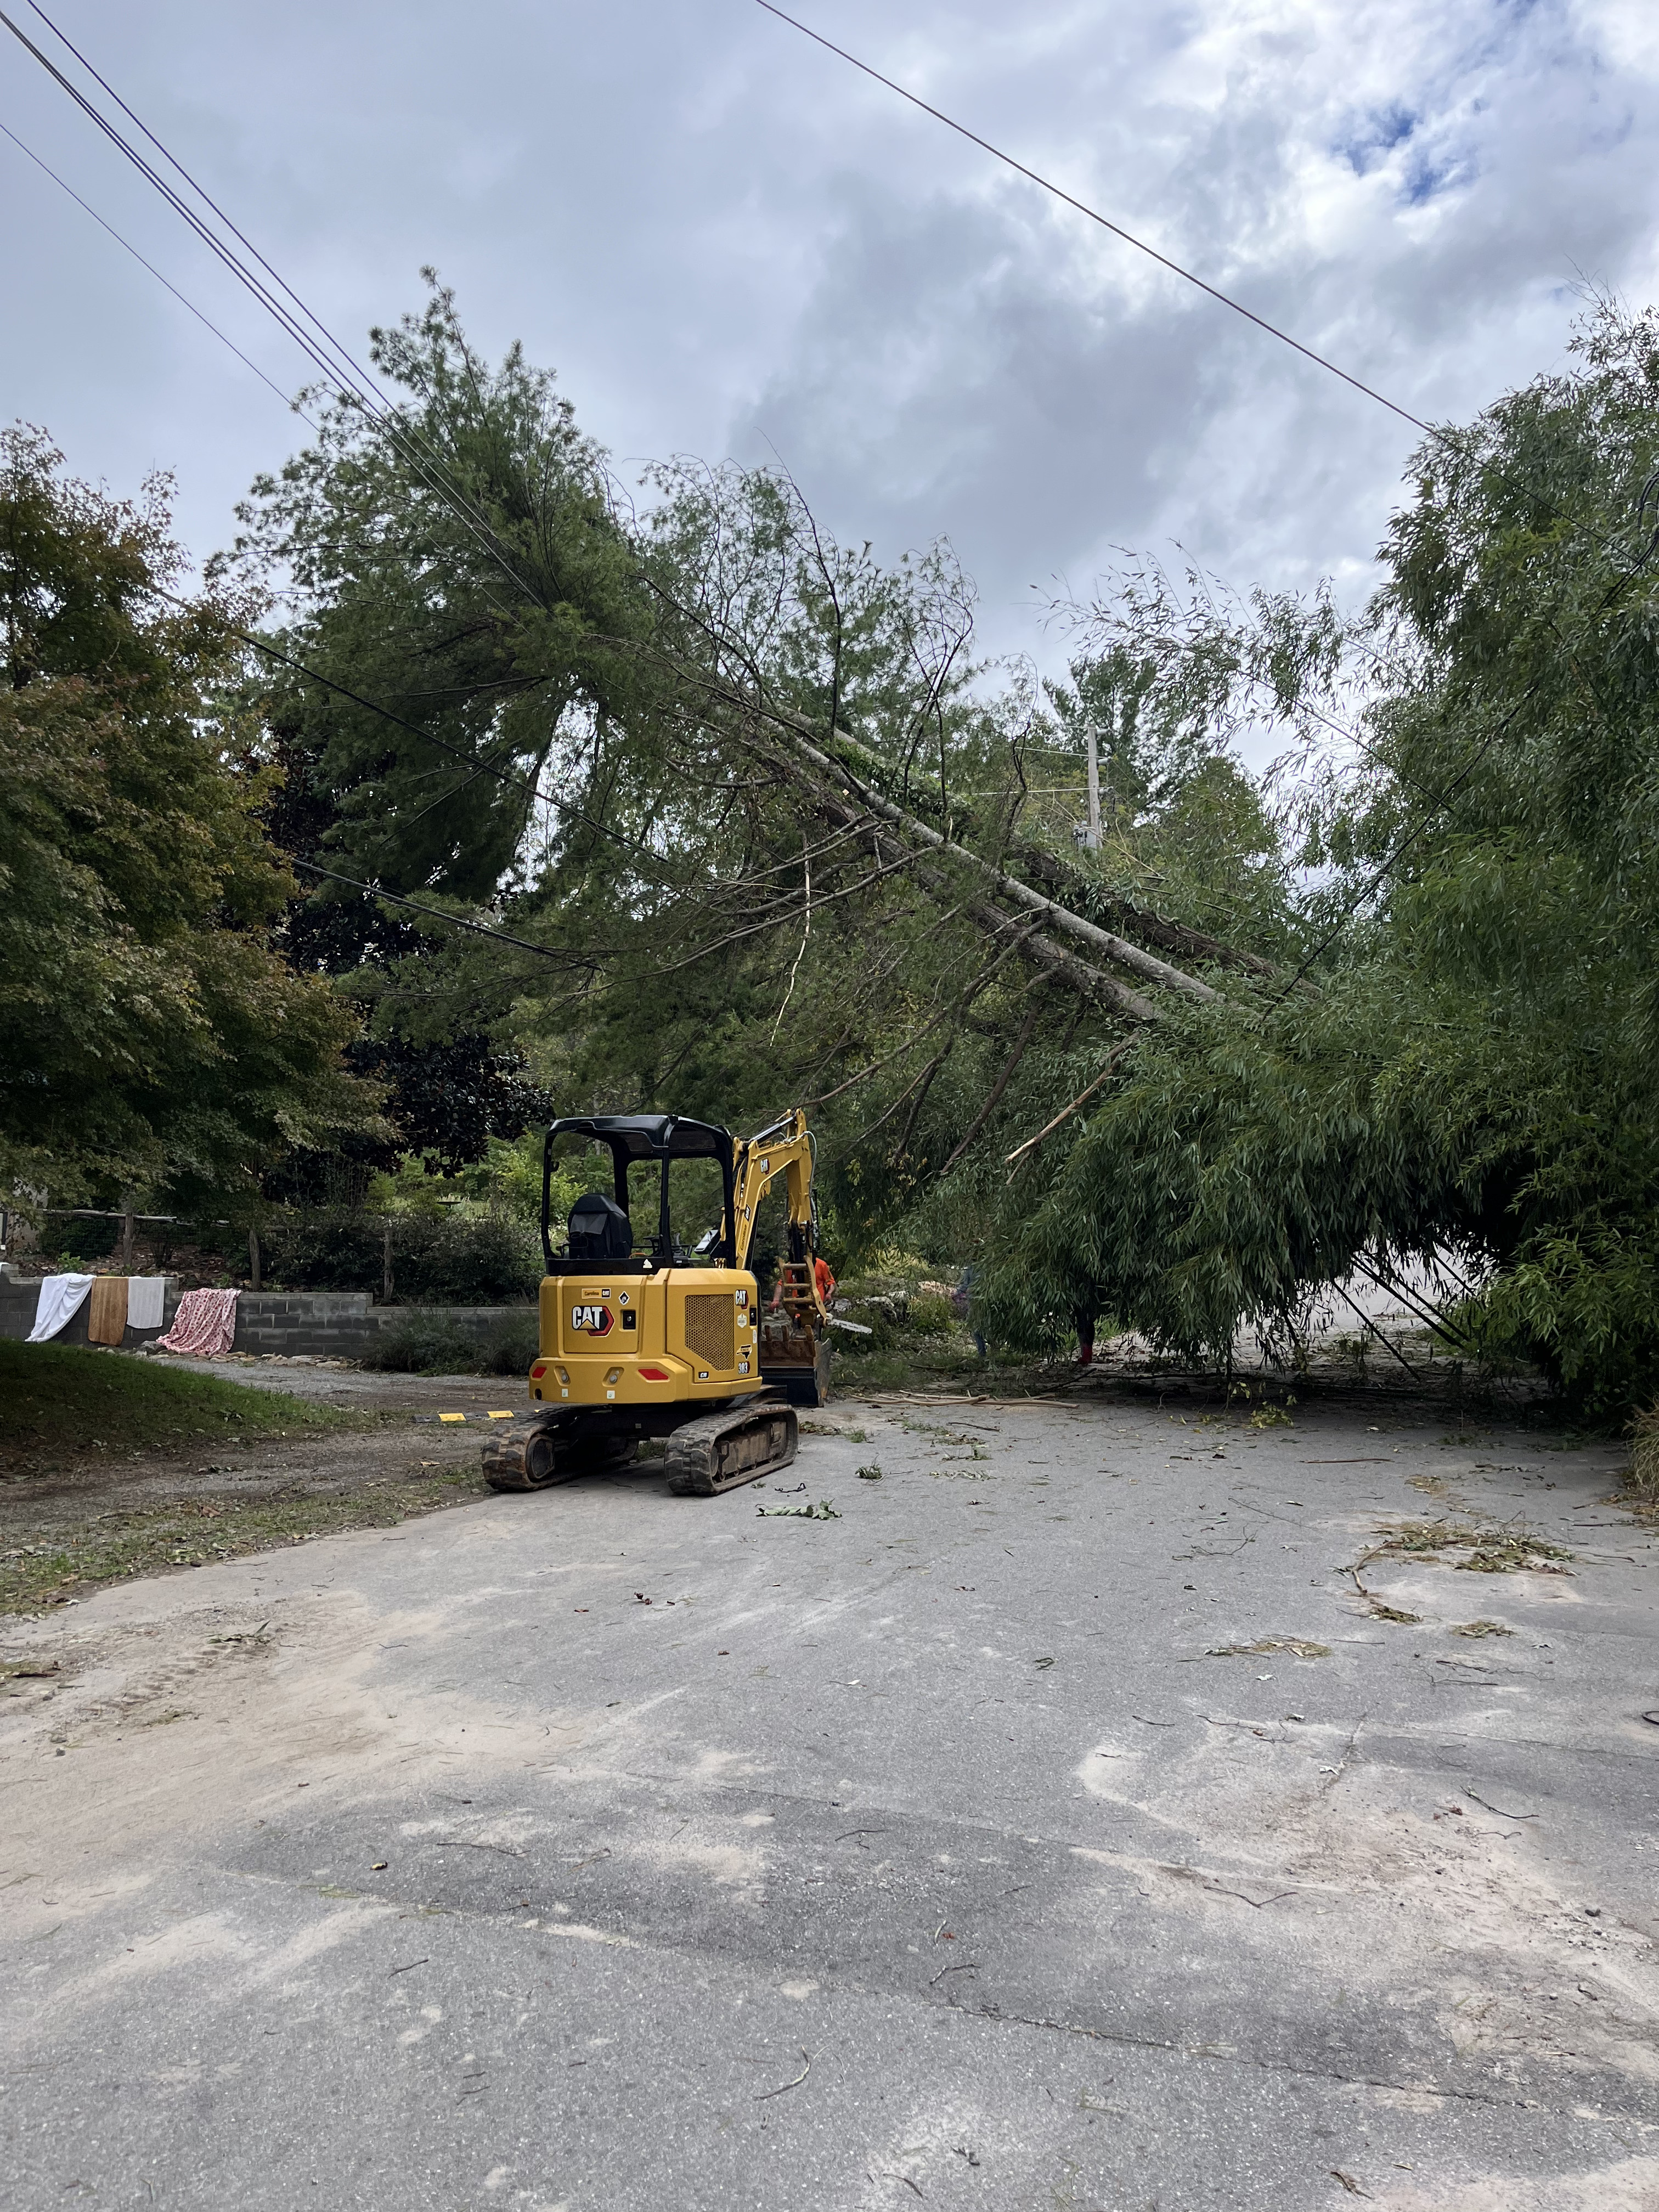
A fallen tree stretches across an Asheville home after Hurricane Helene, highlighting the storm’s destructive force.
-
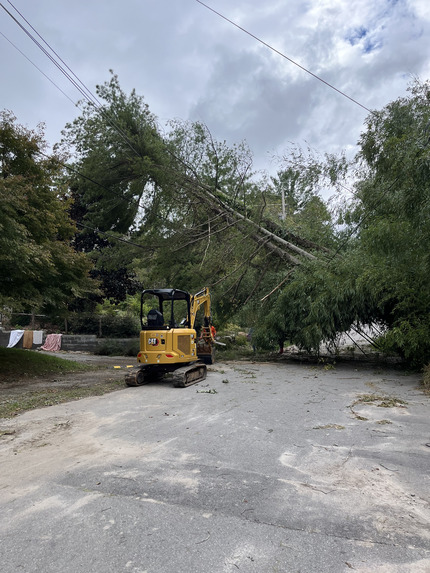
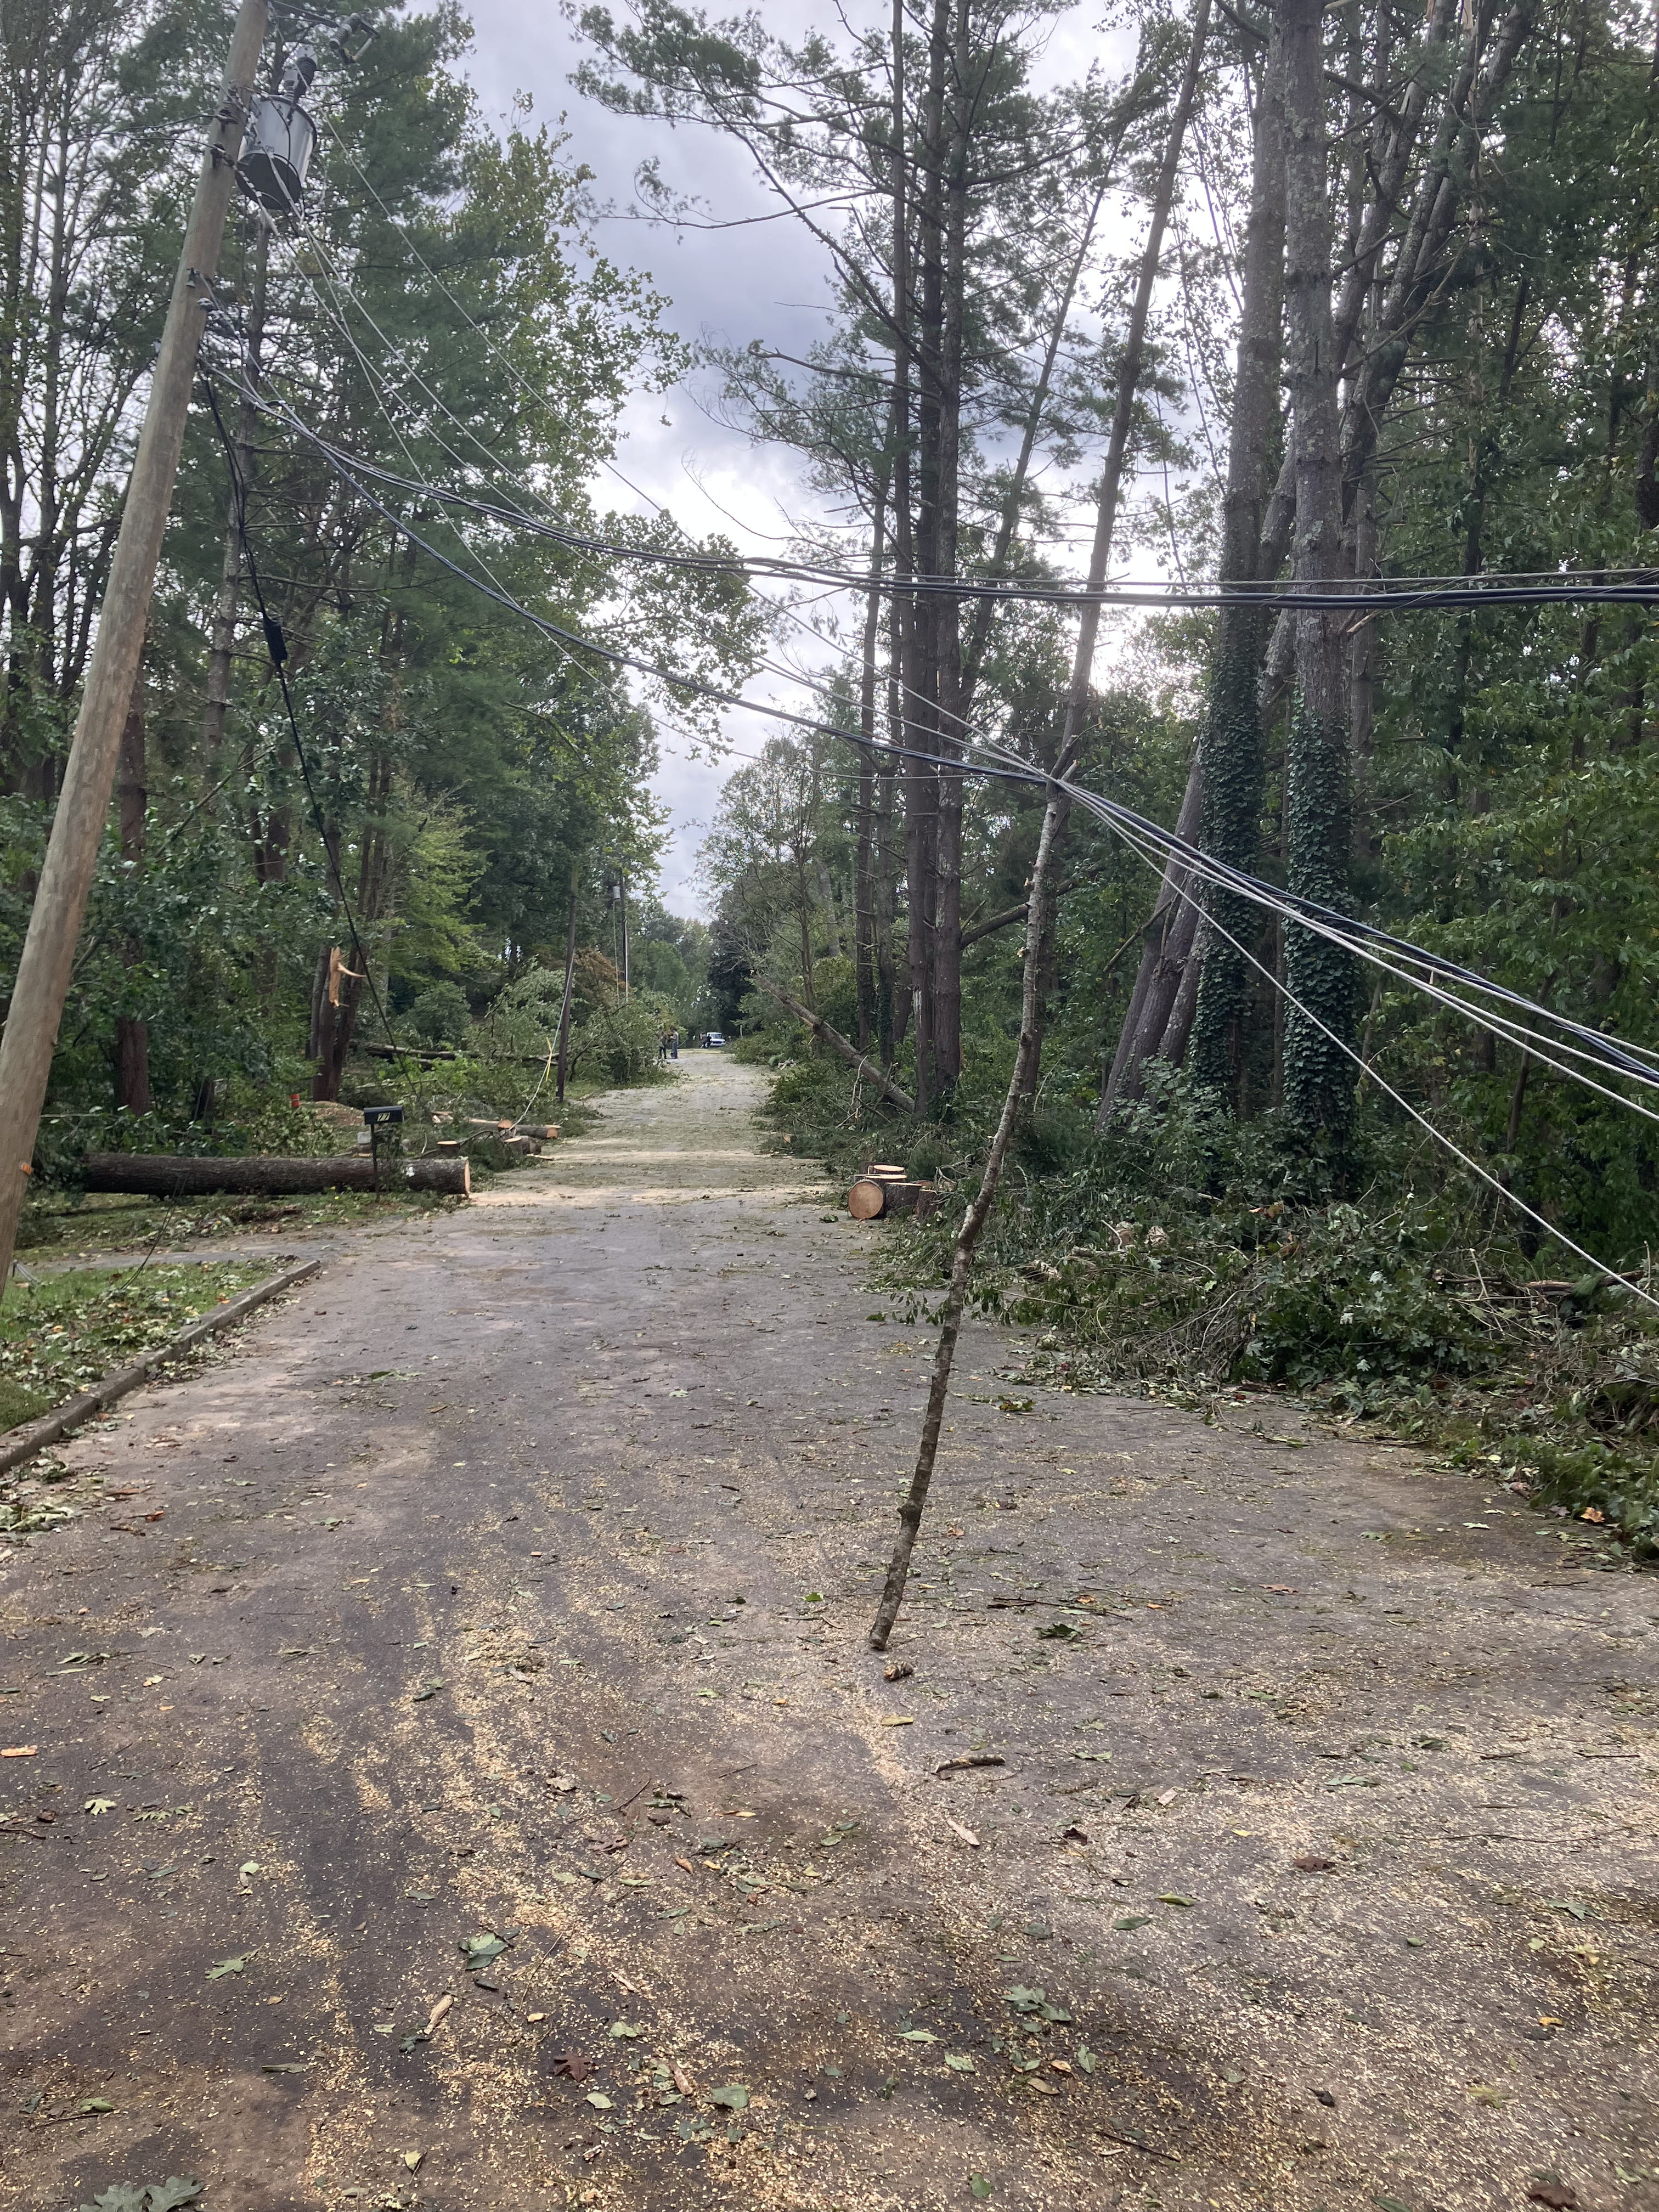
After Hurricane Helene, an Asheville street is blocked by fallen trees, debris, and damaged power lines.
-
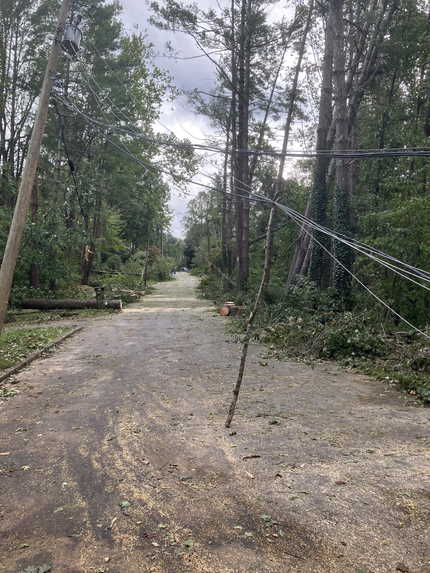
A stick was used as a makeshift power line pole as Asheville residents began recovering from Hurricane Helene.
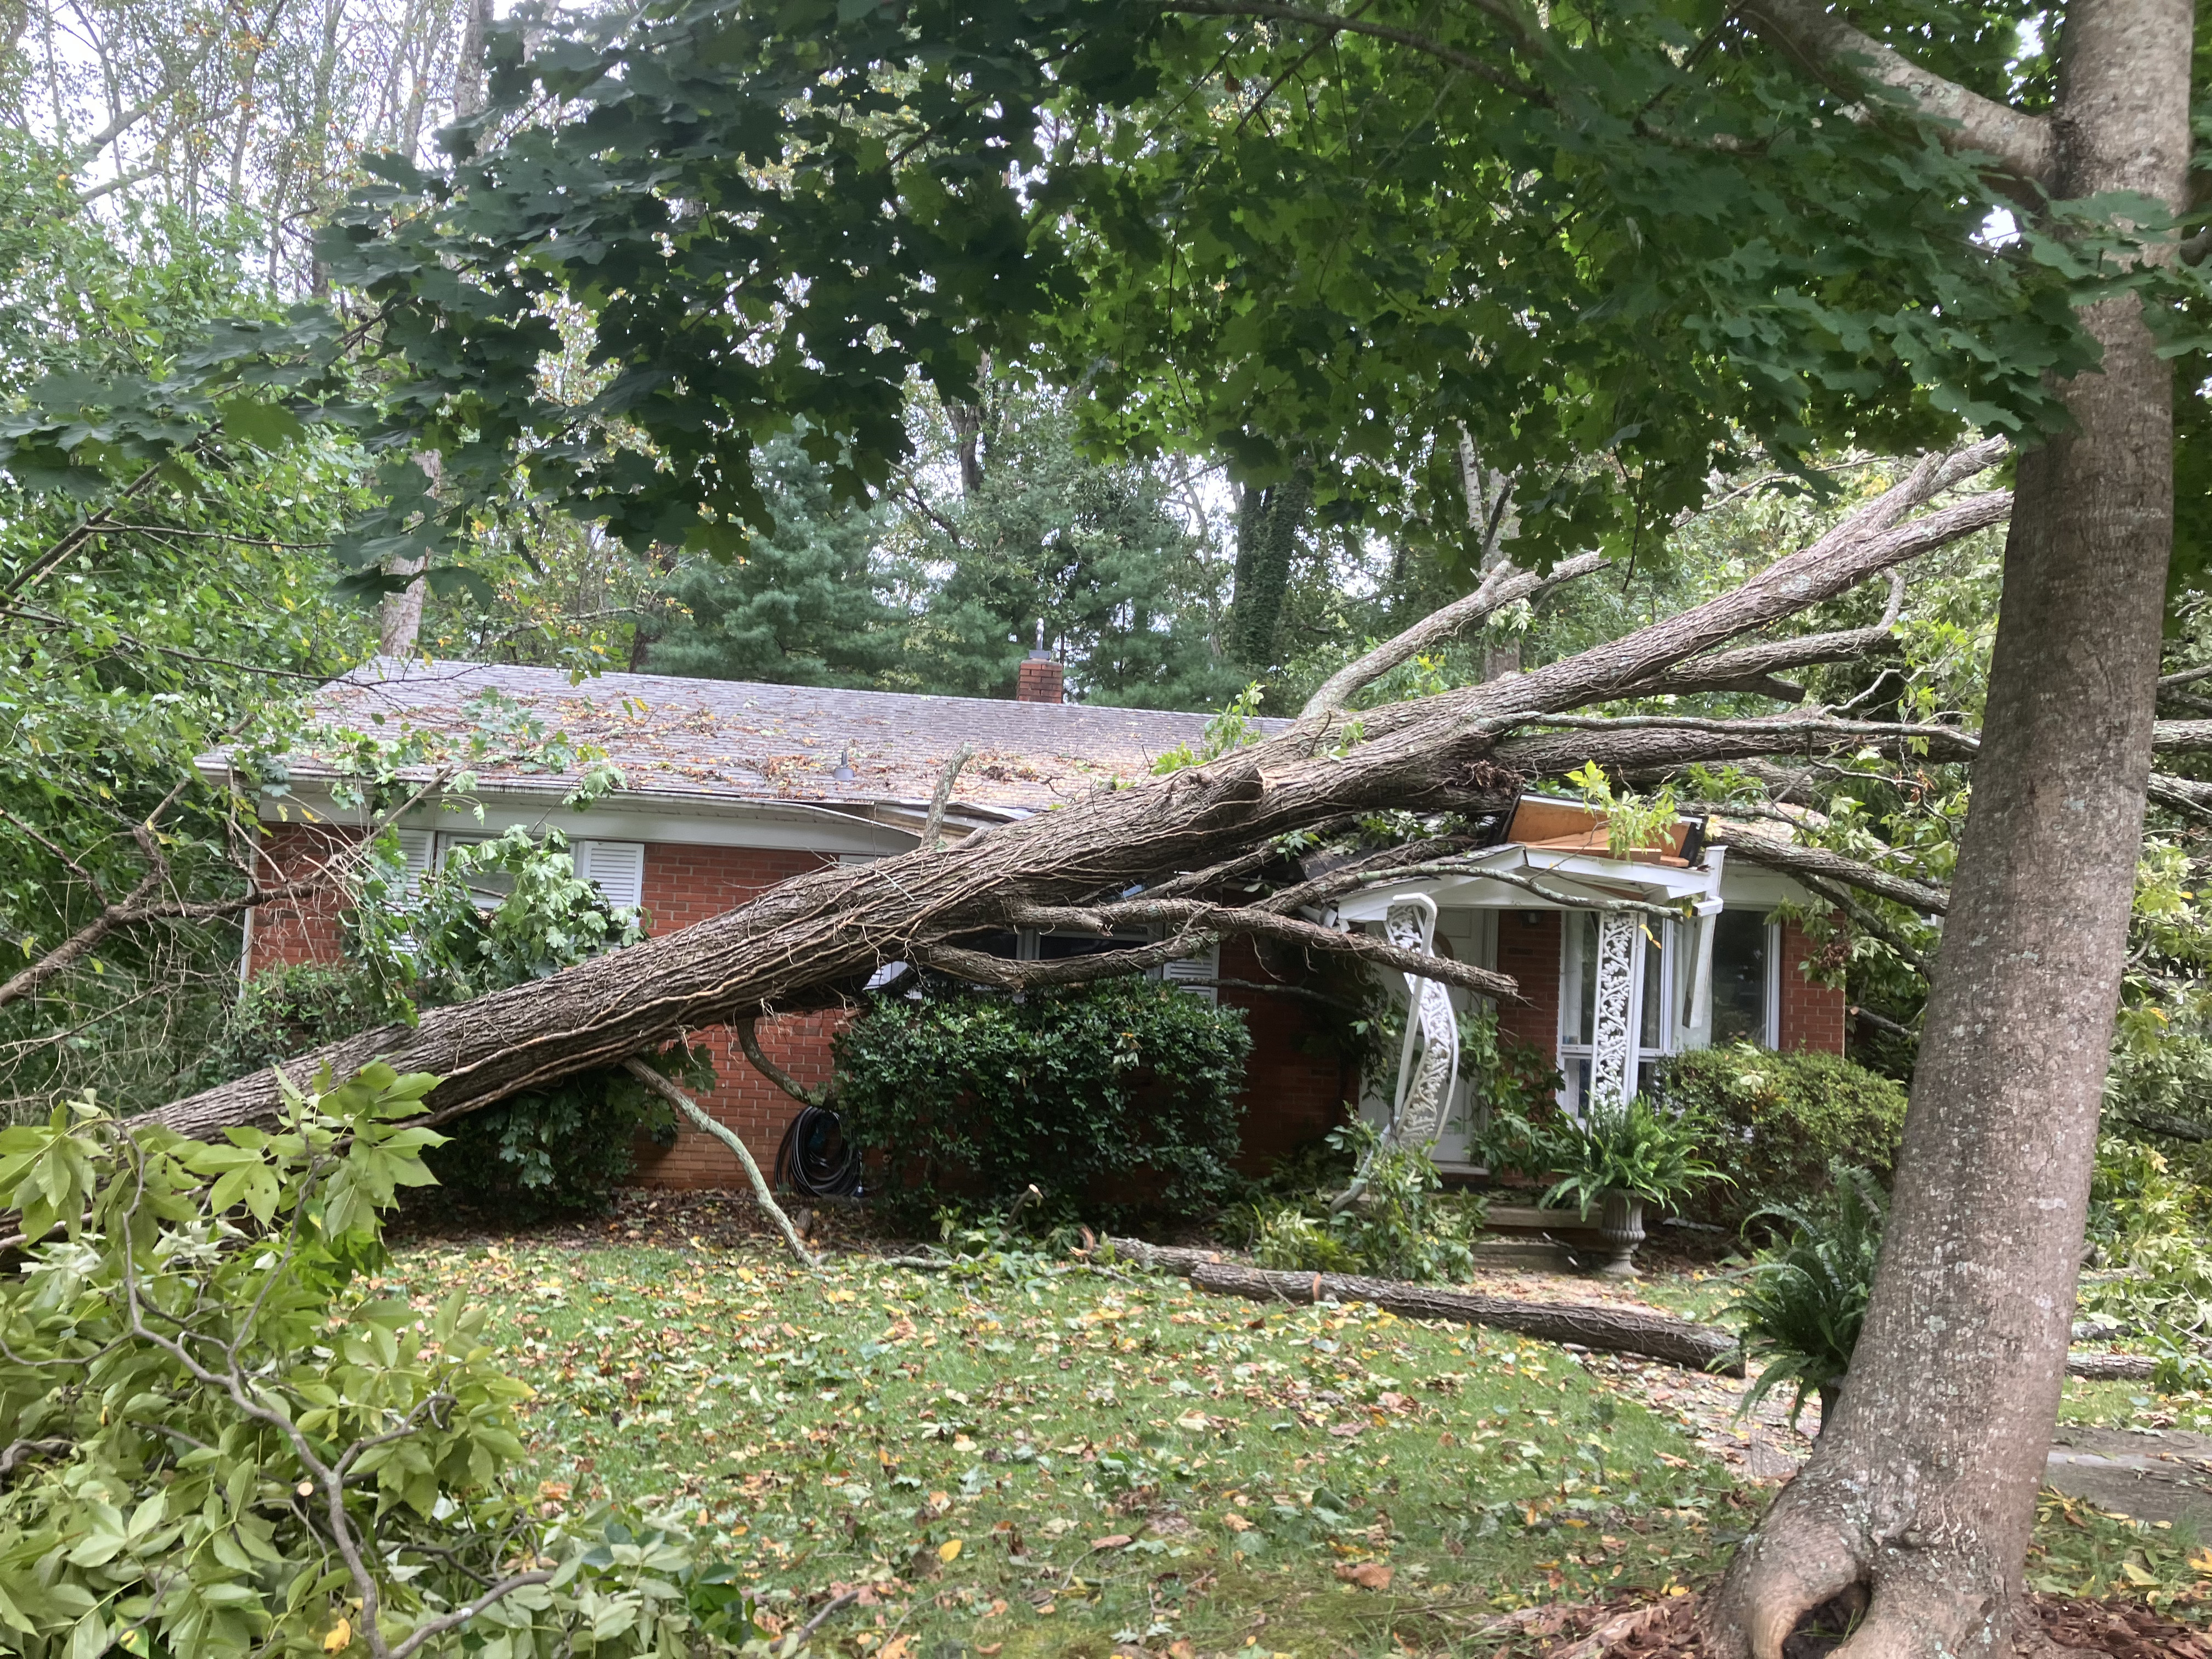
Inspiration
In late September 2024, the remnants of Hurricane Helene stalled over the Blue Ridge. In the 11 Western North Carolina counties we studied, NOAA recorded 75 deaths and $1.7 billion in damage in a single week. That week accounts for 85% of all storm deaths and 88% of all reported damage in those counties from 2016 to 2026. In the mountains, one rare storm can outweigh a decade of ordinary weather.
We interviewed two friends who were students at Asheville High School during Helene. They described two weeks without power or water, more than a month out of school, roads that stayed blocked too long, and looking down on Biltmore Village to see only the tops of buildings above the Swannanoa River. One of them told us: "If there's further warning... we definitely could have prepared."
That became our question: which storm events become deadly or devastating, and what about the place they hit makes them so?
What it does
Carolina HighGround combines NOAA's record of what happened with public data on terrain, streams, road crossings, development, and social vulnerability. It trains machine-learning models to identify which flood events in North Carolina become high-consequence:
$$ \text{high_consequence} = \mathbb{1}\big[\text{deaths} \ge 1 \ \lor\ \text{damage} > \$200{,}000\big] $$
The \$200,000 cutoff is the 90th percentile of positive damage, computed from training years only so no future information leaks into the label. These events are rare: 7.4% of flood-related events, and 3.6% of all storm events.
We also built an interactive risk explorer. It maps historical events, shows a structural risk surface, and lets users test storm scenarios (for example, a mountain flash flood or a Helene-like extreme) to see how predicted risk changes.
How we built it
1. Clean storm records. We processed 33 NOAA Storm Events files into 15,889 North Carolina events (2016–2026). NOAA's three linked tables can't be naively joined: one event can have up to 150 fatality rows, which would multiply its deaths and damage. We collapsed each table to one row per event using max(), never sum(), and validated that the result has exactly one row per event.
2. Every event placed. NOAA records events by county or by forecast zone ("Burke Mountains," "Hatteras Island"). Our rule-based matcher assigned every record to a region, with zero unmatched.
3. Landscape and community context around each event, all in one coordinate system (NC State Plane, EPSG:32119):
| Group | Source | Features |
|---|---|---|
| Terrain | USGS 3DEP DEM | slope, elevation, local relief within 5 km |
| Water | USGS NHD High Resolution | distance to nearest stream |
| Development | USGS Annual NLCD | % impervious surface within 250 m |
| People | FEMA National Risk Index | county social vulnerability (SOVI), population density |
| History | NOAA (past events only) | earlier minor and severe floods within 25 km in the prior 3 years |
| Season | NOAA | month, peak-hurricane-season flag (Aug–Oct) |
We also built NCDOT bridge/culvert, HUC-12 watershed, and SSURGO soil features for the data package.
4. Models. We trained logistic regression, random forest, and histogram gradient boosting on 1,957 flood events from 2016–2023. The recipe used class weighting for rare positives, cross-validation folds grouped by storm episode (so one storm never appears in both training and testing), imputation fit inside each fold, and Platt calibration fit on out-of-fold predictions. We then tested once on 697 events from 2024–2026, which include Helene. The pipeline is R for data and Python (scikit-learn, SHAP) for models, combined in a single Quarto report via reticulate.
Results
Because high-consequence events are rare, we judge models by PR-AUC, not accuracy. A model can post a strong ROC-AUC while still missing the few events that matter. A no-skill model's PR-AUC equals the positive rate (0.078).
| Model | CV PR-AUC | CV ROC-AUC | Lift over chance | Holdout PR-AUC (2024–26) |
|---|---|---|---|---|
| Logistic regression | 0.200 ± 0.061 | 0.731 | 2.6× | 0.339 |
| Random forest | 0.221 ± 0.089 | 0.740 | 2.8× | 0.175 |
| Gradient boosting | 0.211 ± 0.082 | 0.712 | 2.7× | 0.204 |
The random forest ranks high-consequence events about 2.8× better than chance in repeated grouped cross-validation. On the pre-registered 2024–2026 holdout, dominated by Helene, the simpler logistic regression generalized best: PR-AUC 0.339, ROC-AUC 0.808, against a 6.7% base rate. That holdout is small, so we treat it as illustrative.
What drives risk (SHAP):
- Season dominates, consistent with Helene; peak hurricane season raises risk.
- Steep slopes and deep local relief raise risk; paved areas lower it. Urban flood reports tend to be nuisance flooding, while the deadliest events strike rural, steep terrain.
- Social vulnerability and population density raise predicted risk, so the same storm is more dangerous for some communities than others.
- Flood history cuts both ways. Earlier minor floods nearby are associated with lower risk, possibly reflecting local preparedness. Earlier severe floods are associated with higher risk.
Challenges we ran into
- Hidden double-counting in NOAA's linked tables, caught by checking rows per event at every step.
- Four coordinate systems, plus NHD's 3D-measured geometries that crash GEOS until the Z/M dimensions are dropped.
- Missing is not zero. 27% of events have no coordinates. We never filled them with zeros or fake centroids. Fortunately, 97.6% of flood events do have coordinates.
- Very few positives. Only ~153 high-consequence events in training, so results vary widely across folds.
- A calibration bug. Fitting Platt scaling on the random forest's in-bag predictions made it badly underconfident (mean predicted risk 2.5% vs. an observed 6.7%). Refitting on out-of-fold predictions fixed it.
- A dead feature and a mountain inversion. An early hurricane flag was never used by any tree, and in 82% of mountain grid cells the model rated a hurricane scenario as less risky than a typical storm. Adding a peak-season feature improved PR-AUC (0.208 → 0.220) but didn't fully fix the inversion. That's a real limit of learning from ~150 severe examples, and one reason we value the logistic model, which can't invert this way.
- R and Python in one document. The two OpenMP runtimes crashed gradient boosting until we forced single-threaded execution.
What we learned
- Most of data science is making sure you count the right thing, exactly once.
- For rare, catastrophic outcomes, PR-AUC and calibration matter more than accuracy or ROC-AUC.
- Leakage hides everywhere: in thresholds, in cross-validation folds, and in data layers that postdate the events.
- A more complex model isn't automatically better. The simplest one held up best on the storm we cared most about.
- Behind "75 deaths" are weeks without water, lost school, and blocked roads. Better warning is what residents told us they needed.
Limitations
This is not a flood forecast. Without rainfall data, the models describe how severe impacts are likely to be given a flood event, not whether a storm will flood. Features are measured at points and buffers, not upstream drainage areas. Vulnerability is county-level. Imperviousness (2023) and the infrastructure layers postdate most events.
What's next
- Add rainfall (NOAA Stage IV / gridMET) so the model can inform real-time warnings.
- Trace where the water goes using upstream catchments (NHDPlus HR) and height above nearest drainage (HAND).
- Use tract-level vulnerability to target help more precisely.
- Co-design with users. Validate with county emergency managers, NCDOT crews, and volunteer fire and rescue, and turn the explorer into a decision-support tool.
- Keep responsible-use limits: no insurance pricing or redlining, and human review for every operational decision.
Acknowledgements
We would like to thank the Carolina Data Challenge Team for setting this up and the judges for giving their valuable time and energy. We would also like to note that we used Claude and Claude Code for helping write the code in this project.


Log in or sign up for Devpost to join the conversation.