-
home
-
self-report

Inspiration
This project was inspired by increased COVID-19 cases on campus.
What it does
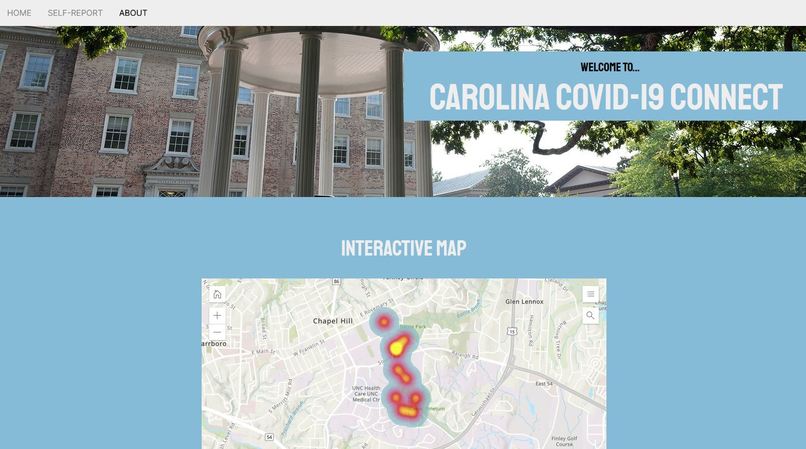
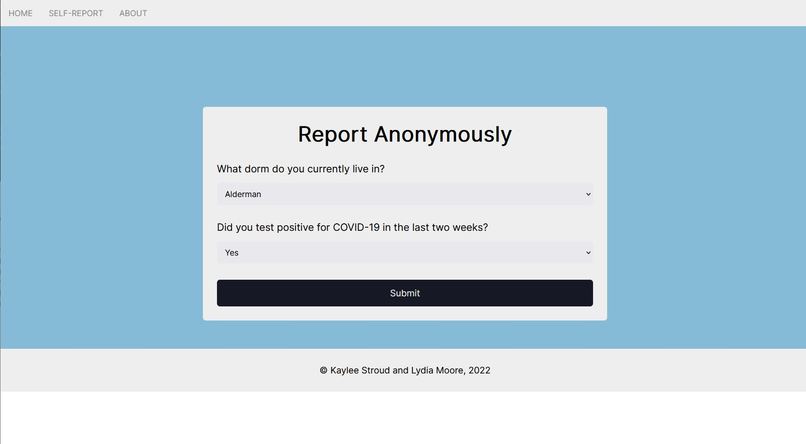
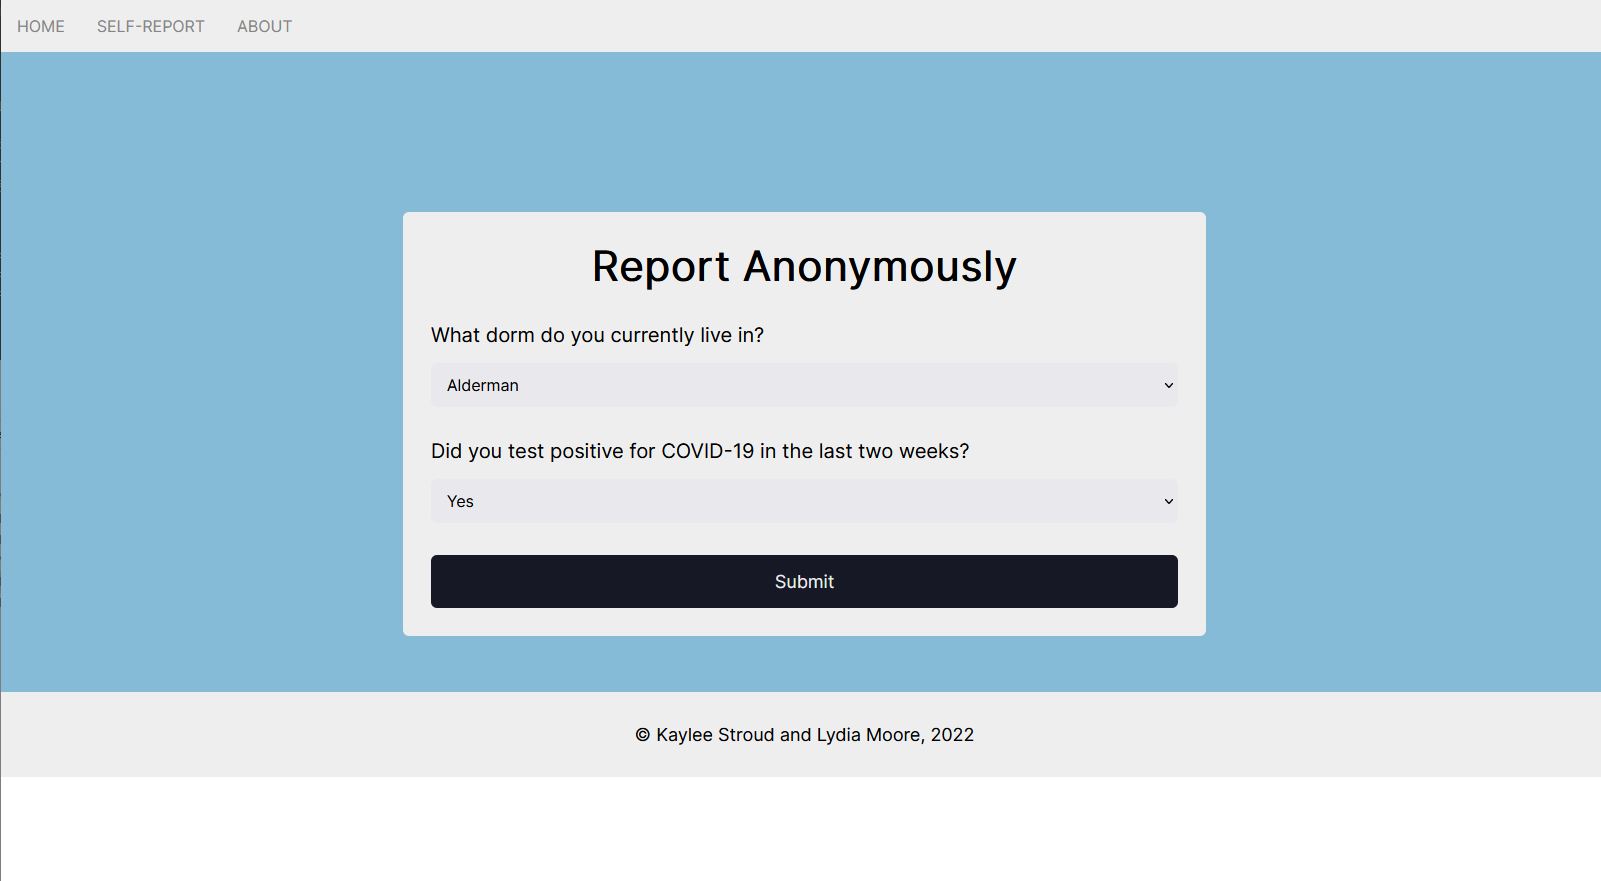
Carolina COVID-19 Connect allows students to anonymously self-report COVID cases, and view them on a map of campus.
How we built it
Our project was built using HTML/CSS grid properties, as well as ArcGIS for the map functionality.
Challenges we ran into
ArcGIS recieves data from a CSV file. At the moment, our backend is not set to receive data. However, it updates live when changes are made on the ArcGIS website.
Accomplishments that we're proud of
We are happy that despite the difficulties we faced while implementing the backend, which ultimately does not save data at the moment, we were able to publish a functional site. The website at the moment is a great representation of how it will look when finished
What we learned
During this project, we learned about using extensions, basic PHP, working with data, and using ArcGIS.
What's next for Carolina COVID-19 Connect
We aim to have a fully-functional backend that allows users to self-report, as well as live updating.

Log in or sign up for Devpost to join the conversation.