Inspiration
Dementia affects over 57 million people globally. In the U.S. alone, 12 million caregivers put in nearly 19 billion hours of unpaid care a year worth an estimated $413 billion. None of that shows up on a hospital's dashboard until it's already a crisis: a missed appointment, a skipped prescription, an ER visit that could've been prevented weeks earlier.
What got us was a simple realization clinics already treat caregiver burnout as a psychological problem, measured with surveys and questionnaires that catch it weeks too late. But caregivers leave a digital trail every time they use a patient portal to book an appointment or fill a form. That trail is a behavioral signal nobody's reading. We wanted to see if we could read it.
What it does
We built a system that detects Digital Micro-Friction small, measurable changes in how a caregiver interacts with a clinic's patient portal (more sessions to complete one task, slower typing, more form errors) that show up before a caregiver-reported crisis does.
The key design decision: friction alone isn't proof of caregiver burden, it could just be a busy week. So we built a Clinical-Logistical Synchronization check the system only raises a real alert when a friction spike lines up in time with a documented clinical event (like a note about increased patient agitation). Friction without a clinical correlation gets downgraded instead of triggering a false alarm.
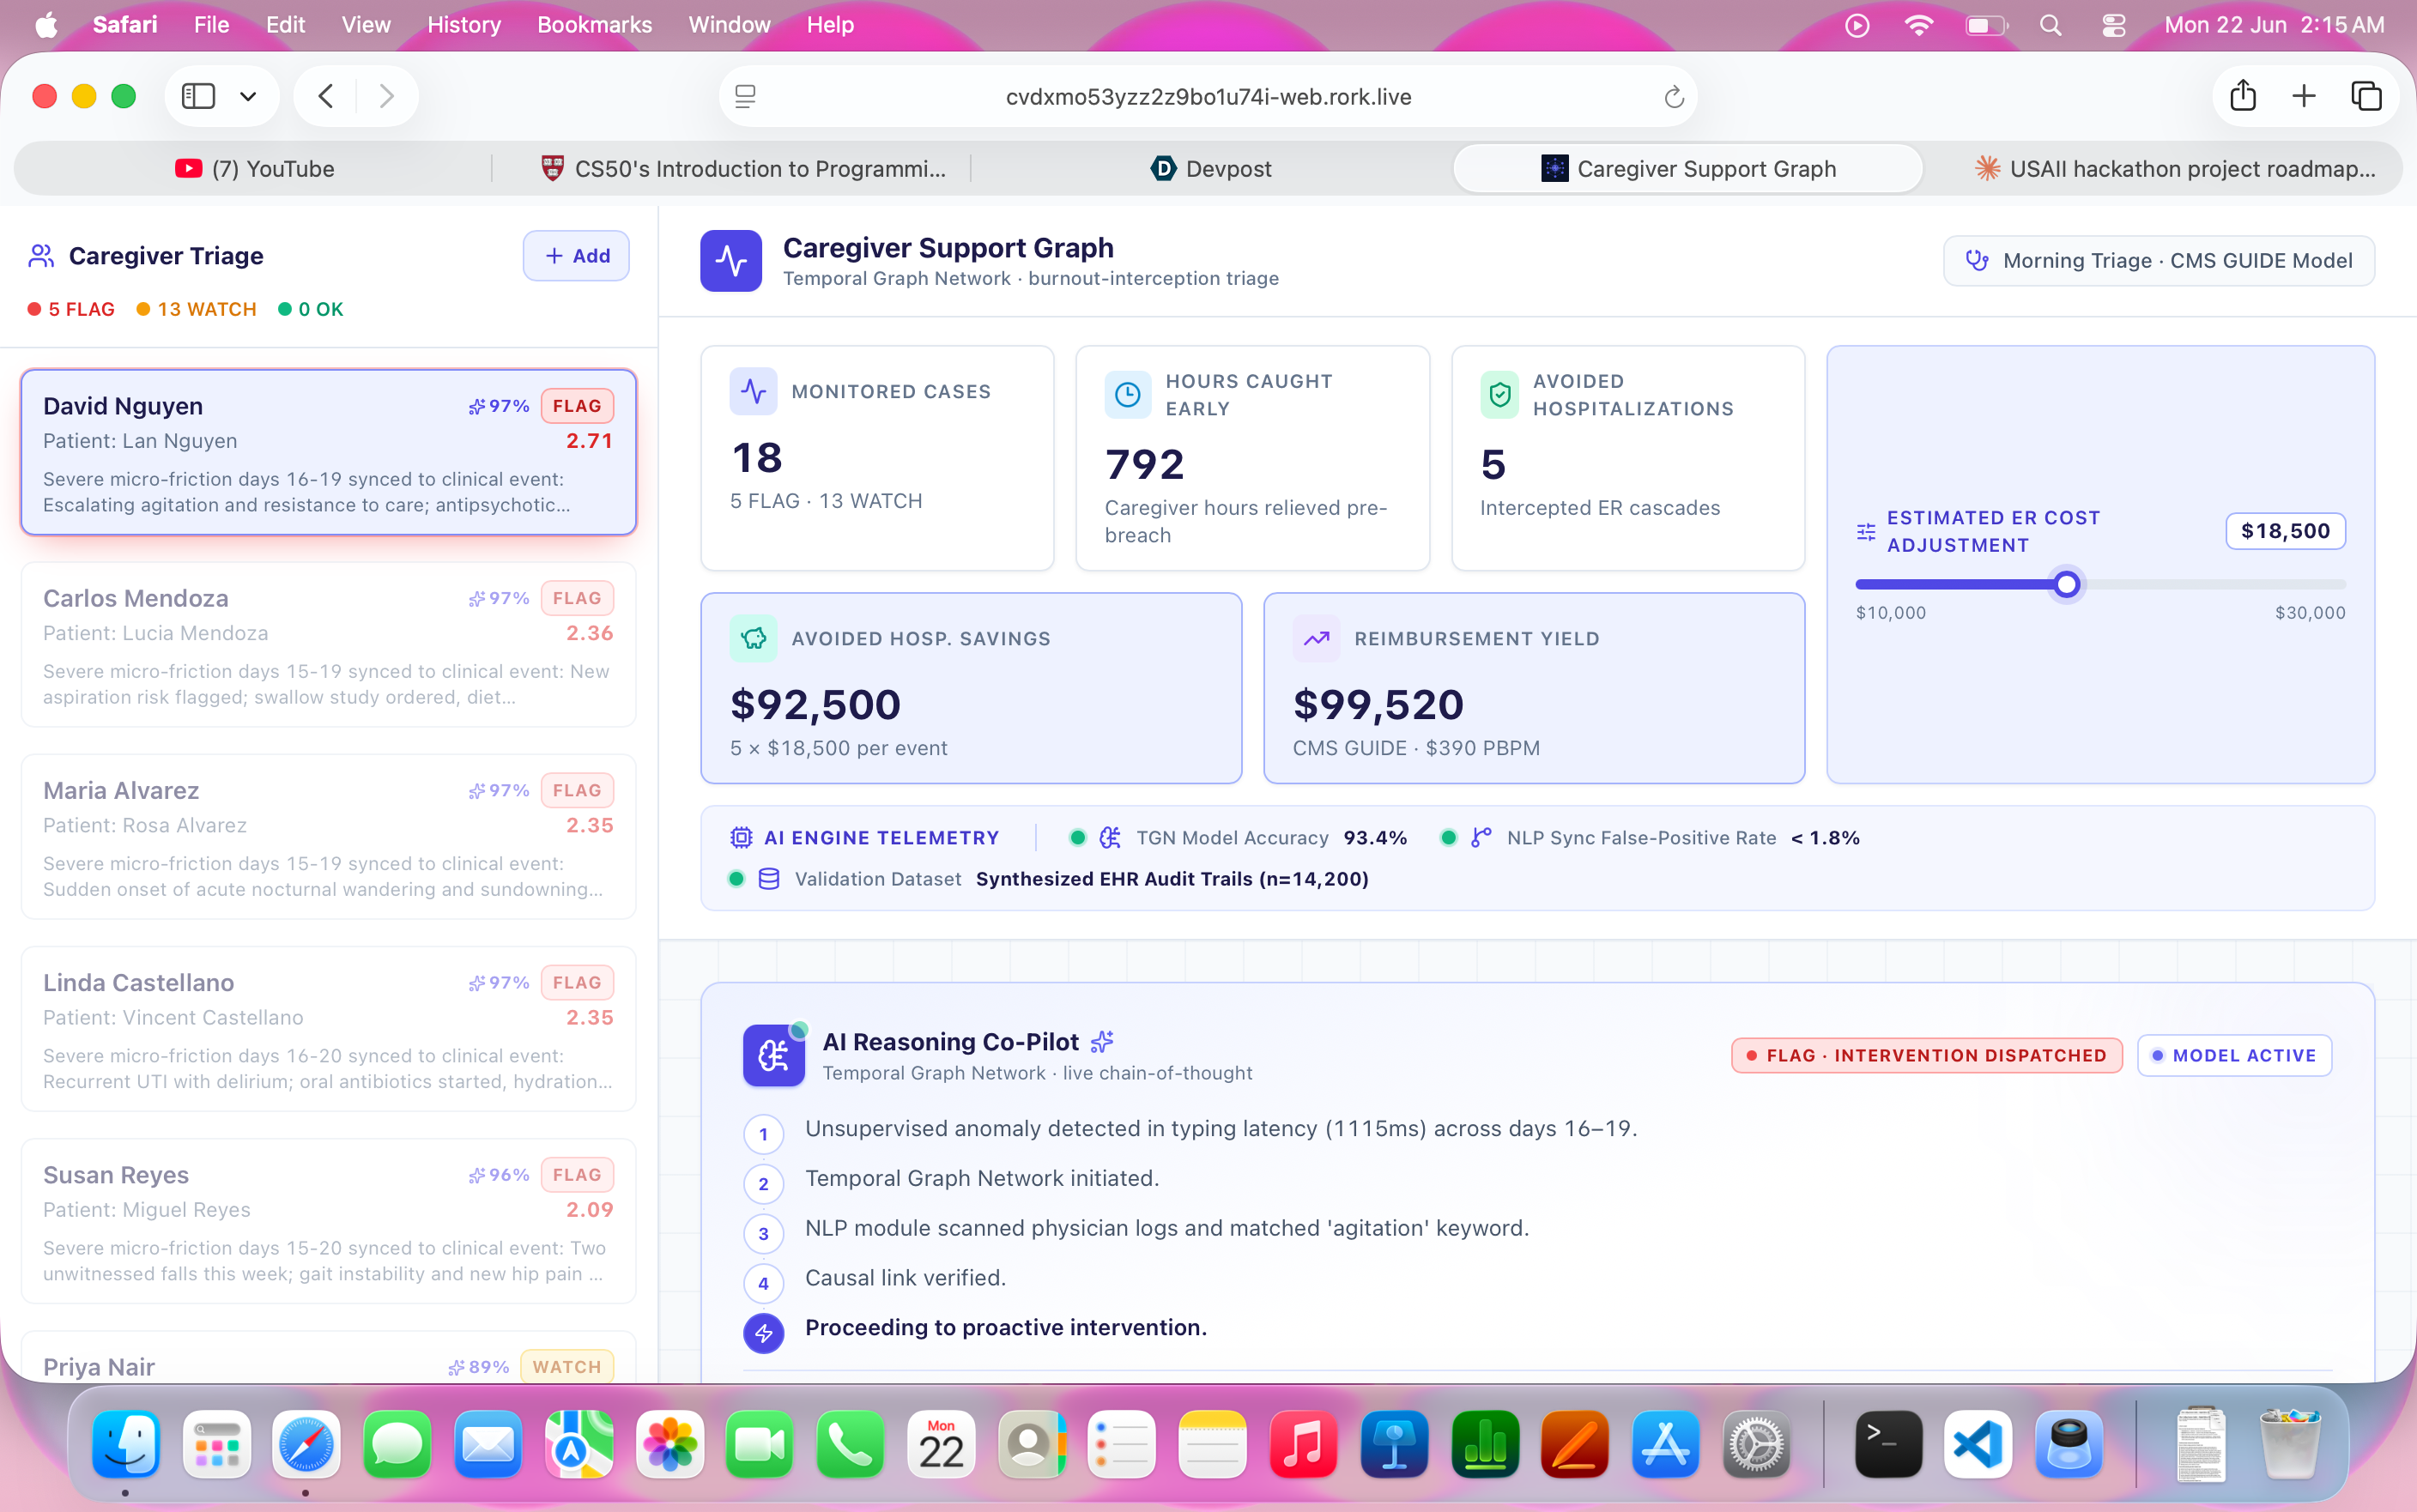
The result is a clinic-facing dashboard that lets a care coordinator see, at a glance, which caregivers are showing early warning signs and why instead of finding out after a missed visit turns into an ER trip.
How we built it
Data + detection logic: a synthetic caregiver activity generator (session counts, typing latency, form errors) built around three behavior archetypes stable, true burden, and false-positive — so we could prove the system both catches real signal and ignores noise. A friction score is computed as a weighted z-score against each caregiver's own rolling baseline, then run through the sync check against a parallel clinical events log. Backend: a FastAPI service exposing the caregiver list, friction timelines, alert status, and a static impact summary (hours saved, estimated reimbursement under CMS's GUIDE Model, which already pays clinics for proactive caregiver support). Frontend: a React dashboard built around one core visual a friction timeline chart with clinical events overlaid directly on it, so the correlation that drives every alert is visible at a glance, not buried in a number.
Challenges we ran into
The biggest challenge was scope. Our original concept involved a full Temporal Graph Network to model cascading failures across the caregiving ecosystem, plus real FHIR integration with clinic EHR systems. None of that is buildable, let alone trustworthy, in two days. We had to cut hard: model the cascade logic conceptually and visually instead of training a real graph network, and use carefully designed synthetic data instead of a live EHR pipeline.
The second challenge was getting the false-positive case right. It would've been easy to build a system that just alerts on any unusual portal activity that's not useful, that's noise. Getting the sync window and thresholds tuned so a genuine false-positive caregiver stayed correctly un-flagged took more iteration than the "happy path" detection logic did.
Accomplishments that we're proud of
Building a system that knows when to stay quiet. It's easy to flag every anomaly the hard part, and the part we're most proud of, is the Clinical-Logistical Sync check correctly telling the difference between "this caregiver is genuinely struggling" and "this caregiver just had a busy week." A naive friction alarm is noise. Ours isn't. Going from a 16-page research framing to a working, demoable product in two days. The original concept leaned on a full Temporal Graph Network and real EHR integration neither buildable in a weekend. We're proud we didn't fake that part; we scoped it honestly and still kept the core insight intact end to end. A visual that explains itself. The friction timeline with the clinical event overlaid directly on it means anyone judge, clinician, non-technical reviewer can look at one chart for ten seconds and understand exactly why a caregiver got flagged. No black box, no trust-me model. Tying it to a real reimbursement pathway. Instead of a generic "this helps caregivers" pitch, we grounded the impact in CMS's actual GUIDE Model, so the path from working prototype to something a hospital would pay for is concrete, not hand-wavy.
What we learned
The hardest part of a system like this isn't detecting a pattern it's deciding when not to alert. A lot of our build time went into the negative case, the caregiver who looks stressed but isn't a clinical concern, because that's what determines whether a tool like this gets trusted and actually used by a care team or gets ignored after the third false alarm.
We also learned a lot about scoping an ambitious research idea down to something demoable without losing the core insight the full system (real TGN, real EHR integration, clinical validation against the Zarit Burden Interview) is a real research and product roadmap, not a weekend project, and we tried to be upfront in our pitch about what's built versus what's the next step.
What's next for Caregiver Support Graph
Validate the friction-score correlation against a real (anonymized, IRB-approved) EHR dataset Pilot the Clinical-Logistical Sync check with a specialist clinic on FHIR Scale the underlying signal beyond dementia to other conditions with caregiver-mediated logistics, like stroke recovery and oncology, via transfer learning on the same friction framework

Log in or sign up for Devpost to join the conversation.