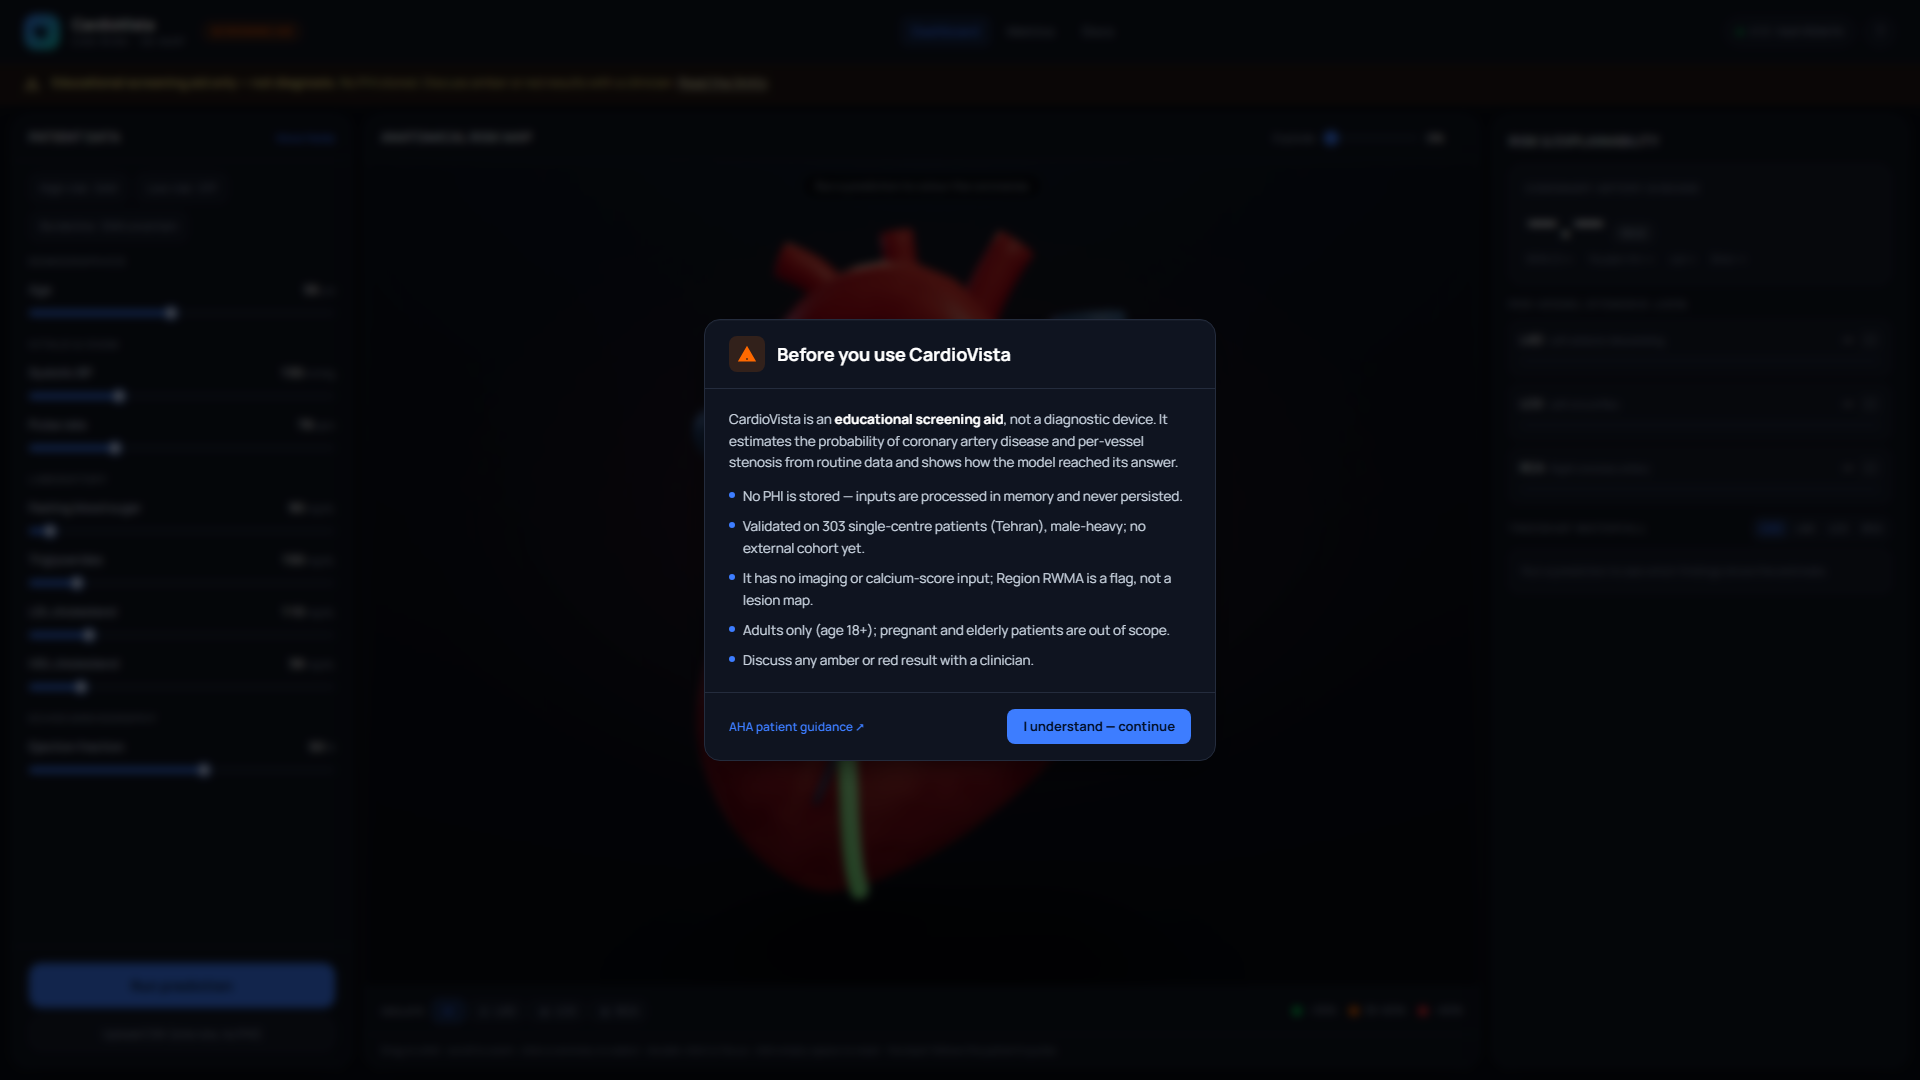
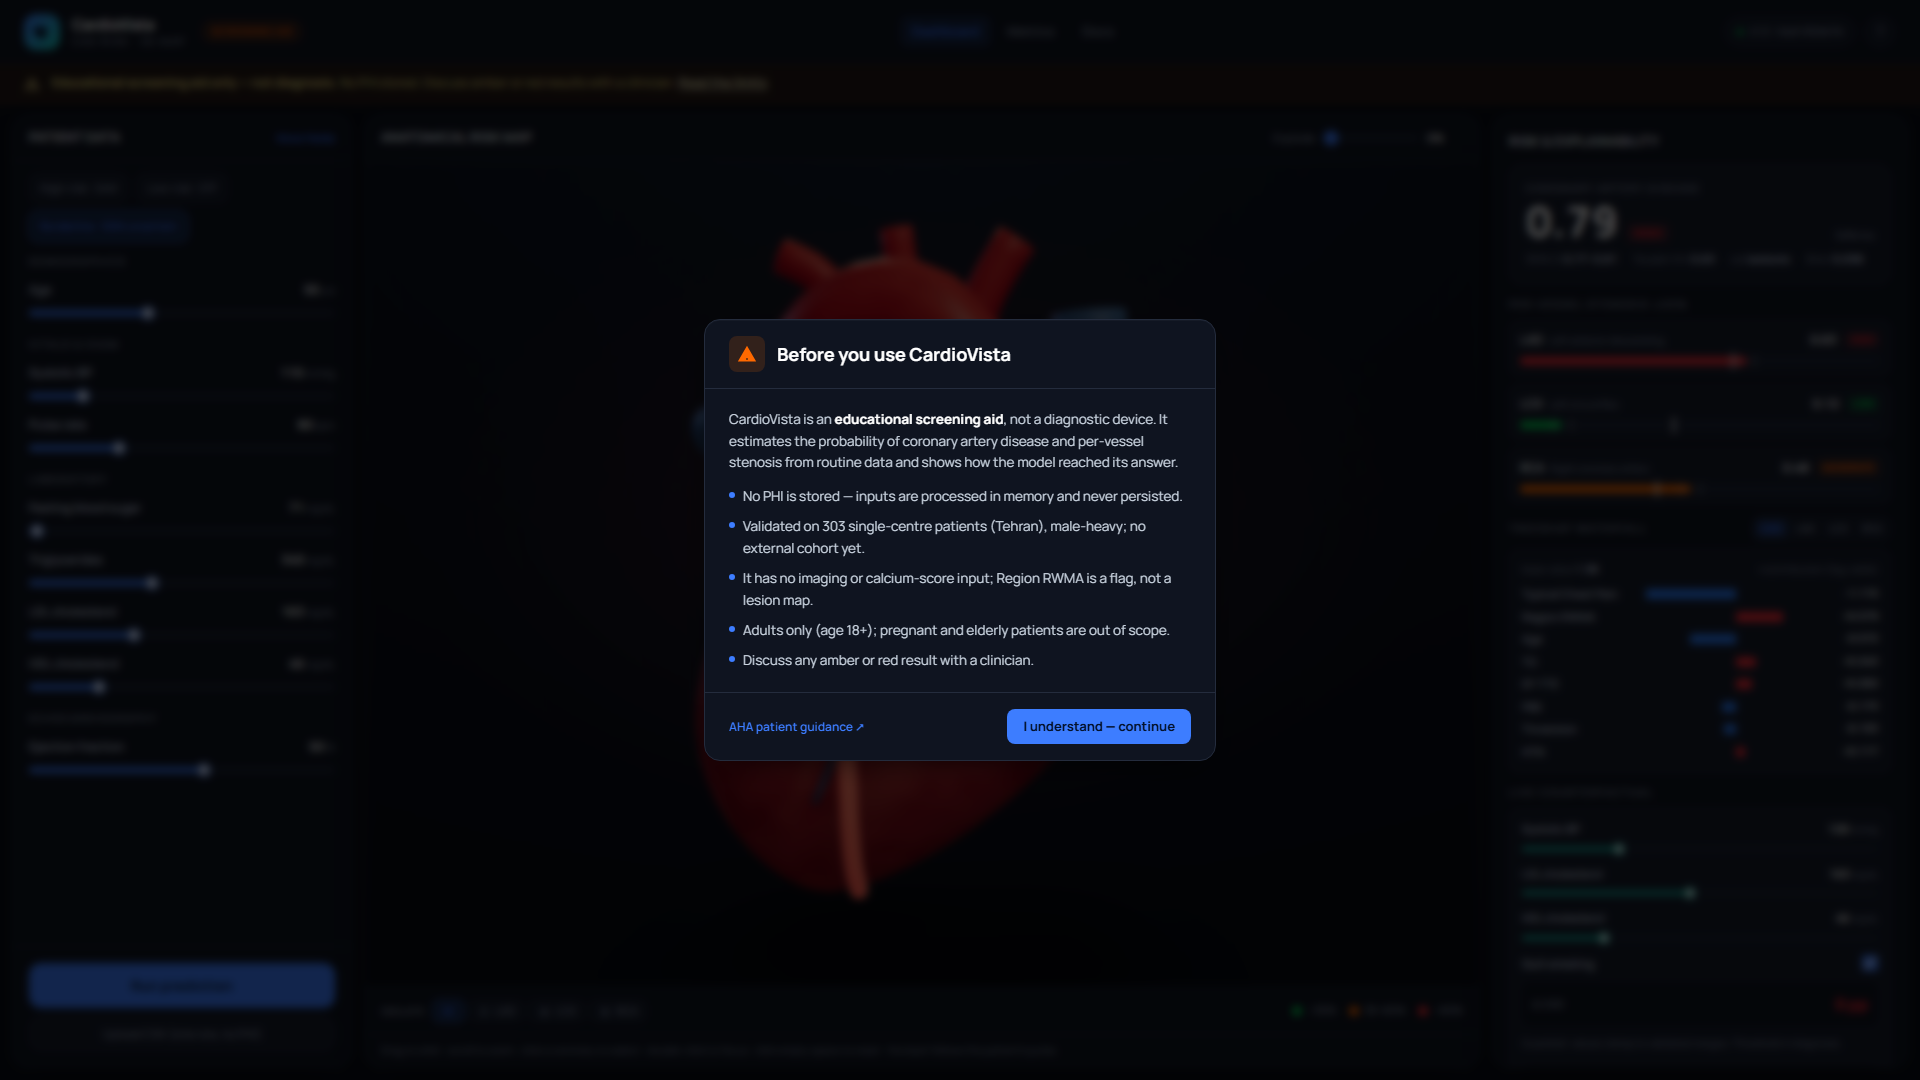
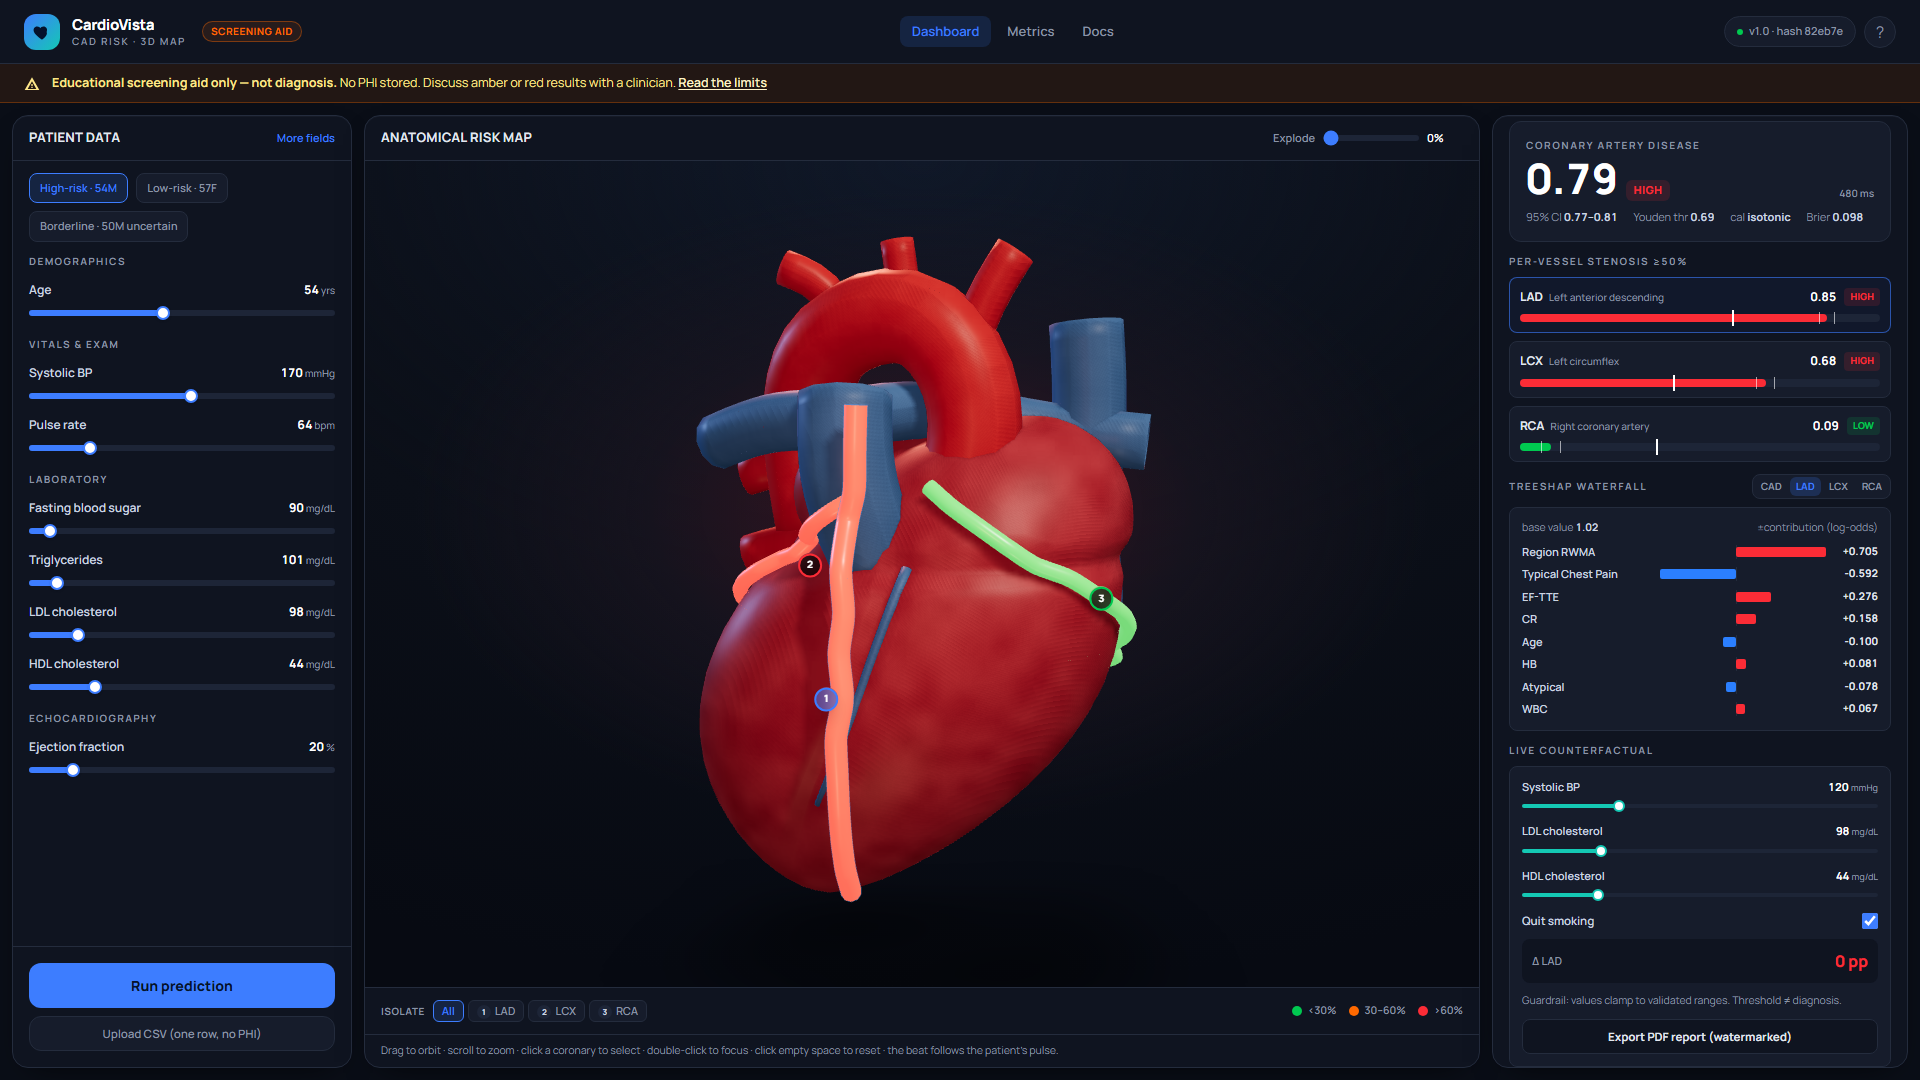
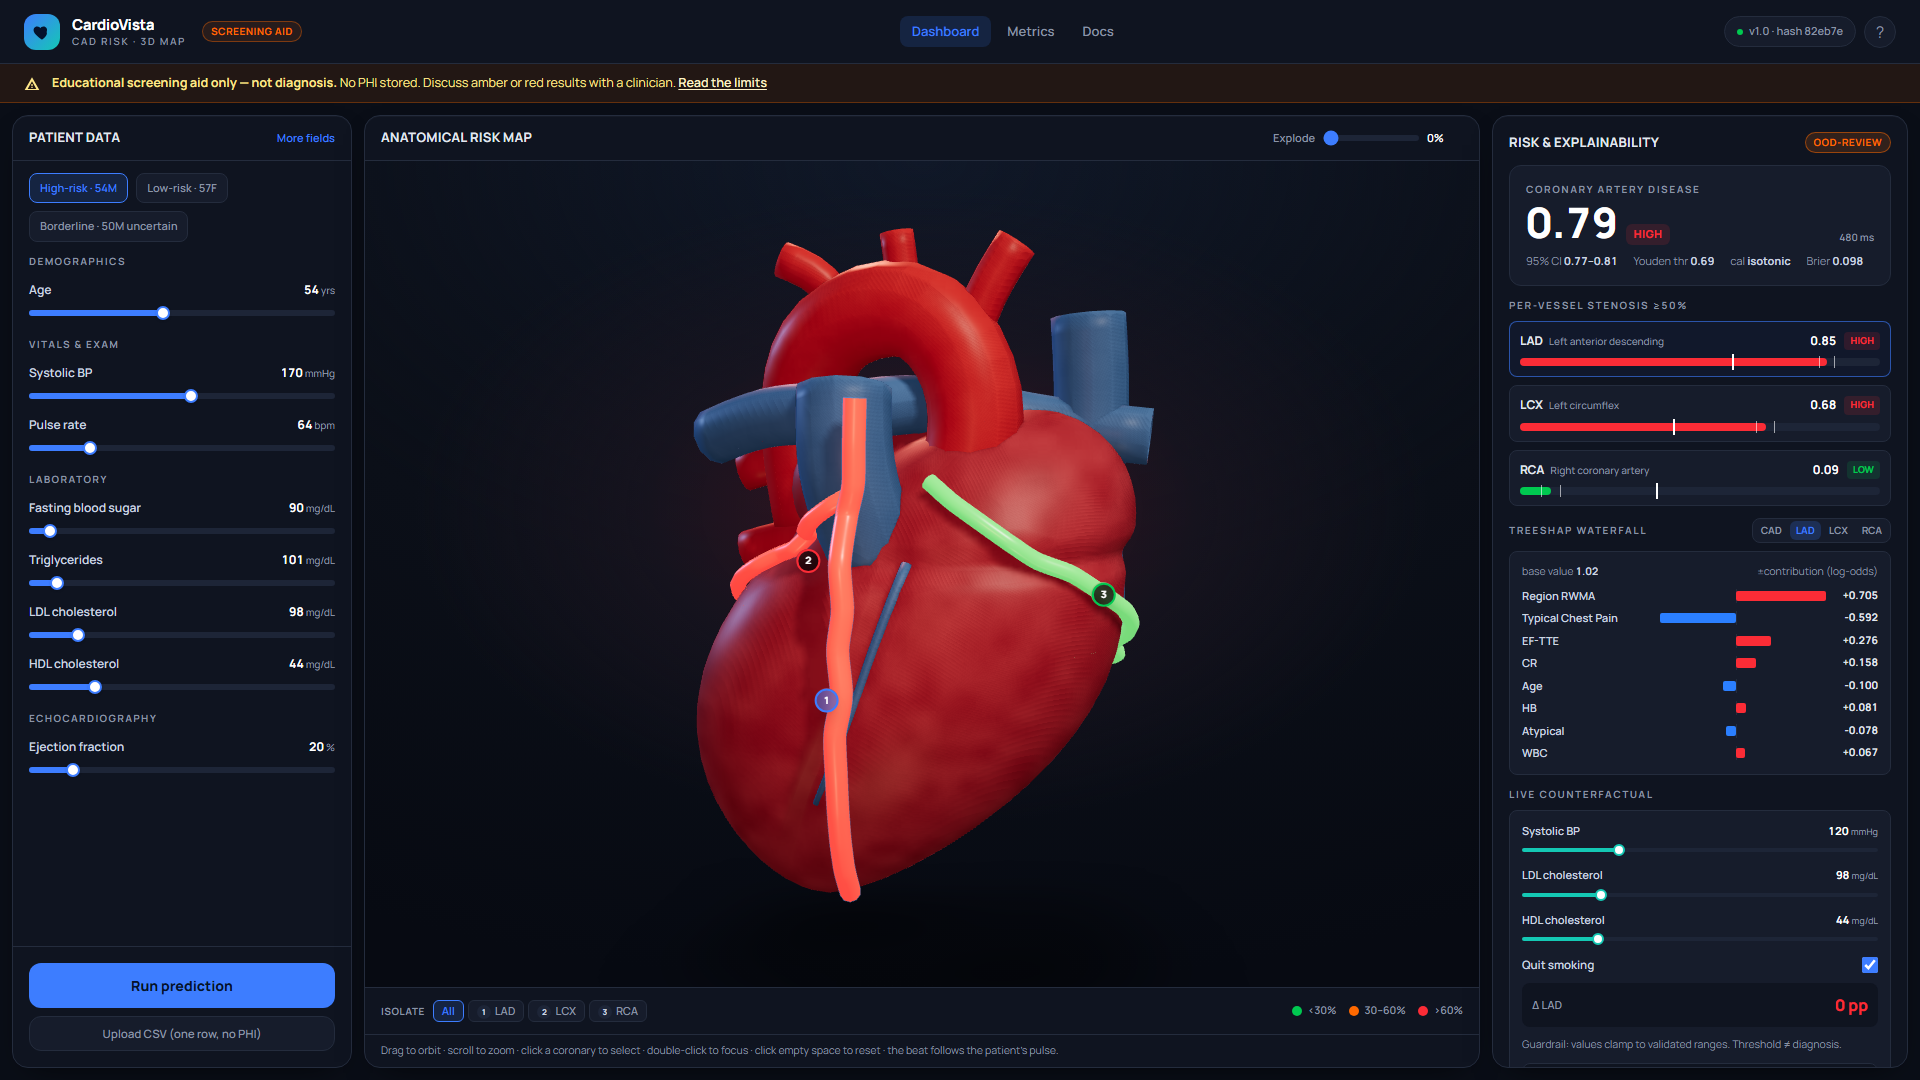
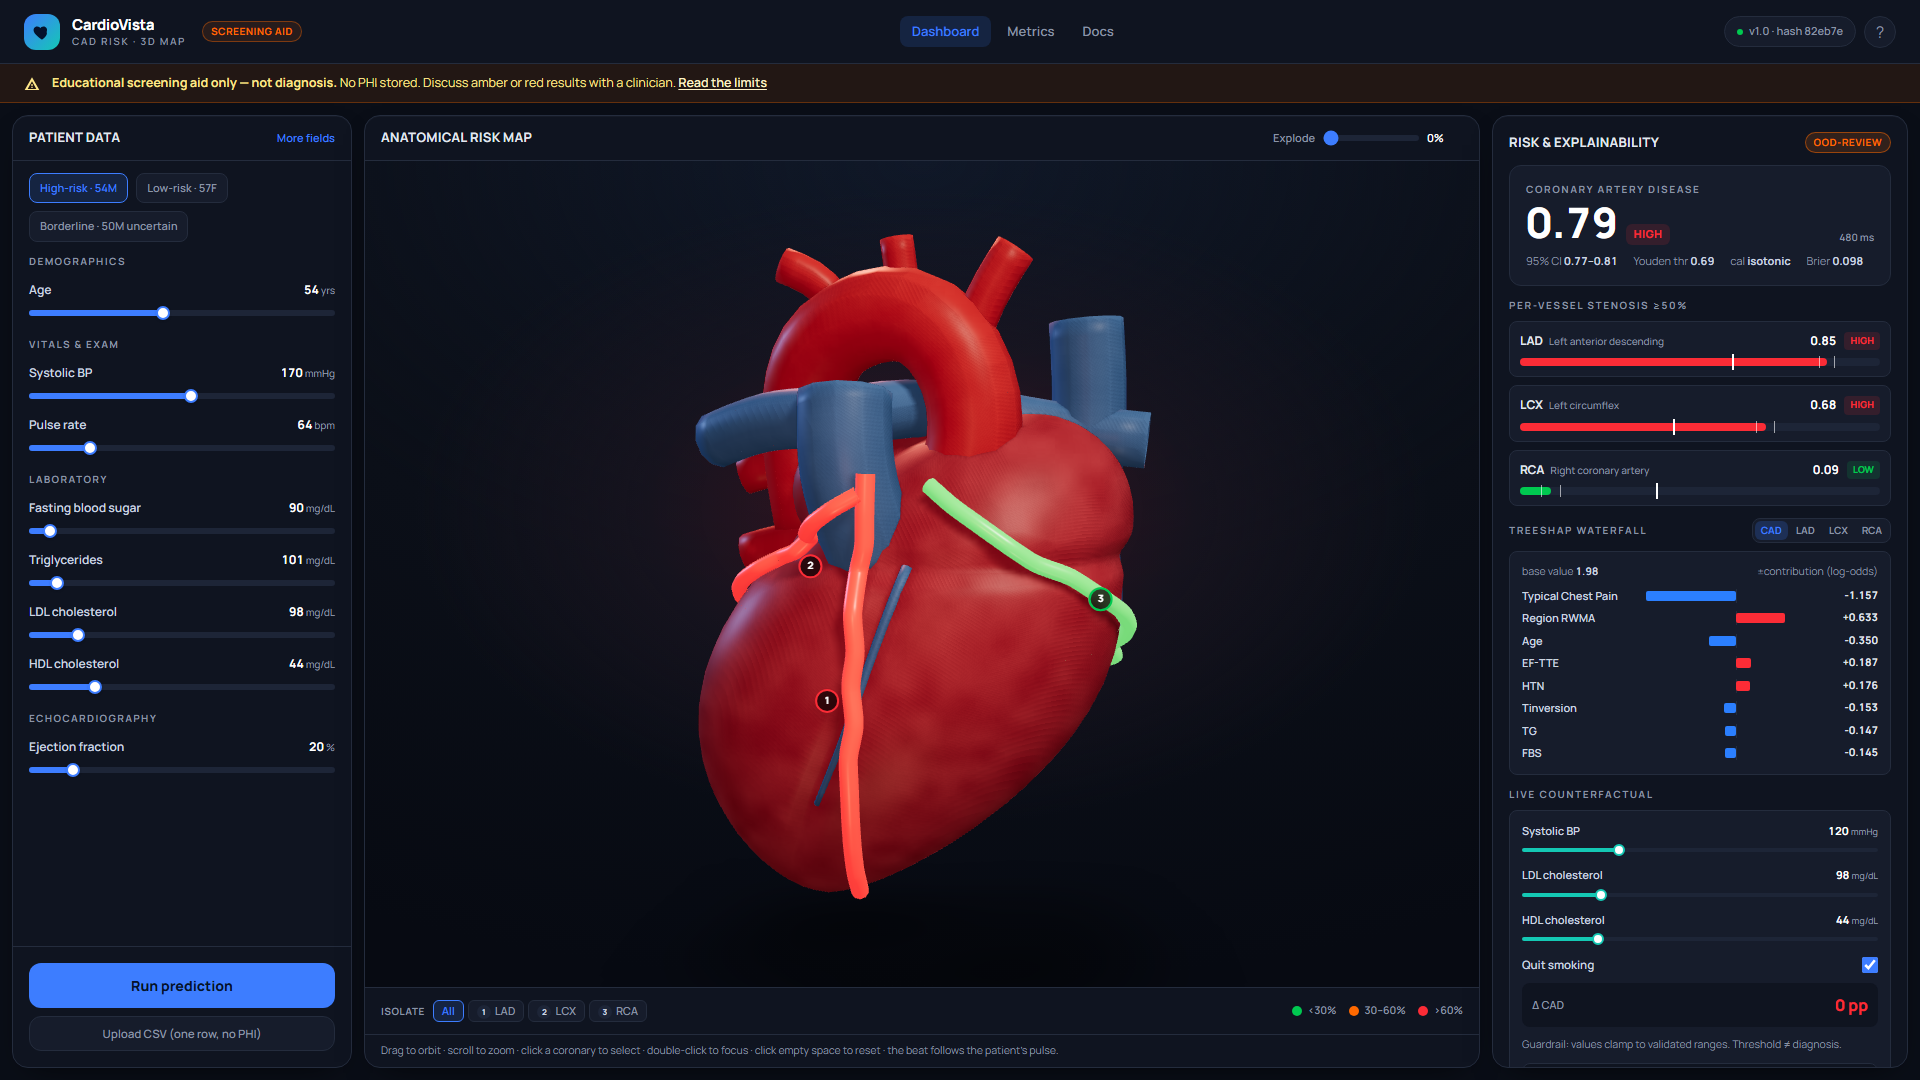
Heart disease remains a leading cause of mortality, yet routine clinical data—demographics, symptoms, vitals, ECG, lab results, and echocardiograms—often sits underutilized in raw percentages that fail to clearly communicate risk to clinicians or patients. We wanted to provide a spatial, intuitive view of cardiovascular risk where calibrated numbers are mapped live onto patient anatomy alongside transparent explanations. CardioVista is designed strictly as an educational screening aid, not a diagnostic device.
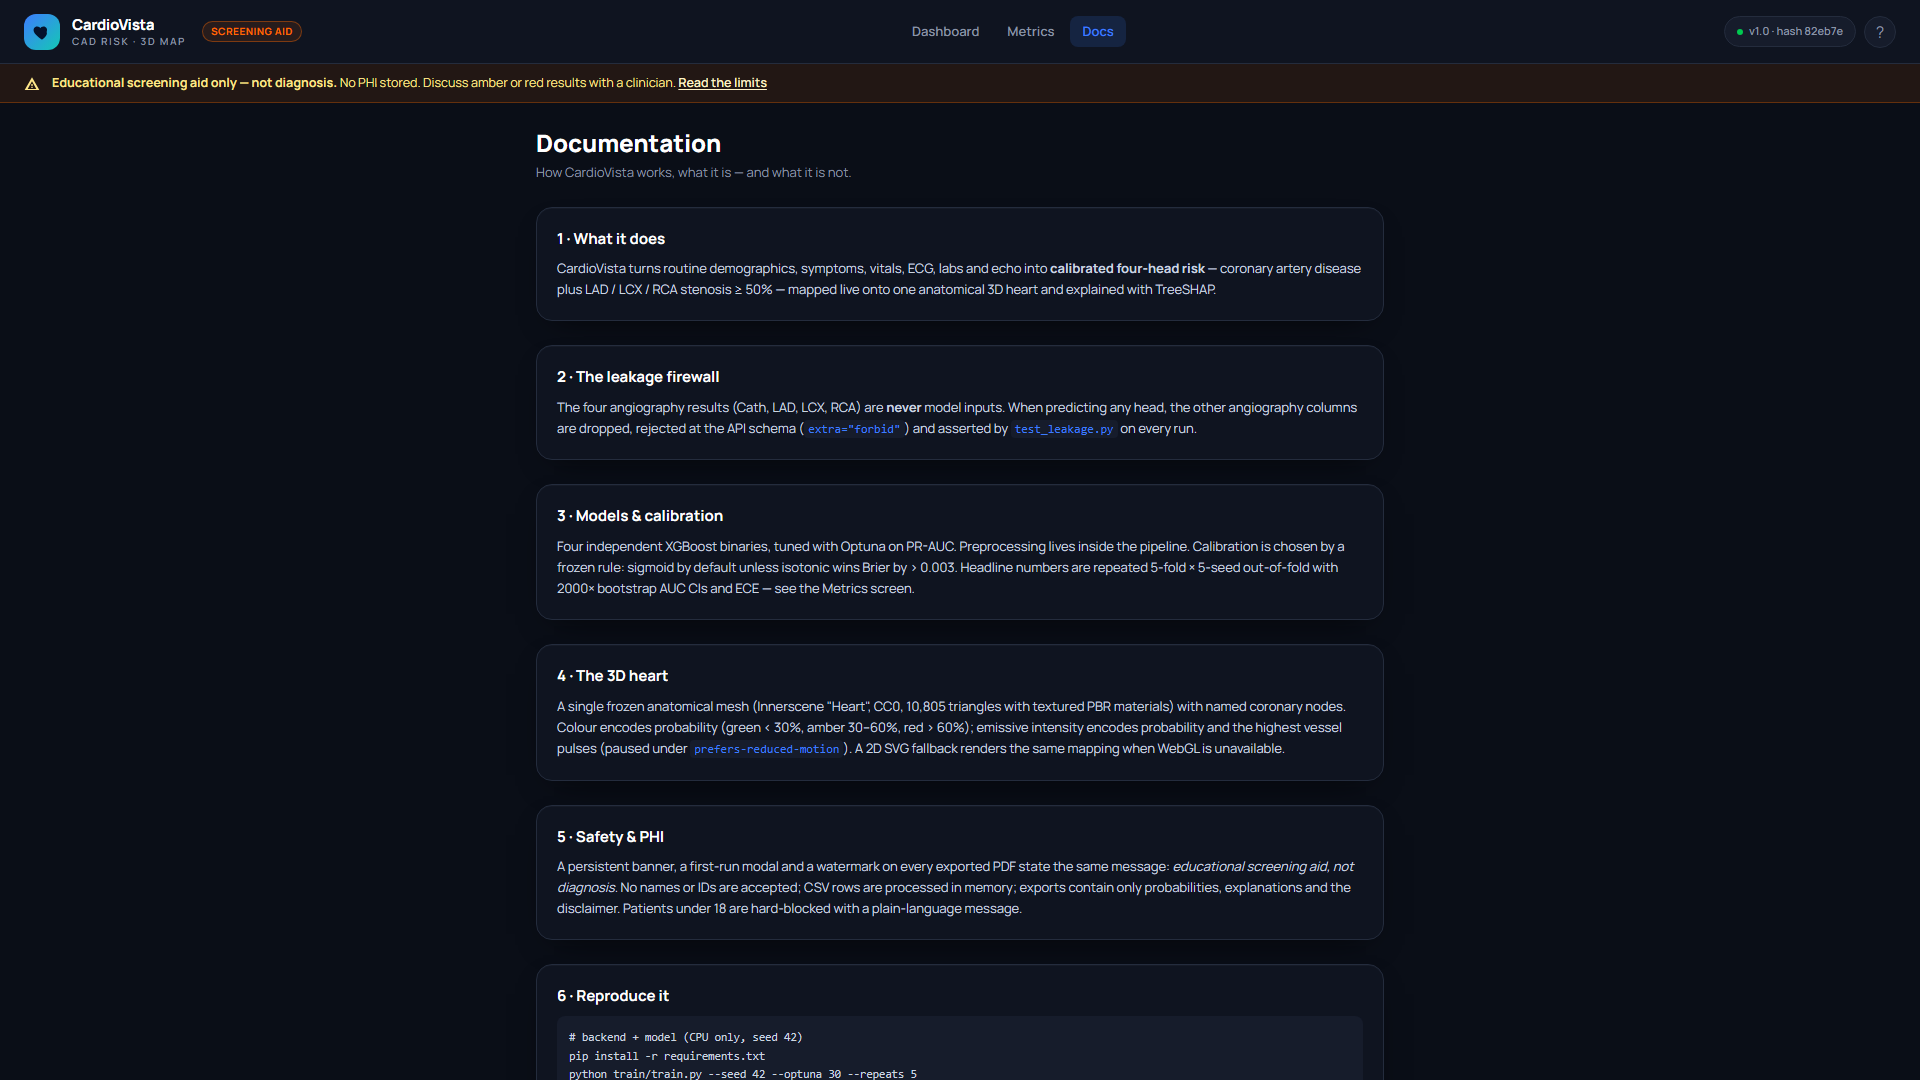
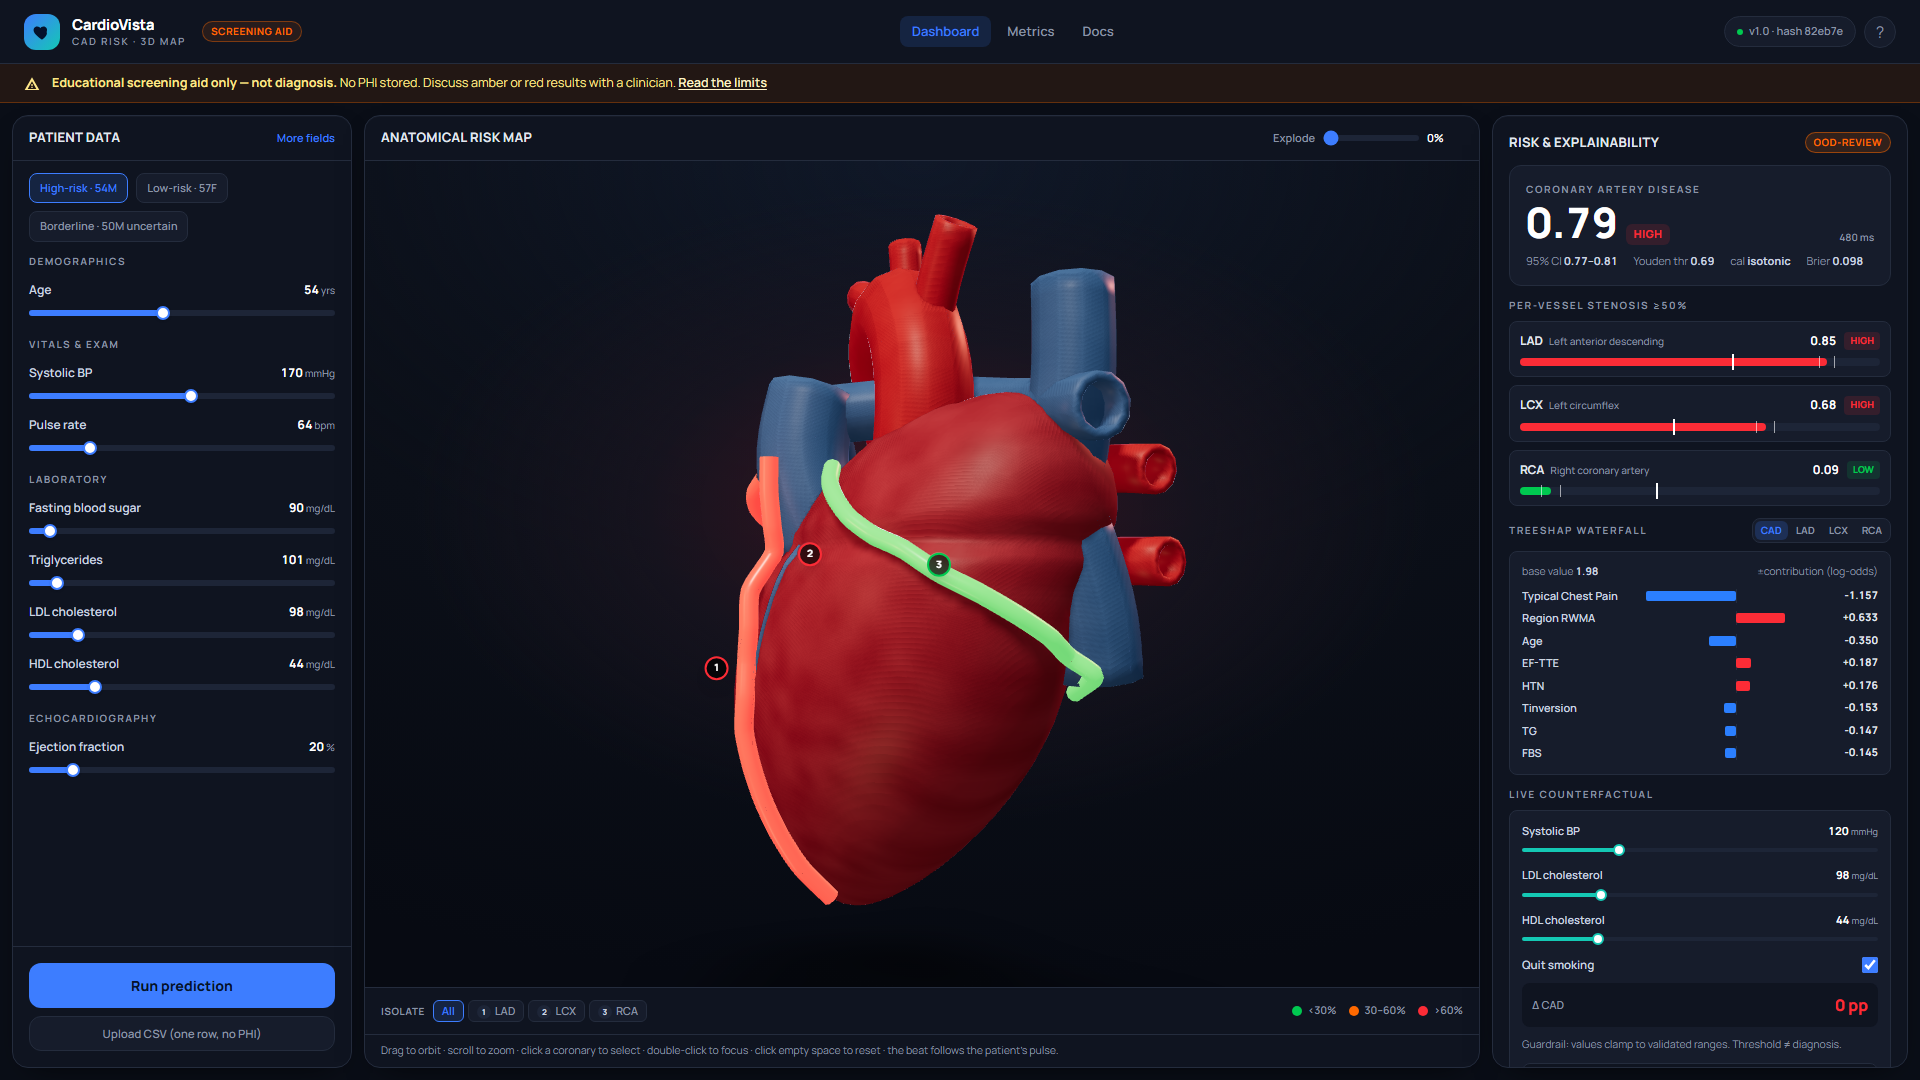
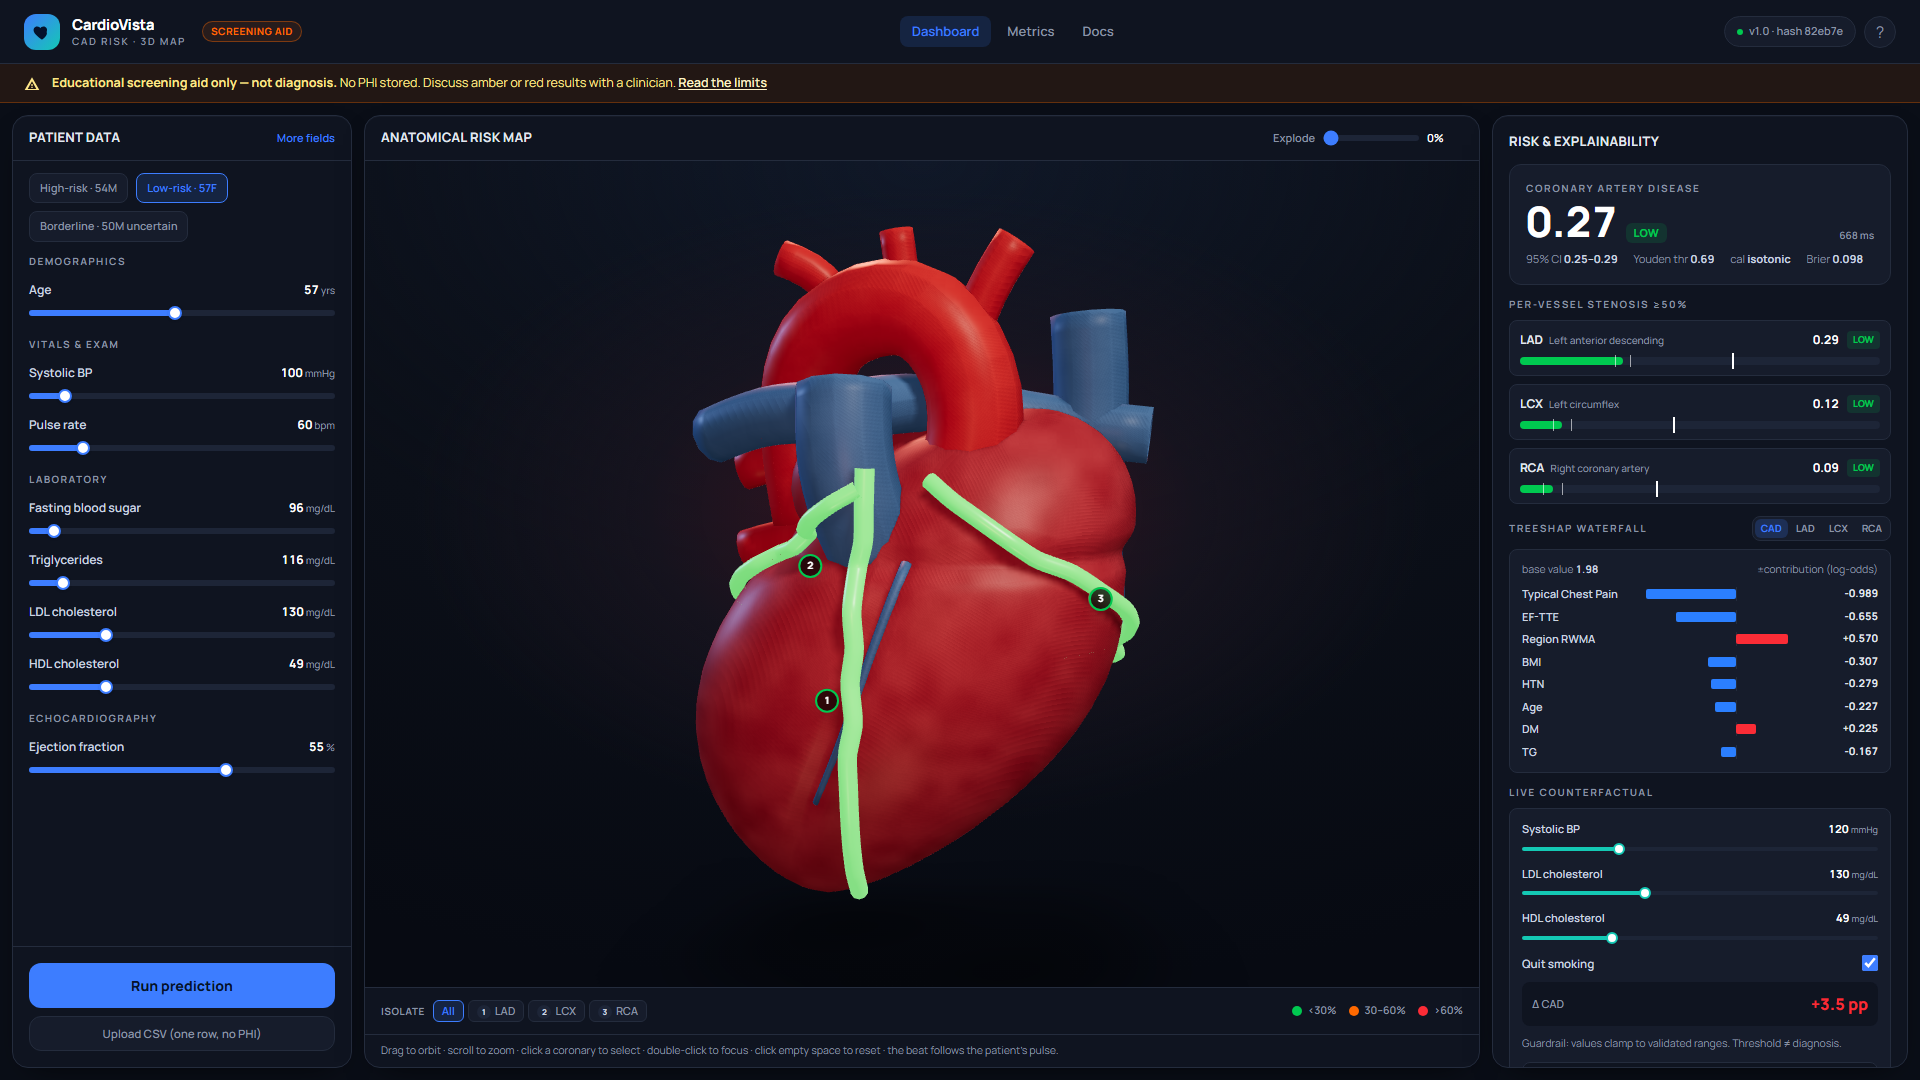
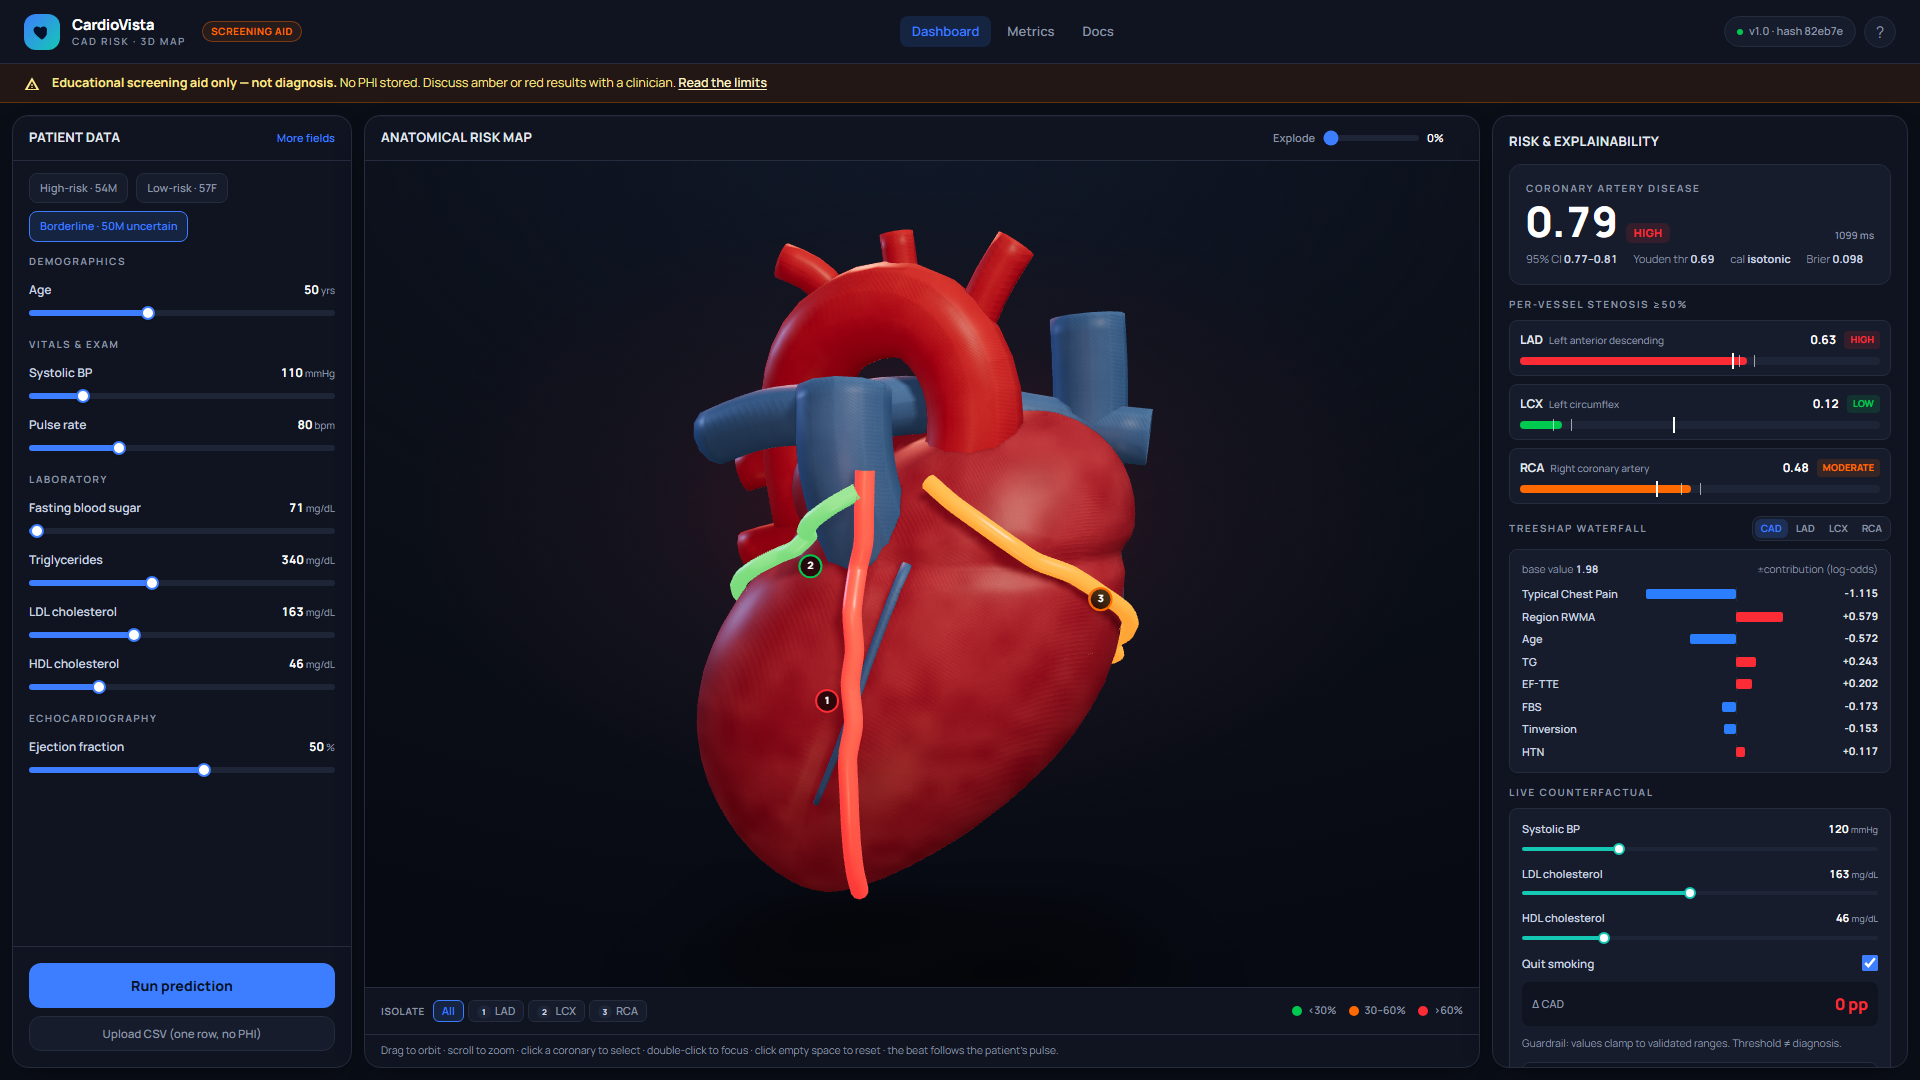
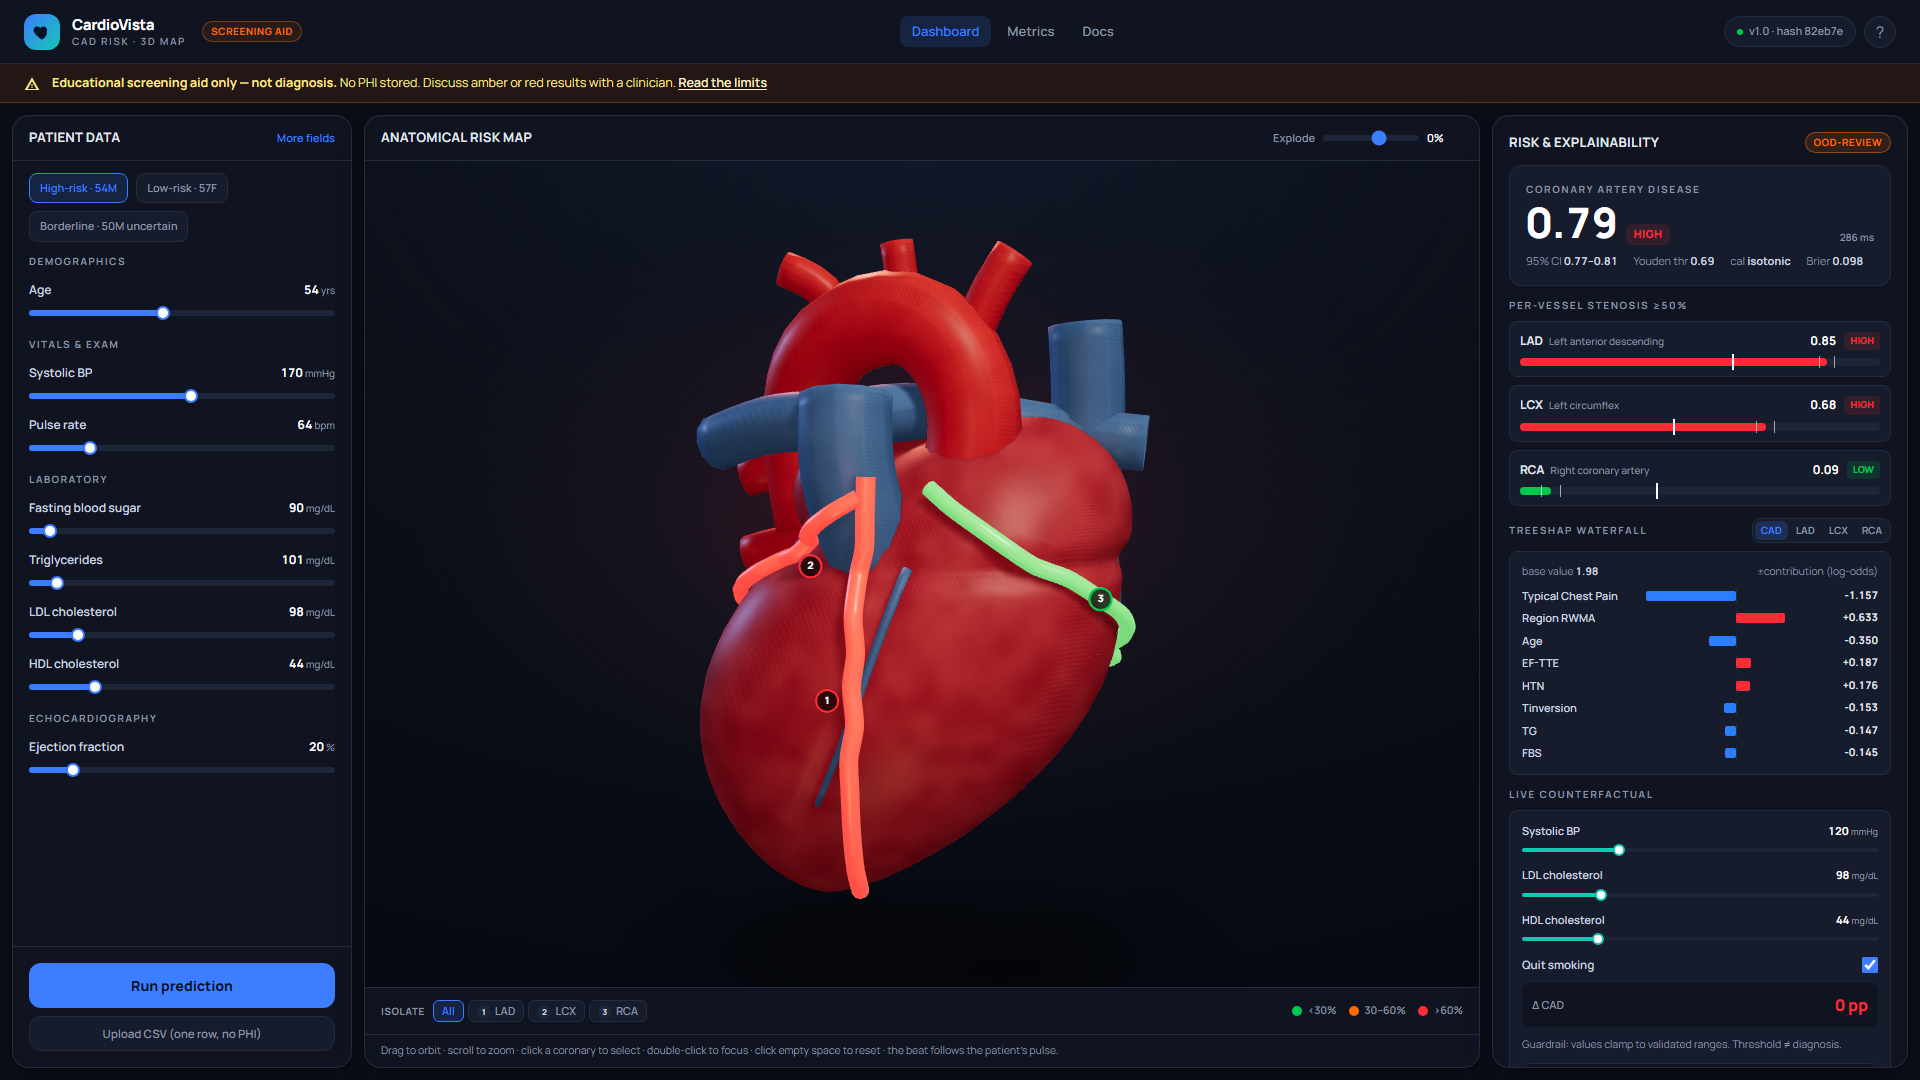
What It Does CardioVista takes 55 routine clinical fields and translates them into a calibrated 4-head risk output assessing Coronary Artery Disease (CAD) as well as stenosis greater than or equal to 50% across the LAD, LCX, and RCA vessels. This data is mapped live onto a 3D anatomical heart and explained using TreeSHAP values.
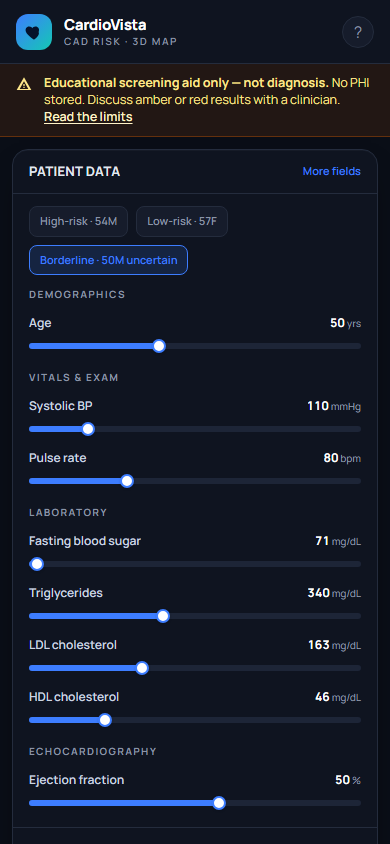
Input Interface: A 55-field input form featuring three preset patient profiles (High Risk, Low Risk, and Borderline), range chips, and CSV upload support.
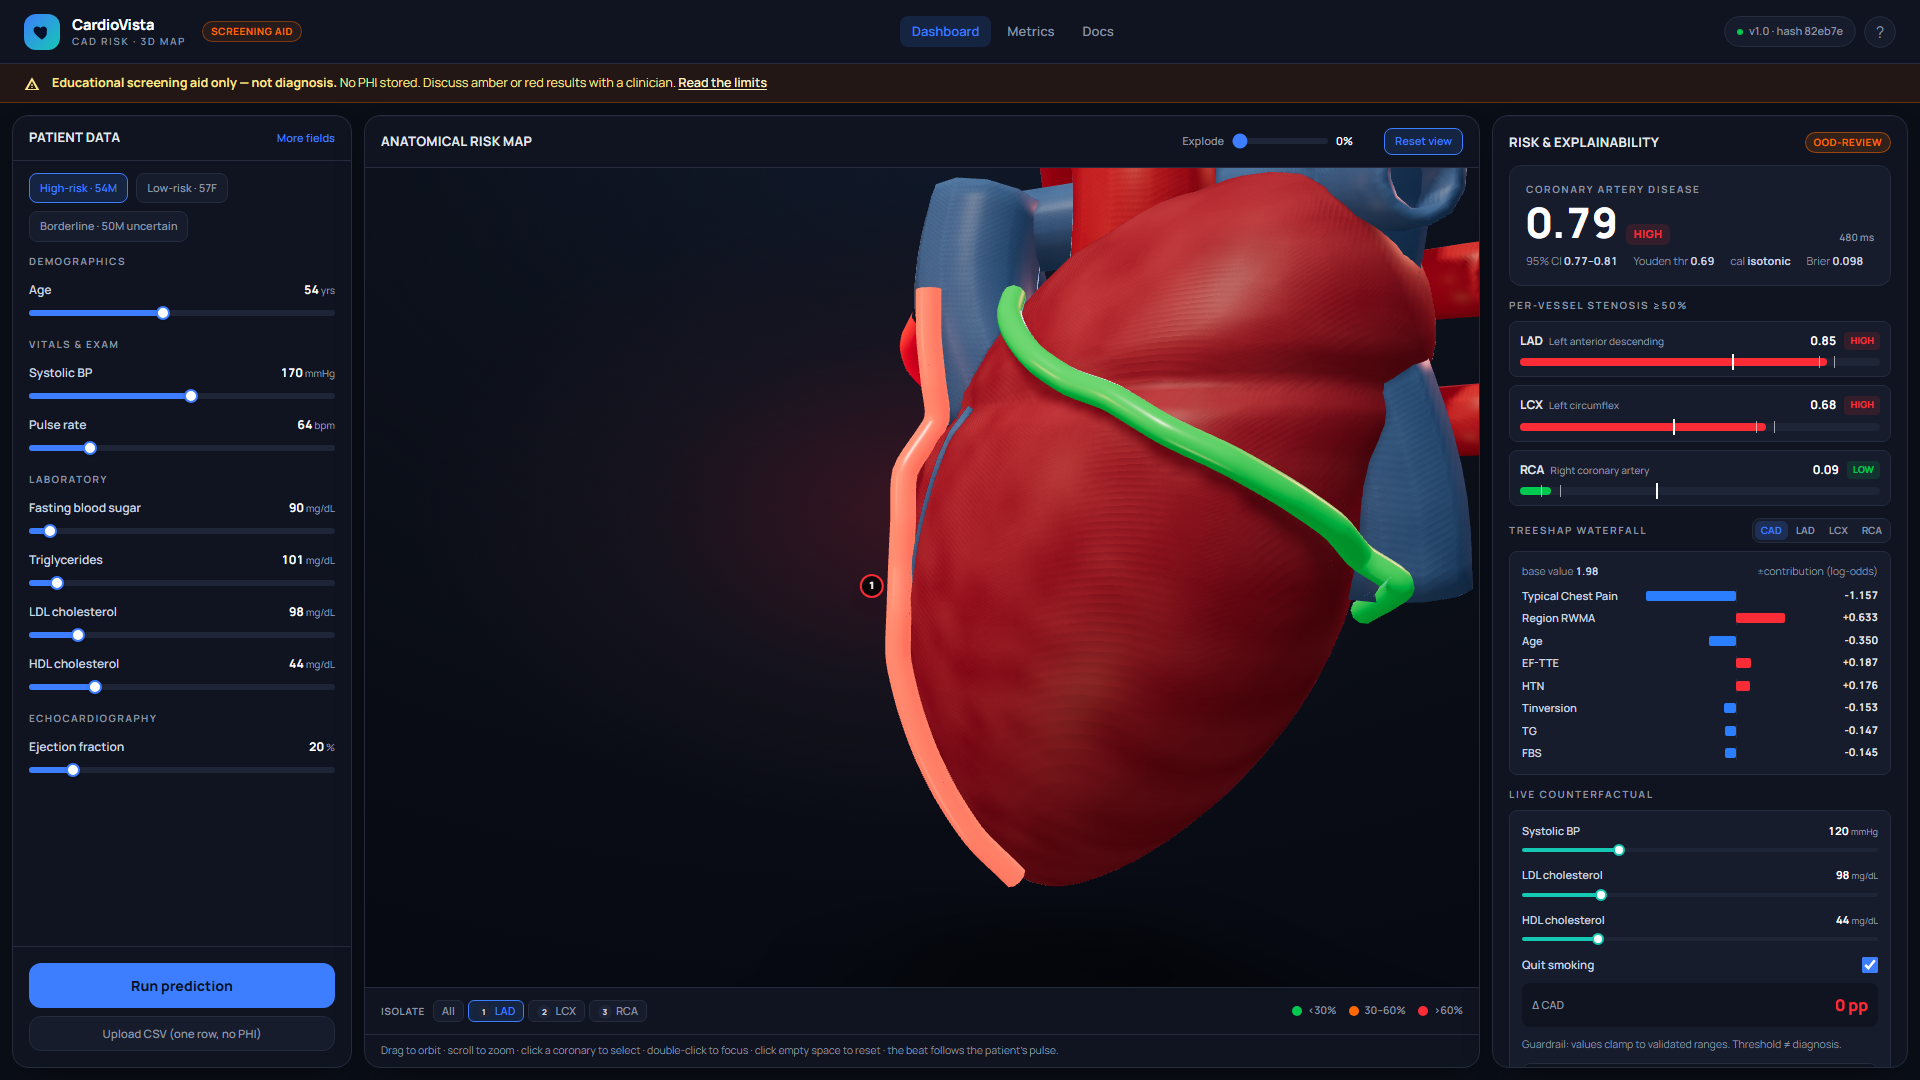
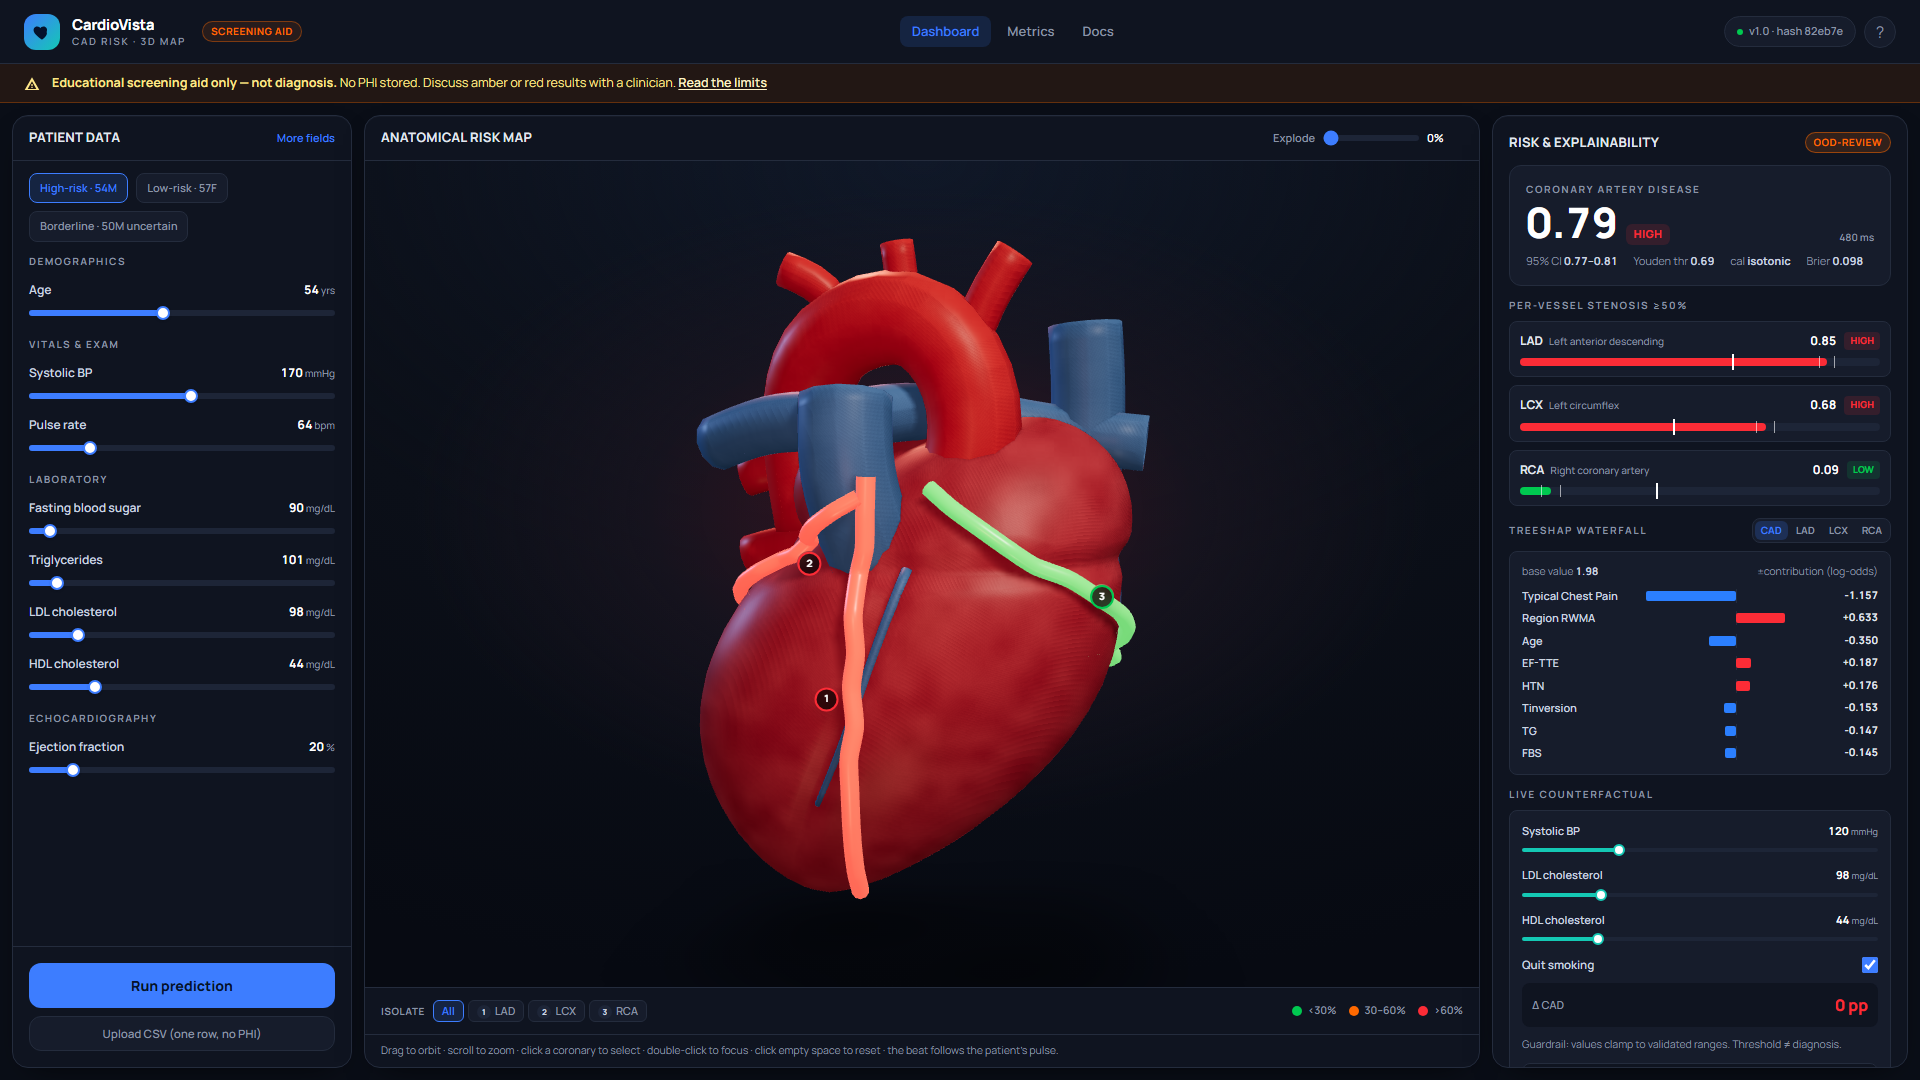
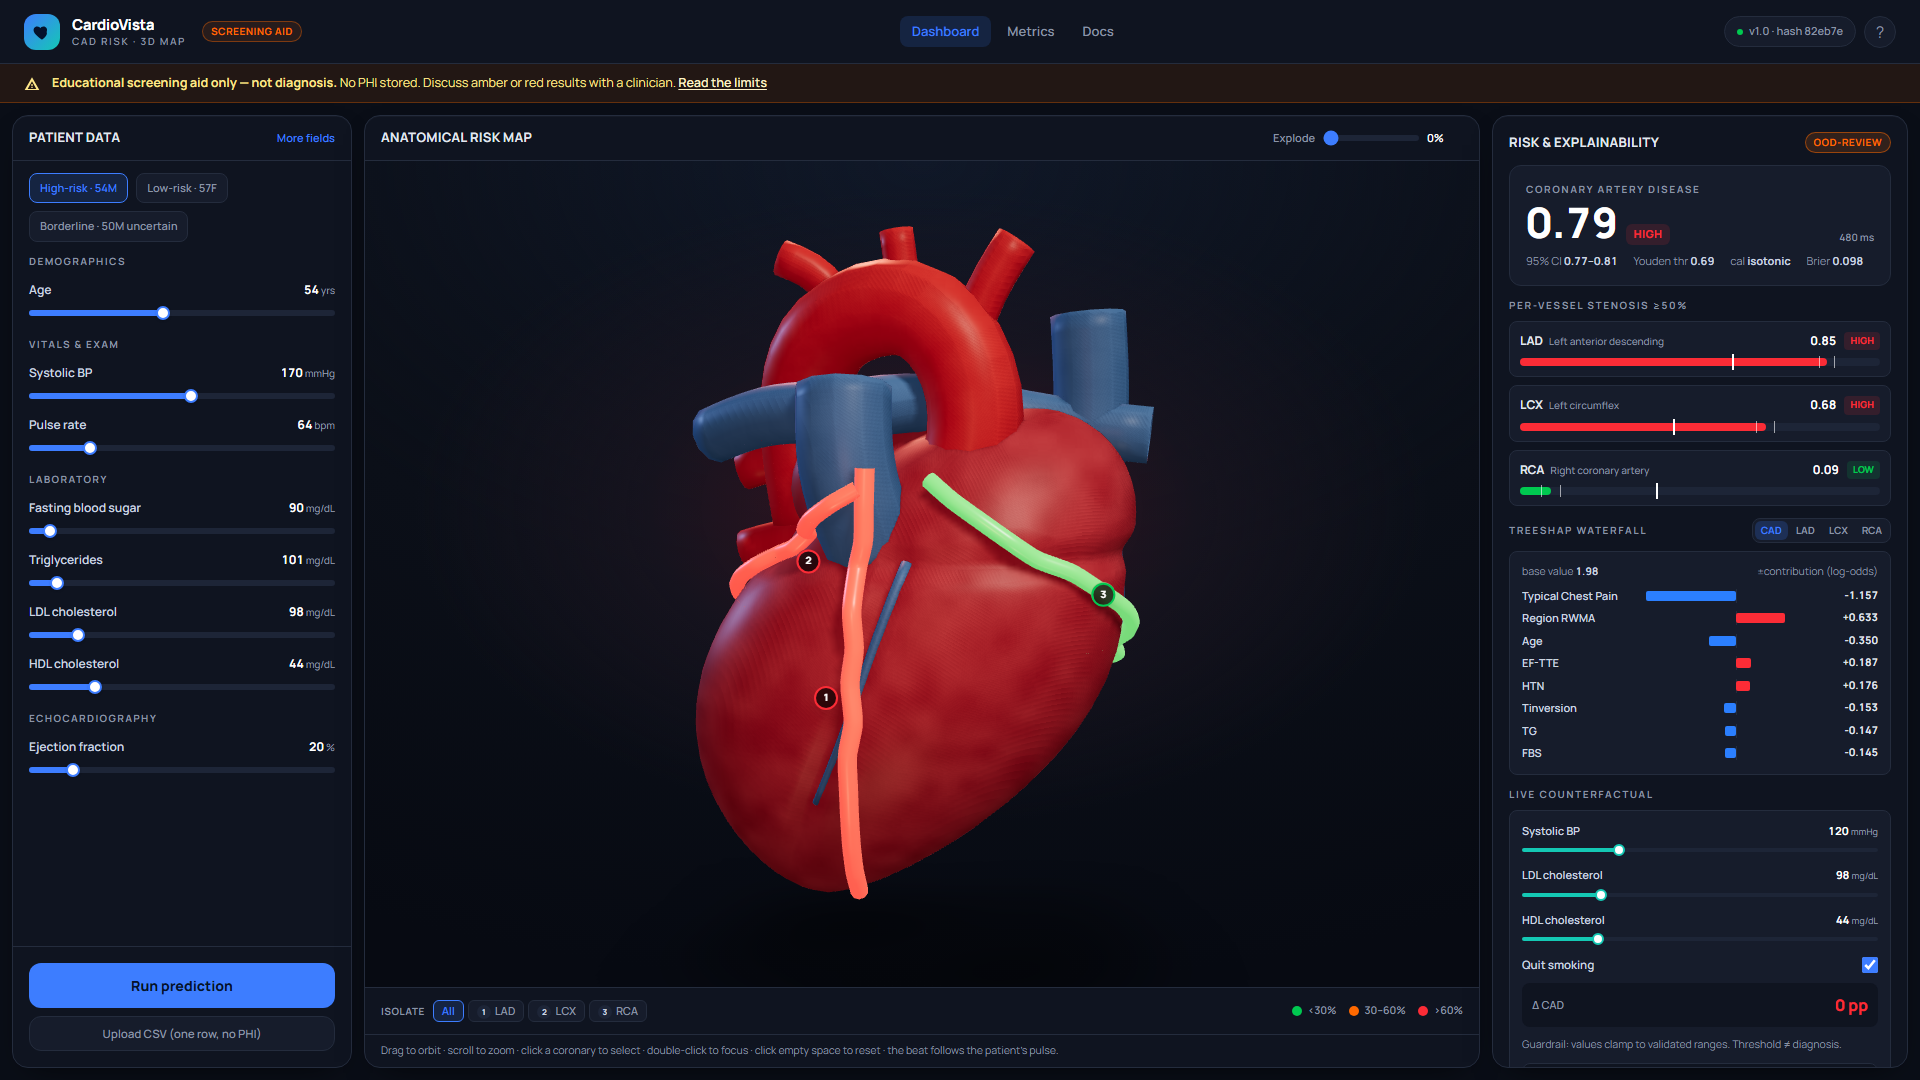
3D Anatomical Scene: Built using React Three Fiber, allowing users to orbit, zoom, click-sync, isolate, X-ray, and explode the heart model. Vessels are color-coded (green under 30%, amber 30 to 60%, and red above 60%), with the highest-risk vessel actively pulsing.
Risk Analytics & Explainability: Displays the CAD probability alongside a 95% confidence interval, Youden threshold, risk tier badge, vessel probability bars with uncertainty whiskers, a top-8 SHAP waterfall plot grouped by domain, and live counterfactual difference tracking.
How We Built It Frontend: Vite, React, TypeScript, Tailwind CSS, React Three Fiber, Zustand, and Recharts.
Backend: FastAPI, Pydantic v2, and Joblib, serving versioned endpoints for predictions, explanations, counterfactuals, metrics, and model info.
Machine Learning: Four independent pipelines. CAD risk uses a tuned XGBoost and L2-logistic ensemble. Vessel risks use tuned XGBoost models. Preprocessing includes median imputation, standardization, and one-hot encoding with strict leakage prevention and automated probability calibration.
3D Optimization: Utilizes a lightweight, single-lock 3D heart model (under 3MB) with SHA-256 hash verification and startup drift checks. Includes a 2D fallback view and reduced-motion support for accessibility.
Challenges We Ran Into Working with a single-centre clinical dataset meant dealing with demographic imbalances and symptom-enriched samples that inherently overfit and overestimate low-risk profiles. Rather than hiding uncertainty, we kept weaker vessel predictions transparent with visible confidence intervals and evaluation metrics. We also handled high-risk profile saturation where calibration ceilings limit visible probability shifts during counterfactual testing.
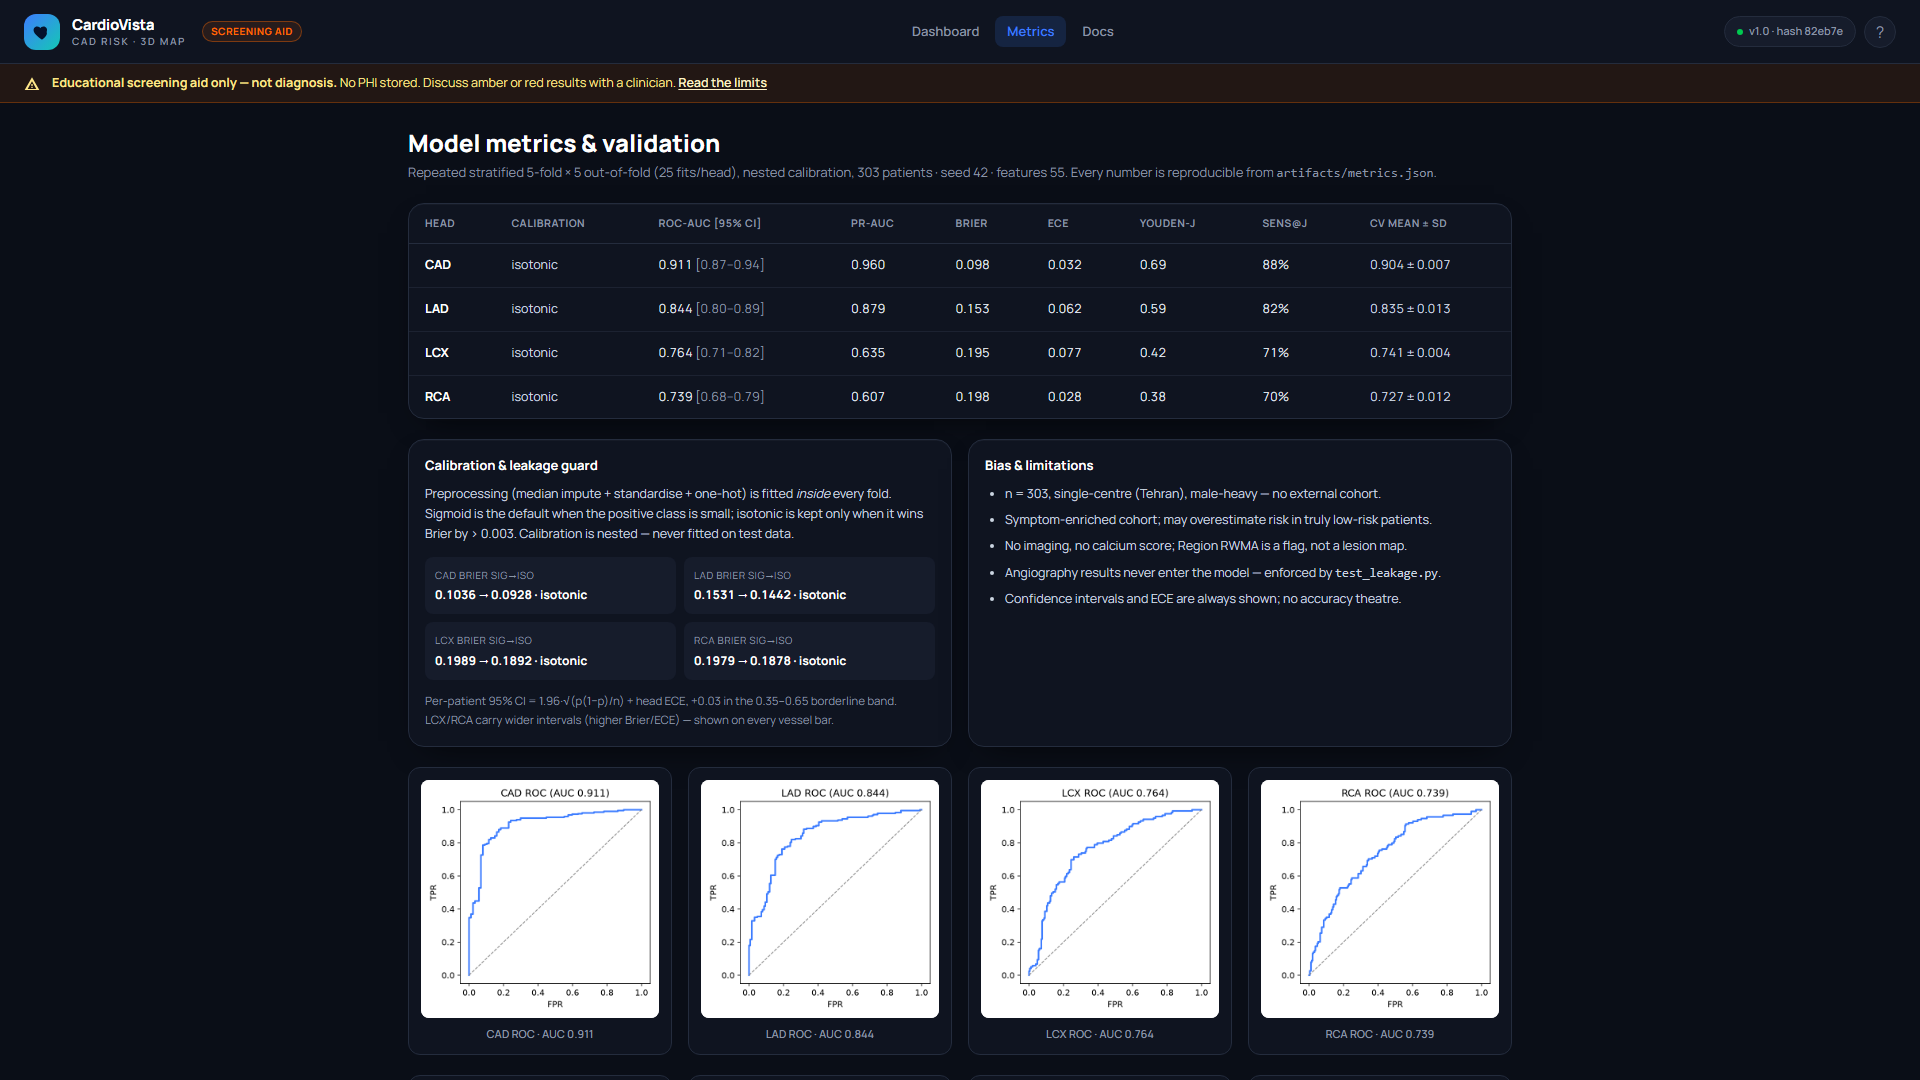
Accomplishments We're Proud Of Executing rigorous cross-validation and bootstrap confidence intervals to ensure statistically honest metrics.
Delivering a high-performance, lightweight 3D interactive medical visualization running at 60fps with a seamless 2D fallback.
Building a guardrailed live counterfactual engine that lets users instantly test clinical interventions.
What We Learned Calibration is significantly more valuable than blind accuracy metrics. Operating points like Youden thresholds are decision boundaries rather than definitive diagnostic lines. Working with clinical data demands robust infrastructure, including strict data leakage firewalls, out-of-distribution checks, and bias reporting cards.
What's Next Future plans include external multi-centre validation, silent prospective clinical trials, FHIR healthcare integration, a calcium-score prediction head, and ONNX runtime migration for broader deployment.
Built With
- fastapi
- joblib
- matplotlib
- optuna
- pandas
- pydantic
- react
- scikit-learn
- shap
- tailwind-css
- three.js
- typescript
- vite
- xgboost
- zustand


Log in or sign up for Devpost to join the conversation.