Inspiration
Cardiovascular disease remains one of the world’s most serious health challenges, but conventional machine-learning outputs often appear as isolated percentages, labels, or tables. A risk score such as “78% probability of CAD” can be technically useful, but it does not naturally communicate where the risk is associated within the coronary system or why the model reached that conclusion. We wanted to bridge the gap between predictive machine learning and human-centered clinical visualization. CardioVista 3D was inspired by the idea that risk predictions should be understandable, spatial, and explainable. By combining a multi-output prediction pipeline with an interactive anatomical model, the project aims to make cardiovascular risk information more intuitive for demonstrations, learning, and clinical decision-support workflows.
What it does
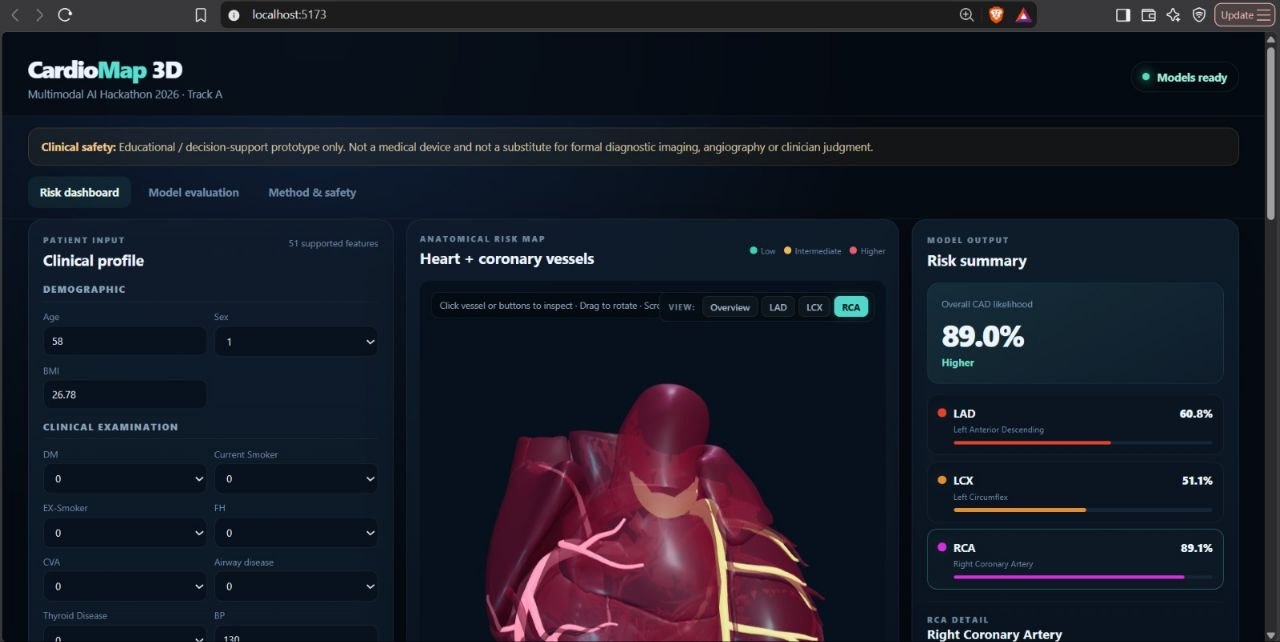
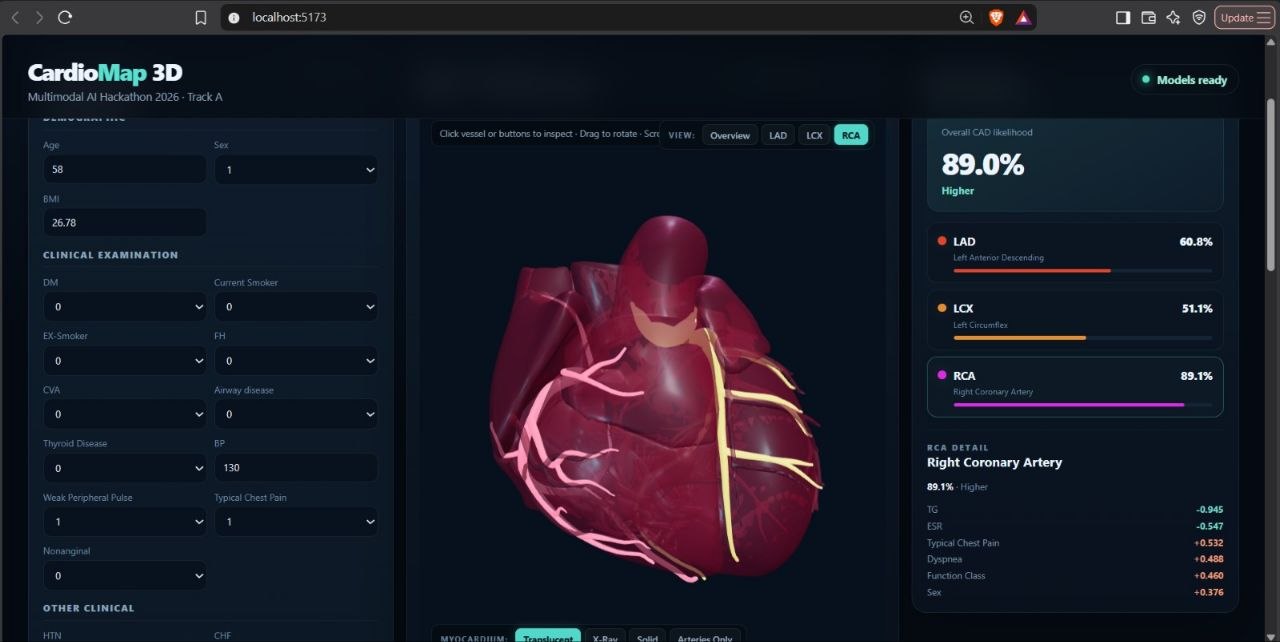
CardioVista 3D accepts patient clinical information and produces four key predictions: Overall likelihood or classification of Coronary Artery Disease (CAD) Probability of LAD stenosis Probability of LCX stenosis Probability of RCA stenosis
The platform then visualizes these predictions through a web-based dashboard:
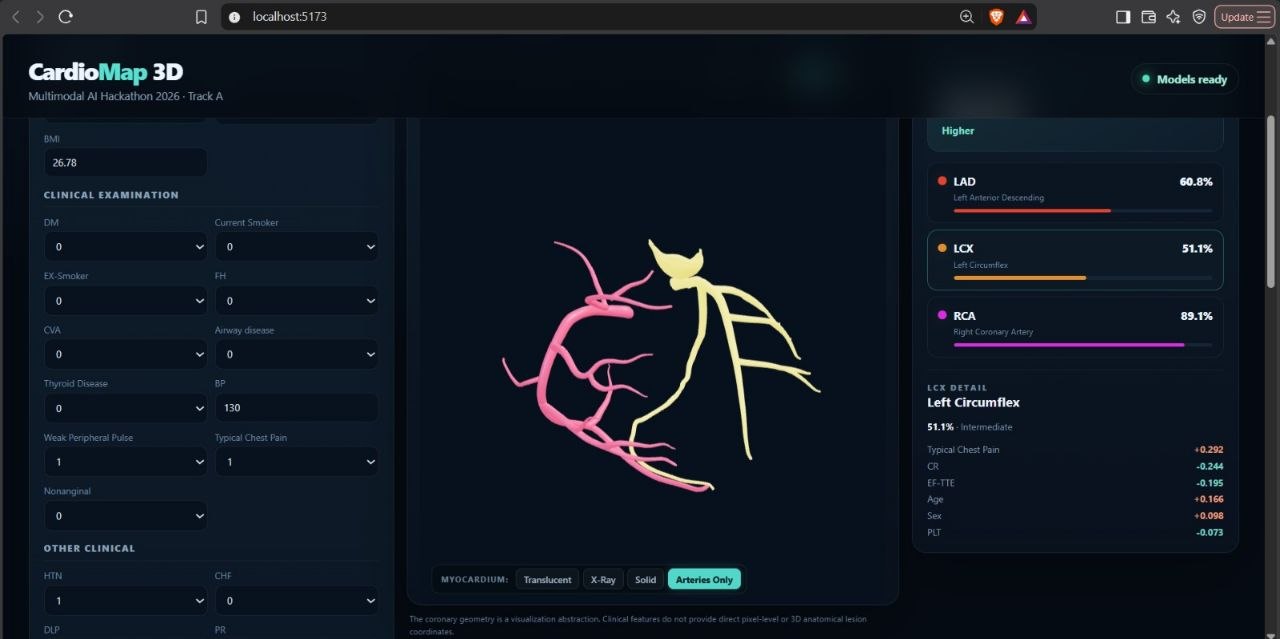
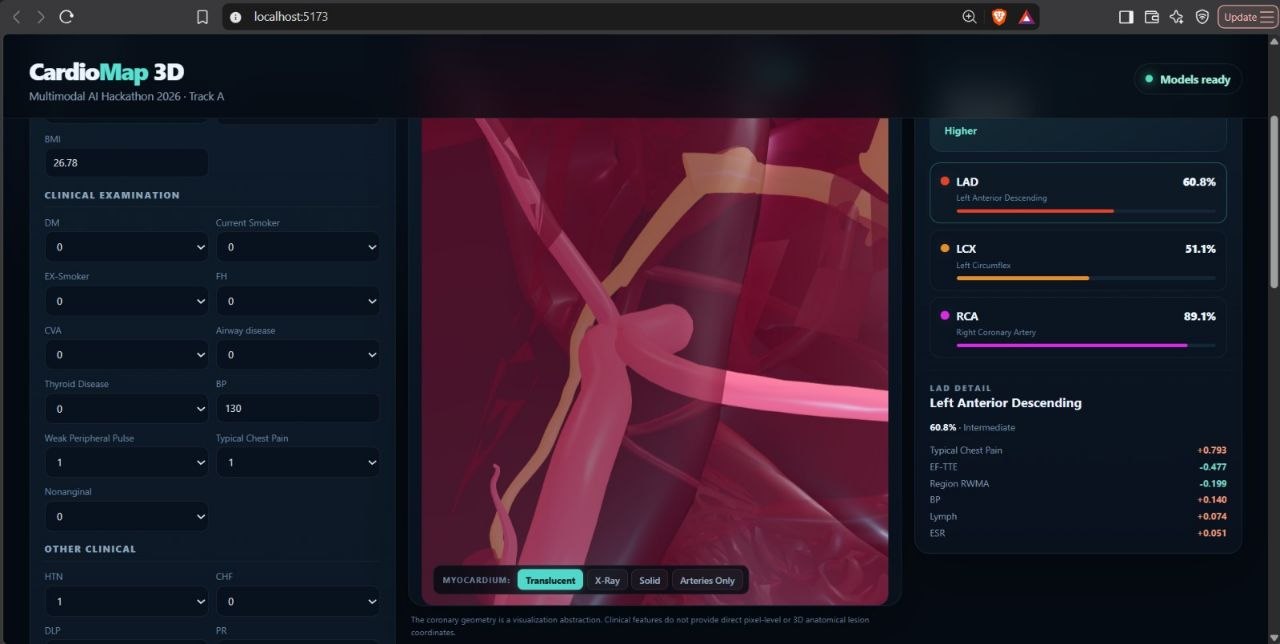
A 3D anatomical heart/torso viewer renders the coronary artery regions. LAD, LCX, and RCA vessel paths change color according to predicted stenosis probability. Users can rotate, zoom, and inspect the model interactively. A dashboard displays CAD status, vessel-specific risk scores, and patient physiological values. An explainability panel uses feature attribution techniques such as SHAP or LIME to show the clinical factors that most influenced the prediction. A visible safety disclaimer clarifies that the tool supports education and decision-making, rather than replacing medical imaging or professional diagnosis. The model uses demographic, clinical, ECG, laboratory, and echocardiographic inputs such as age, blood pressure, pulse rate, cholesterol, cardiac enzymes, ST elevation, T-wave inversion, LVH, and regional wall-motion abnormality findings. To prevent target leakage, the LAD, LCX, RCA, and Cath fields are excluded from model inputs when predicting CAD or vessel stenosis.
How we built it
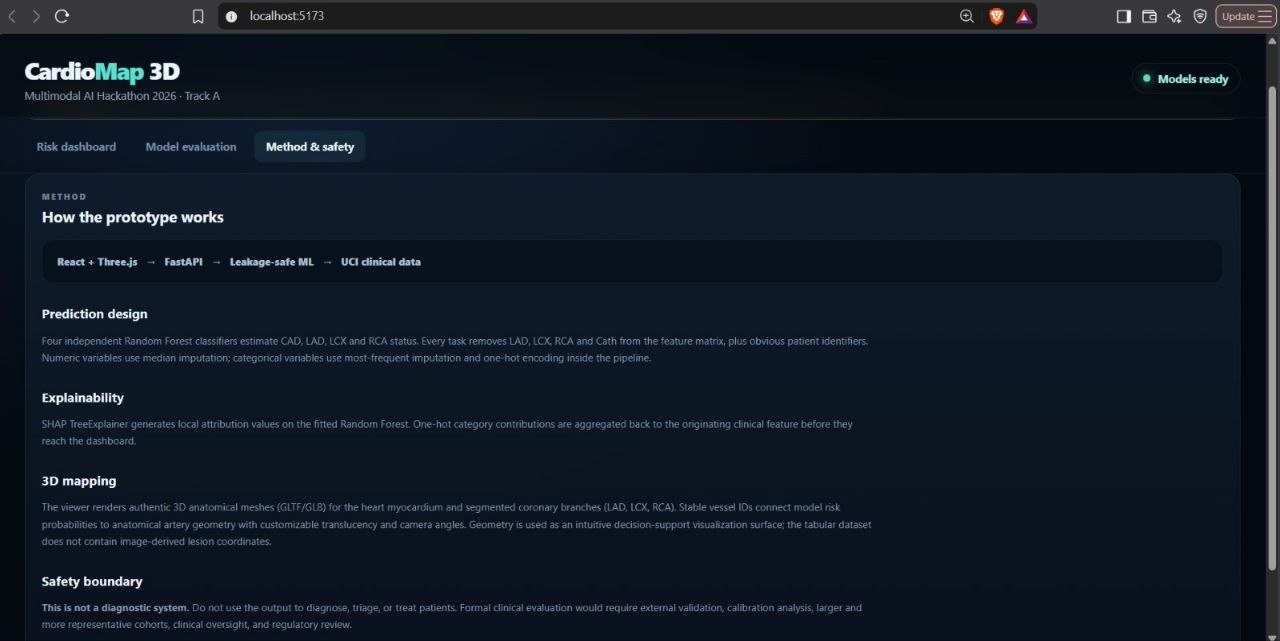
Data and machine learning We designed a preprocessing and modeling workflow around the Extension of the Z-Alizadeh Sani Dataset. Clean and preprocess clinical data, including missing-value handling, categorical encoding, and feature scaling where required. Separate model inputs from target labels. Exclude direct target-related columns such as LAD, LCX, RCA, and Cath from the training features to avoid leakage.
Train classification models for:
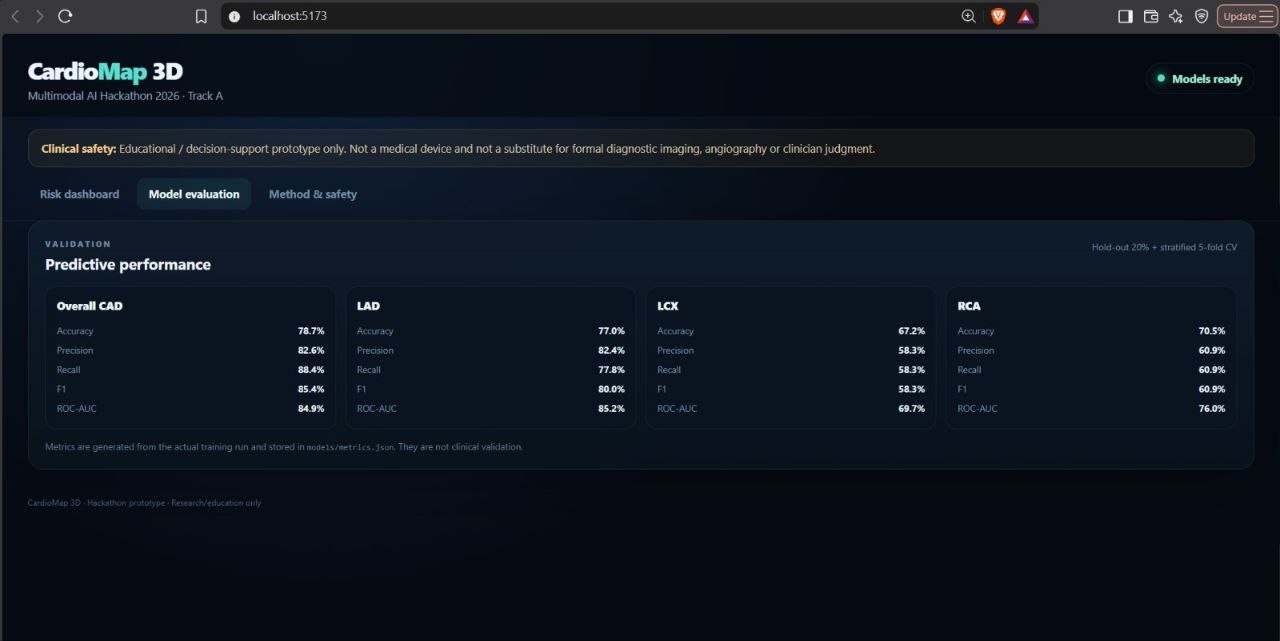
Overall CAD prediction LAD stenosis prediction LCX stenosis prediction RCA stenosis prediction Evaluate model quality using accuracy, precision, recall, F1-score, and ROC-AUC. Generate prediction probabilities that can be directly mapped to visual risk colors in the 3D interface. Produce patient-level explanations using SHAP or LIME, showing which physiological features contributed positively or negatively to each prediction.
3D visualization For the visualization layer, we designed the system around modern browser-based 3D technologies such as Three.js, React Three Fiber, WebGL, or VTK.js.
The 3D pipeline includes: An open-source anatomical heart or torso mesh in .gltf, .glb, or .obj format Distinct visual representations for the LAD, LCX, and RCA vessels Dynamic vessel colors based on model probability output Hover, click, zoom, and rotation interactions Risk legends that communicate low-, moderate-, and high-risk prediction ranges A responsive rendering approach designed to work in modern browsers without requiring a dedicated GPU
The key design principle is maintaining a consistent correspondence between each machine-learning output and its visual coronary artery representation.
Challenges we faced Translating tabular data into anatomy The dataset provides clinical and physiological information, not direct 3D imaging or pixel-level lesion locations. For example, clinical features and echocardiographic findings can help predict risk, but they do not provide an exact anatomical lesion coordinate.
To handle this responsibly, CardioVista 3D maps vessel-level predicted probabilities to the corresponding LAD, LCX, and RCA anatomical structures. The visualization communicates predicted risk for each target vessel rather than claiming to show an exact lesion location.
Preventing target leakage Because the dataset includes vessel labels and catheterization-related information, using these fields as inputs could artificially inflate model performance. We addressed this by excluding LAD, LCX, RCA, and Cath from the input features during CAD and vessel-stenosis prediction training.
Explainability for clinical use A prediction alone is not enough in a healthcare-related interface. We needed a way to show the factors driving model output in a form that users can understand. SHAP or LIME-based feature attribution helps connect predicted risk with relevant inputs such as blood pressure, cholesterol, ECG changes, cardiac enzymes, or echocardiographic findings.
Balancing visual quality and performance High-quality 3D anatomical models can be heavy for web applications. We focused on using optimized mesh formats, lightweight rendering techniques, and responsive interactions so the experience remains usable on modern browsers without requiring high-end hardware.
Clinical safety and responsible communication The project is a decision-support and educational prototype, not a diagnostic system. We incorporated visible safety disclaimers and avoided presenting model predictions as confirmed medical diagnoses. The system communicates uncertainty through probabilities and supports—not replaces—formal imaging and clinical expertise.
What we learned Building CardioVista 3D showed us that healthcare AI is not only about maximizing classification scores. It is equally important to make results interpretable, clinically responsible, and easy to understand.
Key learnings from the project include:
Clinical datasets require careful preprocessing and strict protection against target leakage. Multi-output classification can provide more useful insight than a single overall disease label. A 3D visualization can make risk predictions more intuitive when it accurately corresponds to the model’s target categories. Explainability tools such as SHAP and LIME are essential for communicating why a model produced a risk estimate. In medical applications, clear disclaimers, uncertainty communication, and responsible UX are as important as model performance. Modular architecture matters: the system should be extendable with future clinical features, improved models, additional vessels, or new anatomical structures without a full redesign.
Built With
- ai
- artery
- coronary
- css
- css3
- data
- disease
- fastapi
- fiber
- healthcare
- html5
- javascript
- machine
- medical
- numpy
- pandas
- python
- react
- scikit-learn
- tailwind
- three
- typescript
- uci
- visualization
- webgl

Log in or sign up for Devpost to join the conversation.