-
-

logo
-
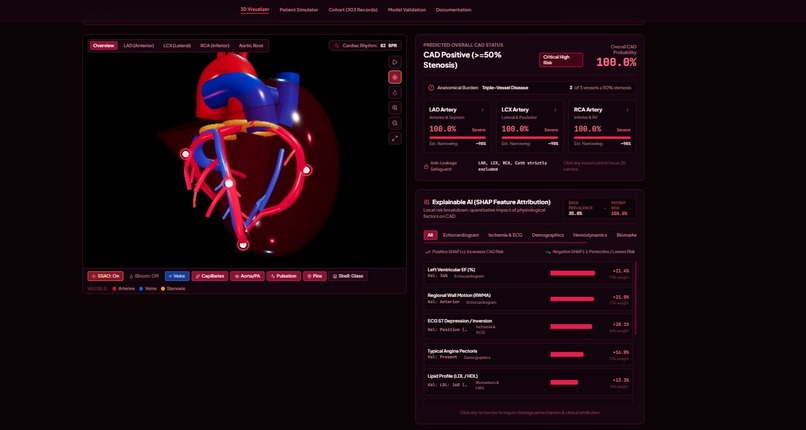
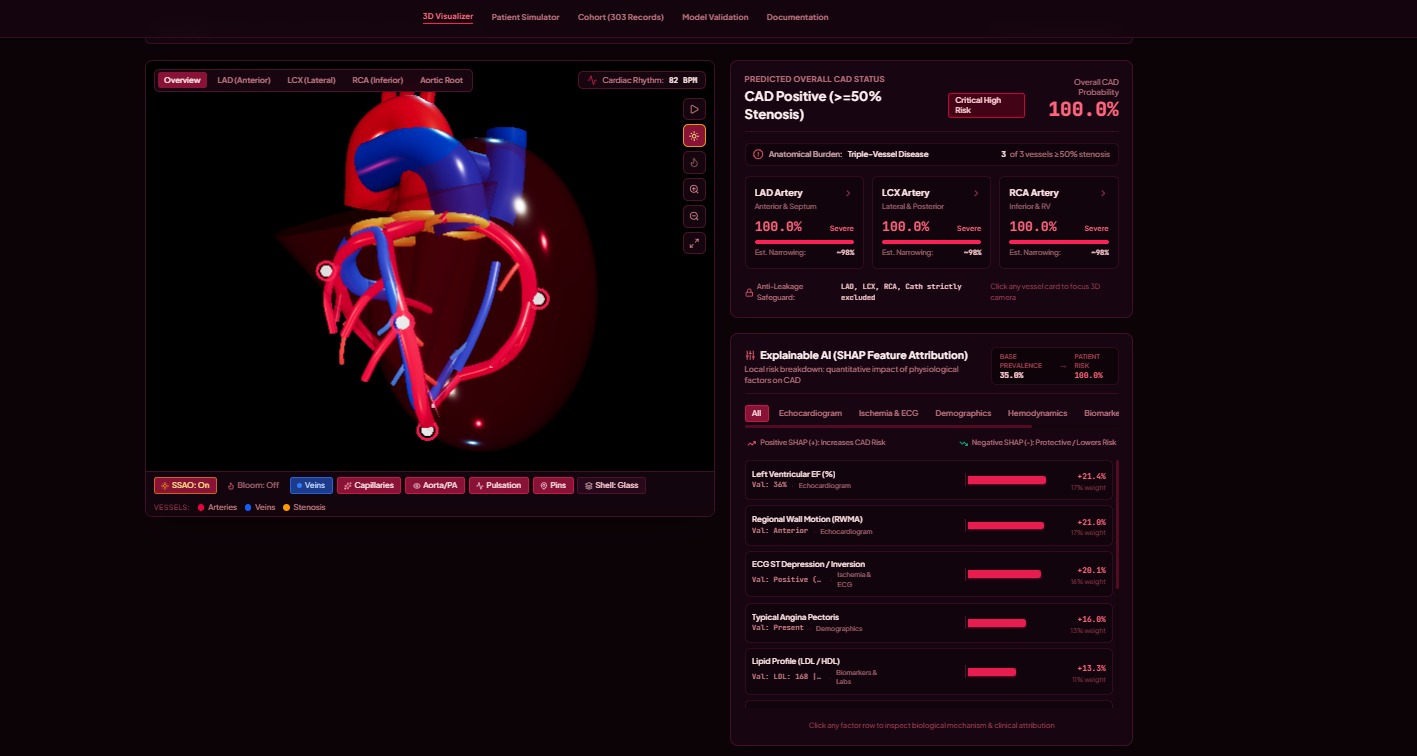
main dashboard
-
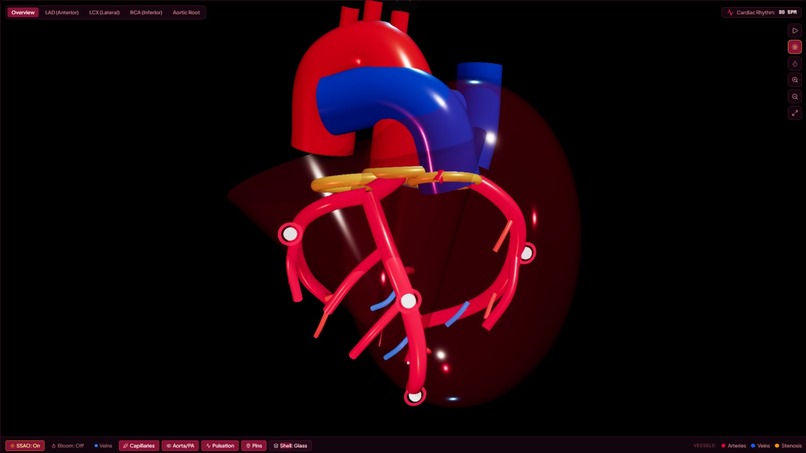
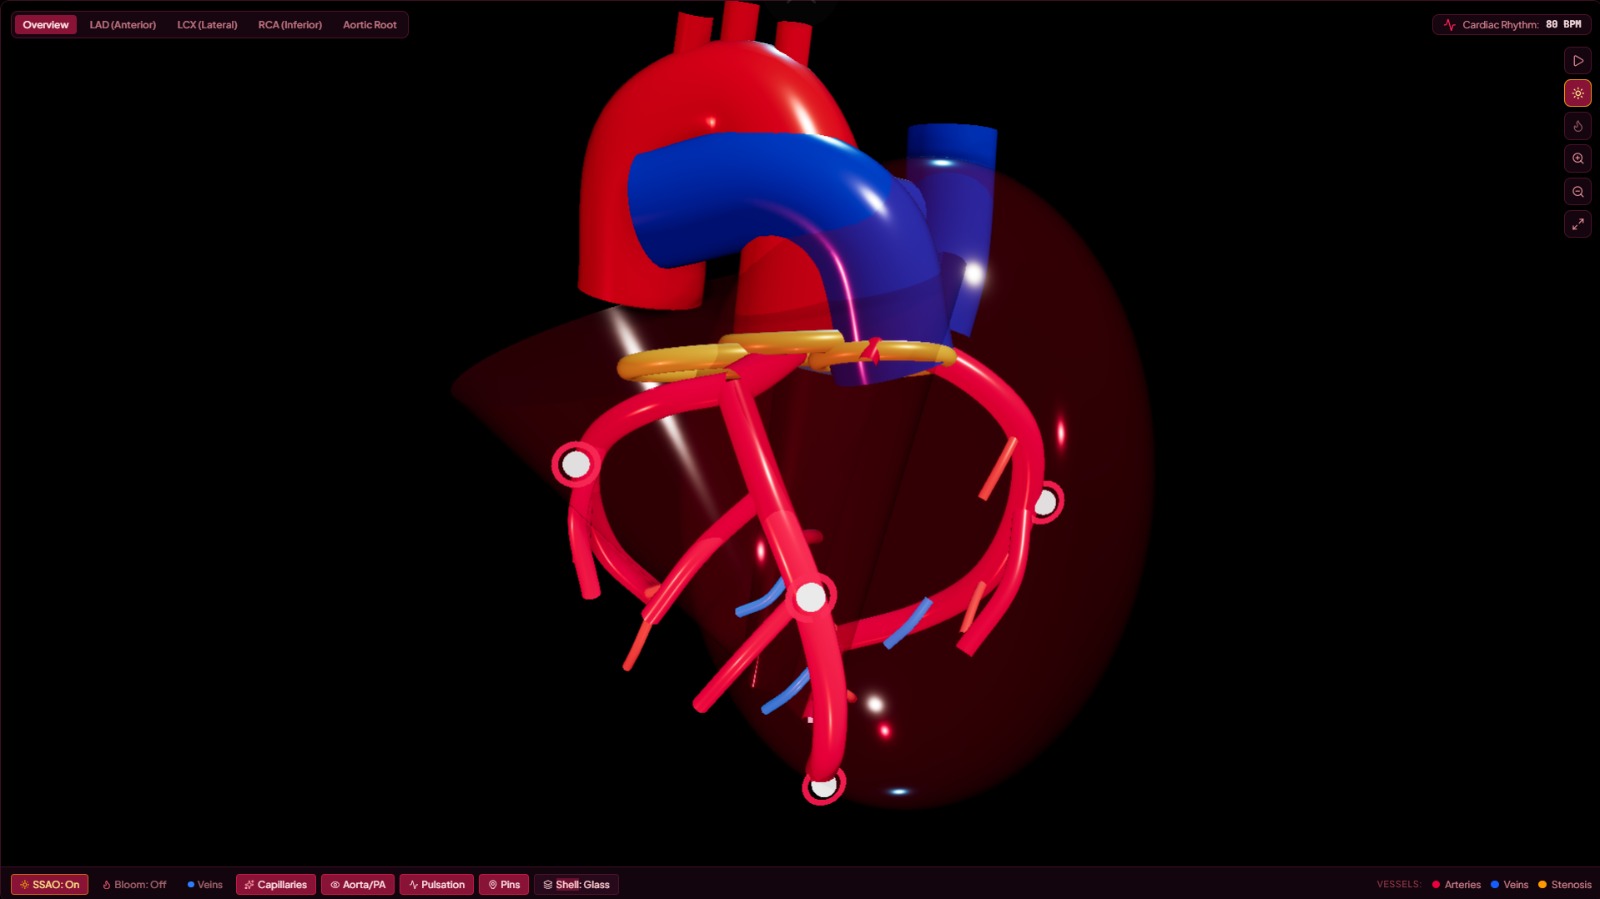
3D simulation
-
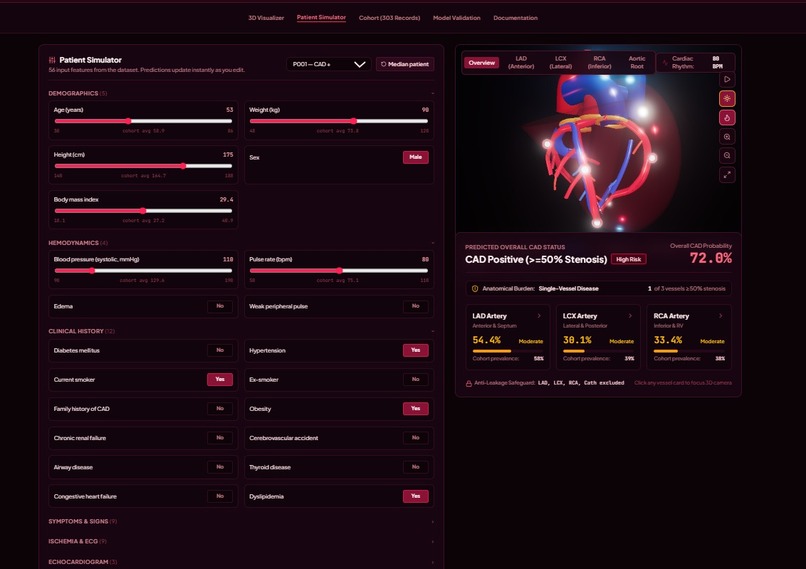
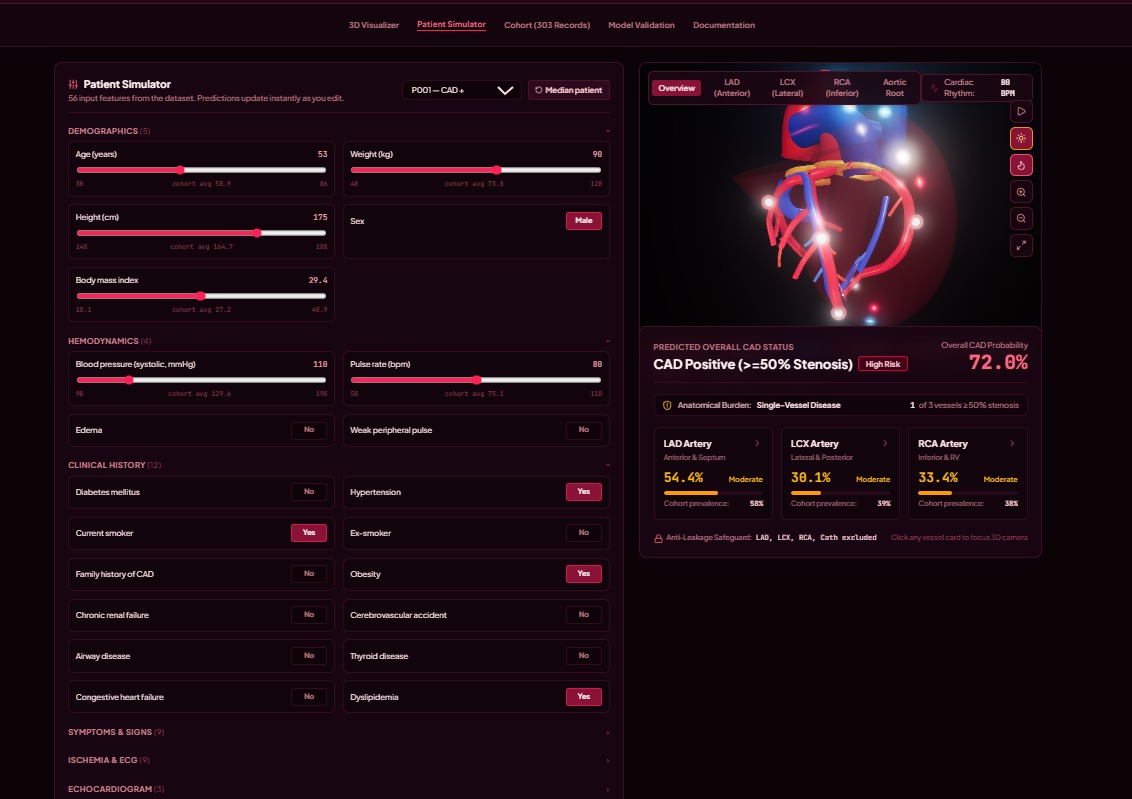
patient monitoring
-
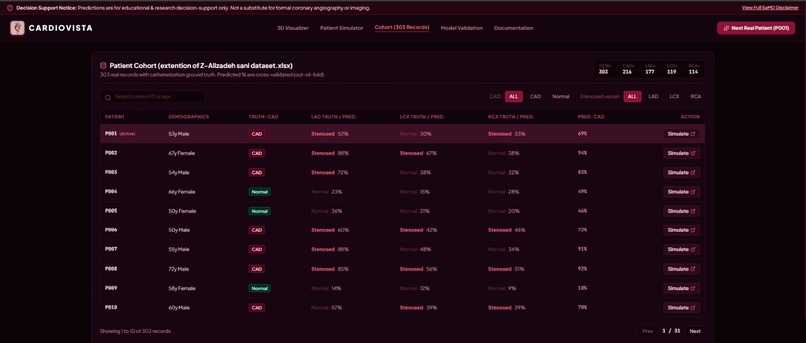
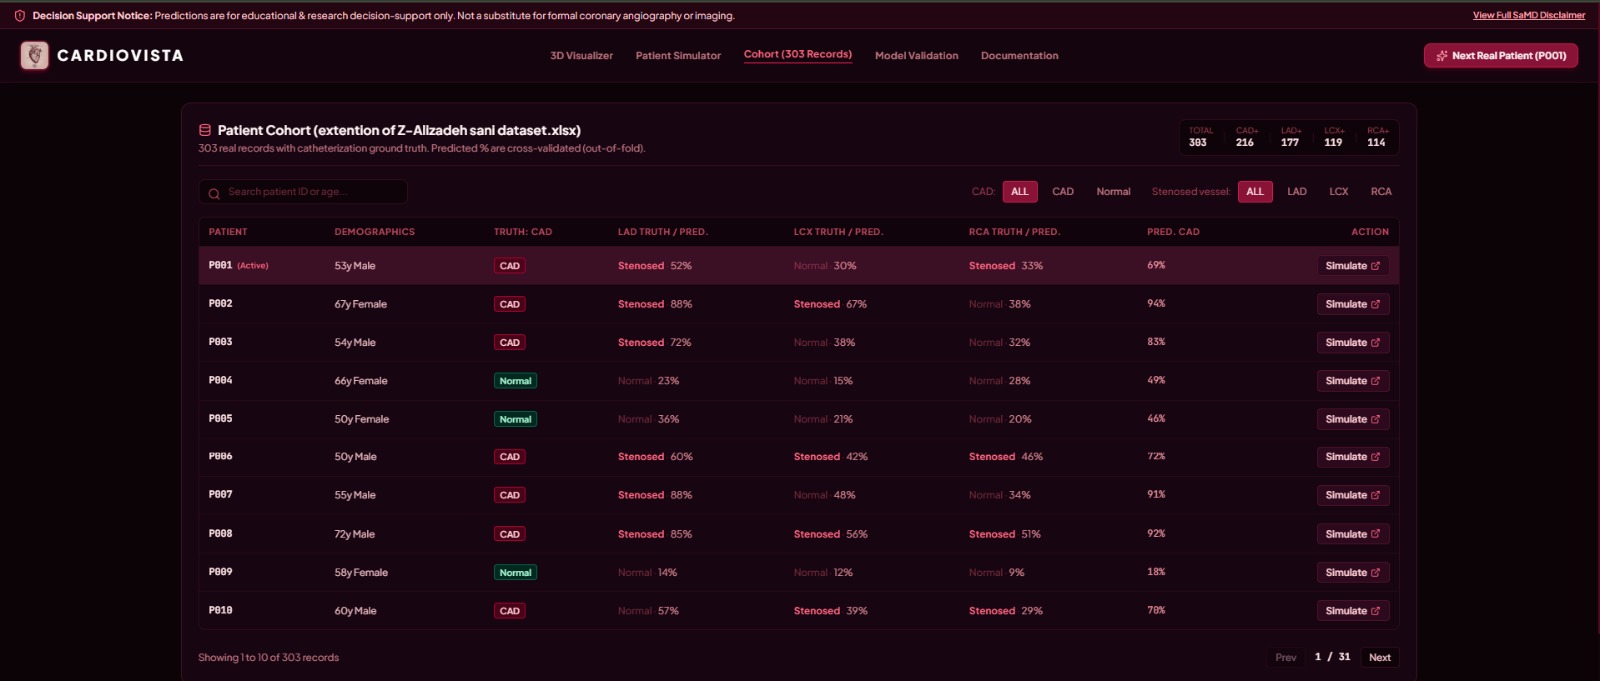
cohort (records)

Inspiration
Coronary artery disease is a leading cause of death worldwide, yet risk models usually reach people as a single opaque percentage. We wanted a tool that shows risk, and doesn't only state it. The usual diagnostic route is invasive angiography. We asked whether routine clinical data (age, blood pressure, lipids, ECG findings, echo) could point to where in the heart the problem might be. We also wanted every prediction to be explainable, so a student or clinician can see why the model said what it said.
What it does
CardioVista is an interactive 3D cardiovascular risk explorer. You enter a patient's clinical values, or pick someone from the cohort. Four models then predict the chance of significant (≥50%) stenosis overall (CAD) and in each of the three main arteries (LAD, LCX and RCA). Those probabilities colour the arteries on a 3D heart, so risk is visible at a glance. Clicking a vessel opens a detail view. Every prediction comes with exact SHAP values, shown as a waterfall chart, that show which factors pushed the risk up or down. There's also a what-if simulator, a cohort table, and a model evaluation dashboard with ROC curves and confusion matrices. The app never uses simulated patients: it trains only on the real Z-Alizadeh Sani dataset.
How we built it
• Frontend: React 19, TypeScript, Vite and Tailwind. The 3D heart is built with Three.js and procedural geometry. • Machine learning in the browser: We wrote our own L2-regularised logistic regression (Newton–Raphson/IRLS) in TypeScript and checked it against scikit-learn on identical data. The coefficients agree to about 1e-7. • Data pipeline: We parse the UCI .xlsx or .csv directly in the browser, then encode, impute and standardise it. The scaler is fitted on training folds only. • Validation: Nested stratified 5-fold cross-validation chooses the regularisation strength (λ) on training data only. All reported metrics come from out-of-fold predictions: accuracy, precision, recall, specificity, F1, ROC-AUC, confusion matrix and ROC curve. • Explainability: For a linear model, SHAP values have an exact closed form. We compute them directly and verify that they sum to the model output. • Reproducibility: A deterministic command-line self-check (seed 42) reproduces every number outside the browser.
*Data source and storage: * We used the real Extension of the Z-Alizadeh Sani Dataset from the UCI Machine Learning Repository (303 patients, 59 clinical features). There is no backend database. The dataset ships as an .xlsx file in the repo, or users upload it in the app. It’s parsed and held in memory in the browser, so patient data never leaves the user’s device.
Challenges we ran into
• Target leakage. The dataset contains the answers (LAD, LCX, RCA, Cath) as columns. We had to remove them from the inputs and add a leakage audit, or the models would have looked perfect. • Honest evaluation. With only 303 patients, tuning and testing on the same data inflates results. Nested cross-validation fixed this but made the pipeline more complex. • Real-world data in the browser. We had to parse Excel files, mixed Y/N and numeric columns, formula cells (BMI) and missing values without a backend. • Performance. Training and cross-validating four models client-side had to finish in seconds and show progress. • 3D rendering. Building a readable, schematic coronary tree whose colours update live with predictions took a lot of tuning.
Accomplishments that we're proud of
• A fully transparent pipeline: no black boxes, no fake data, and every metric reproducible from one command. • Exact, verified SHAP explanations rather than approximations. • A 3D visualization that turns four model outputs into something intuitive. • A working in-browser ML stack with no server, so patient data never leaves the user's machine.
What we learned
• Leakage and validation design matter more than model choice. A simple regularised linear model, evaluated properly, beats a flashy one evaluated badly. • Interpretability builds trust: seeing why a prediction was made makes the output far more useful than the number alone. • Browsers are capable ML platforms for small tabular problems. • Responsible framing matters. A health tool needs clear limits and a disclaimer, which is why CardioVista states that it's an educational prototype and not a diagnostic device.
What's next for CardioVista
• External validation on data from other hospitals, since our 303 patients come from a single centre. • Richer models such as gradient boosting or interaction terms, still with SHAP explanations. • Better anatomy: predict stenosis severity and position within each artery, and use patient-specific 3D geometry from imaging. • Calibration and uncertainty shown on each prediction, such as confidence intervals. • Clinician feedback and usability testing, plus support for importing records in standard formats like FHIR.
Built With
- html
- lucide
- motion
- node.js
- react
- shap
- tailwind
- typescript
- vite

Log in or sign up for Devpost to join the conversation.