-
-
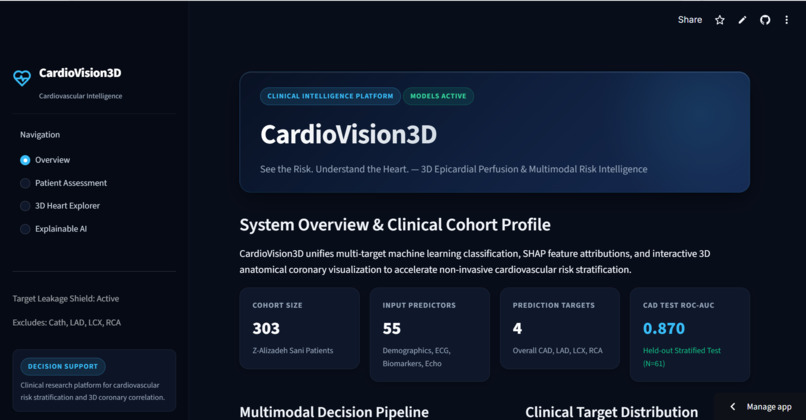
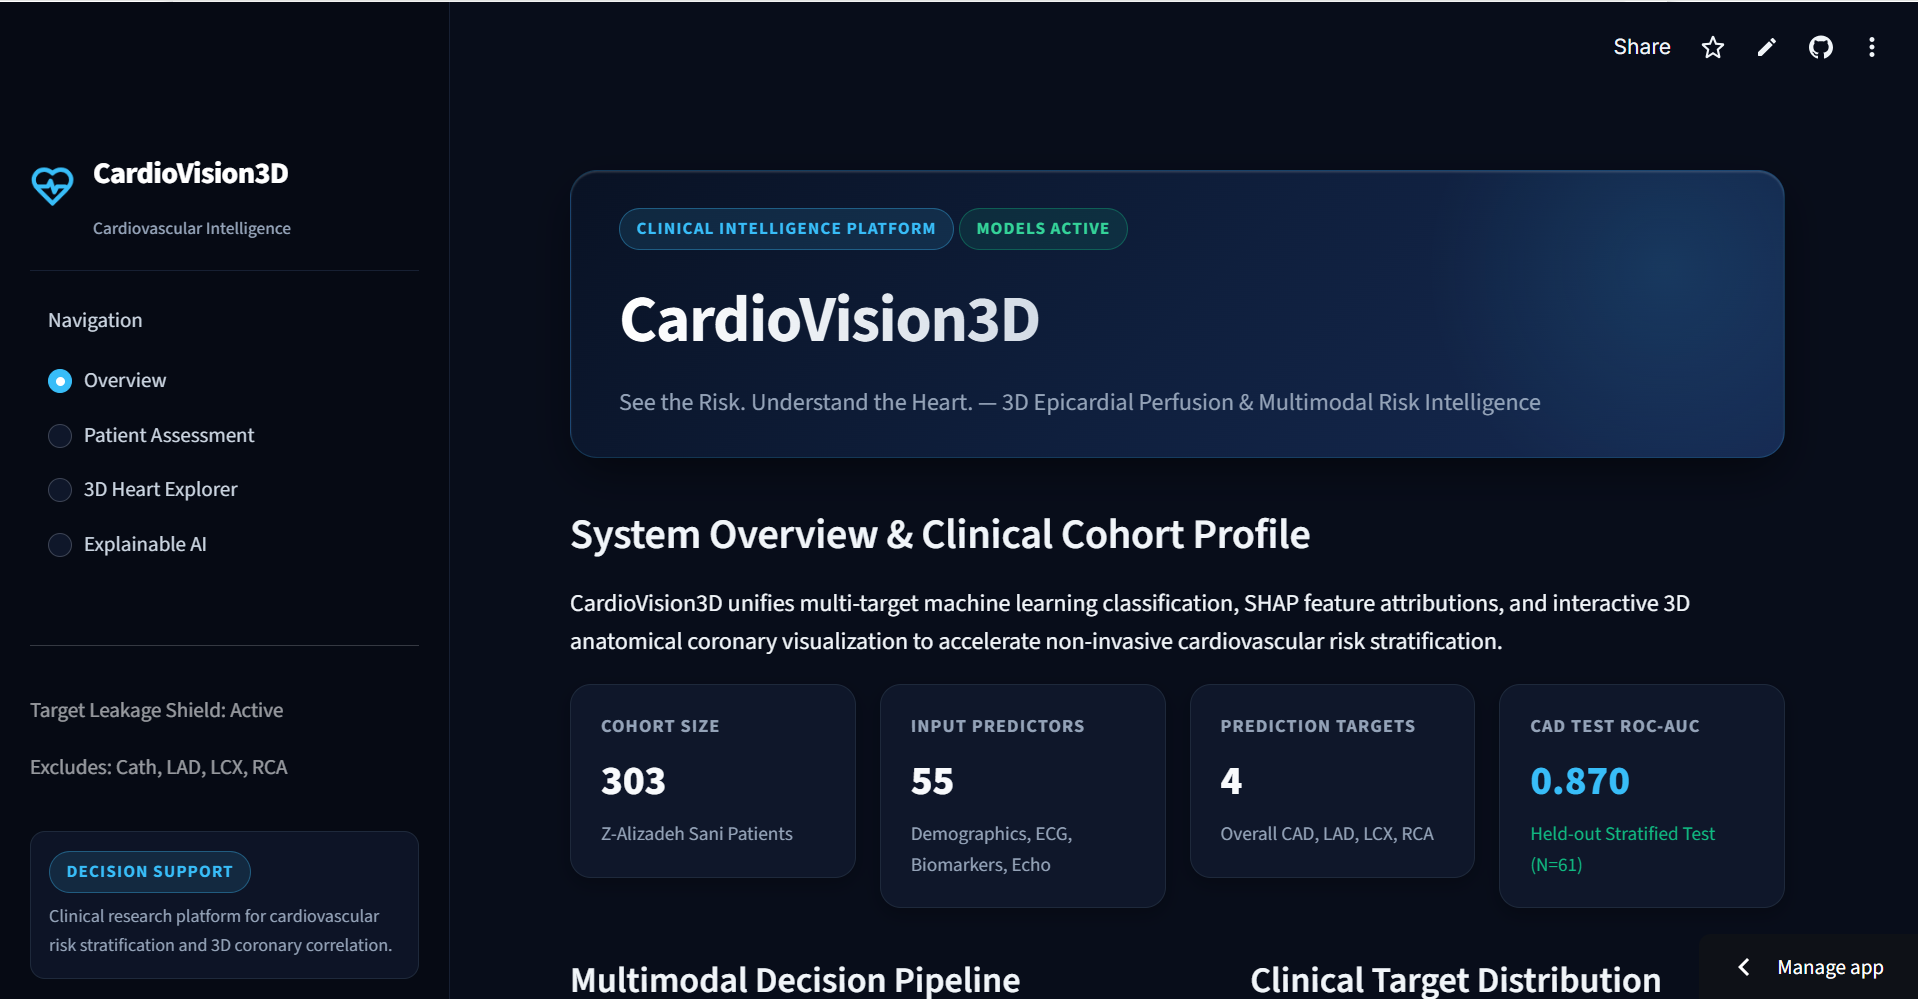
Overview Dashboard
-
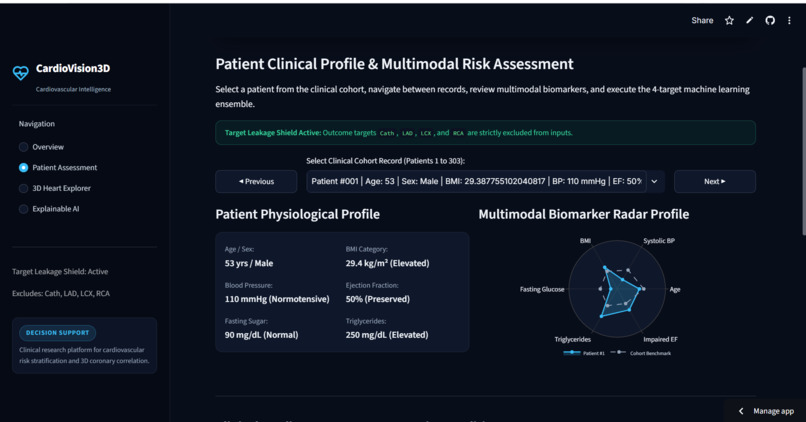
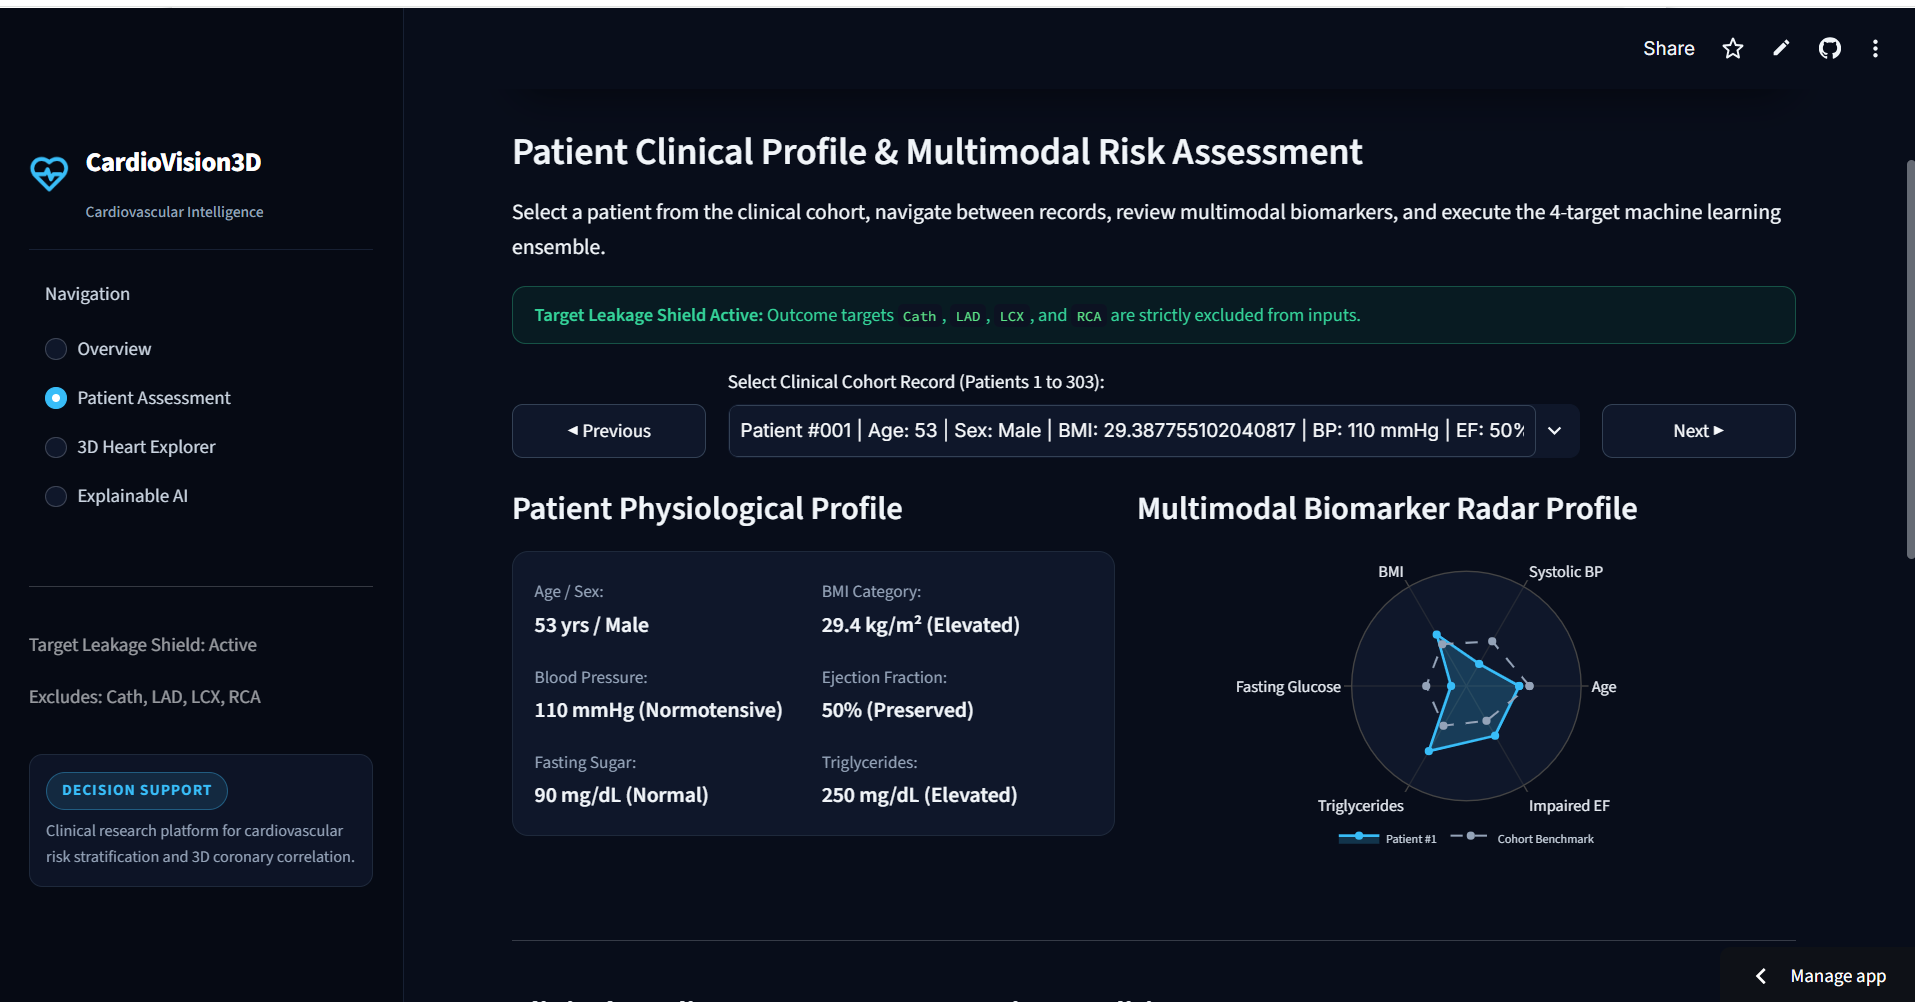
Patient Dashboard
-
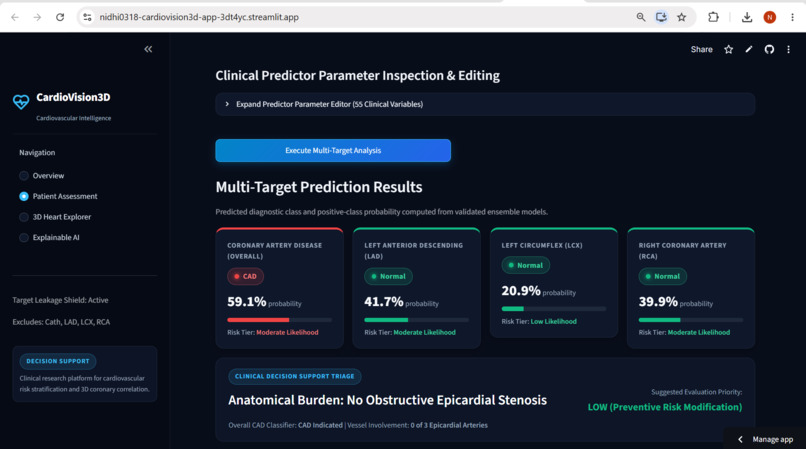
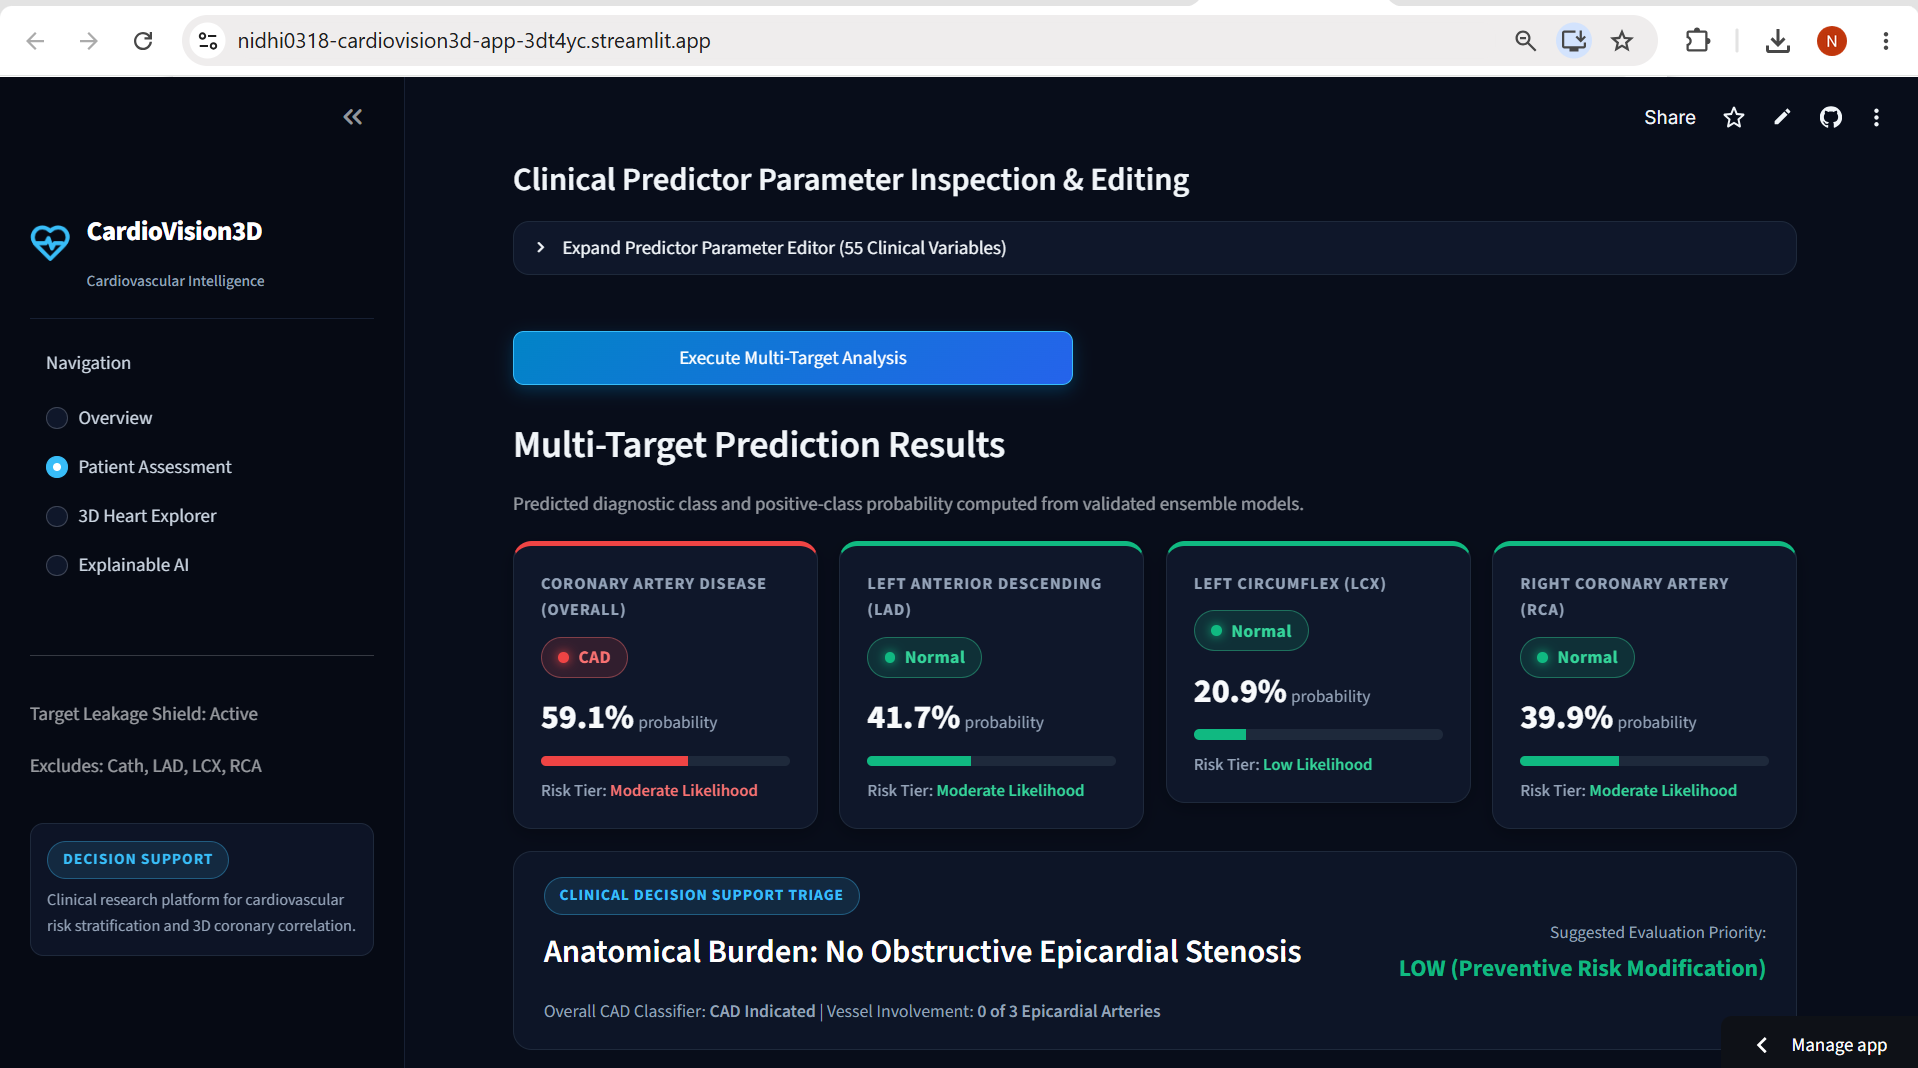
Clinical parameter calculation display
-
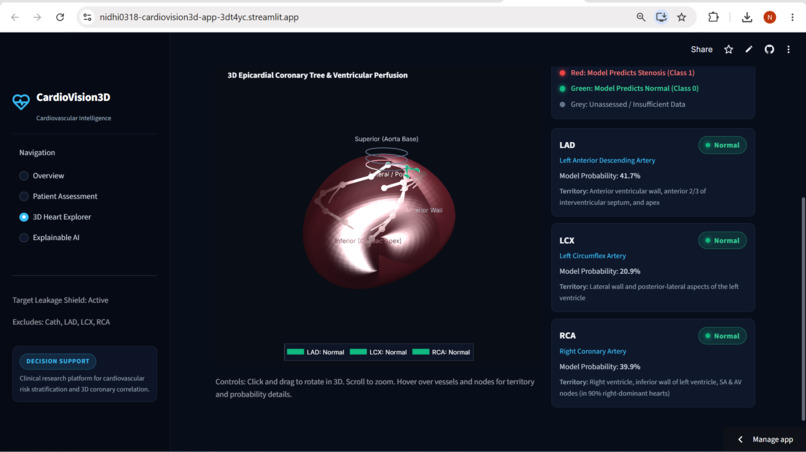
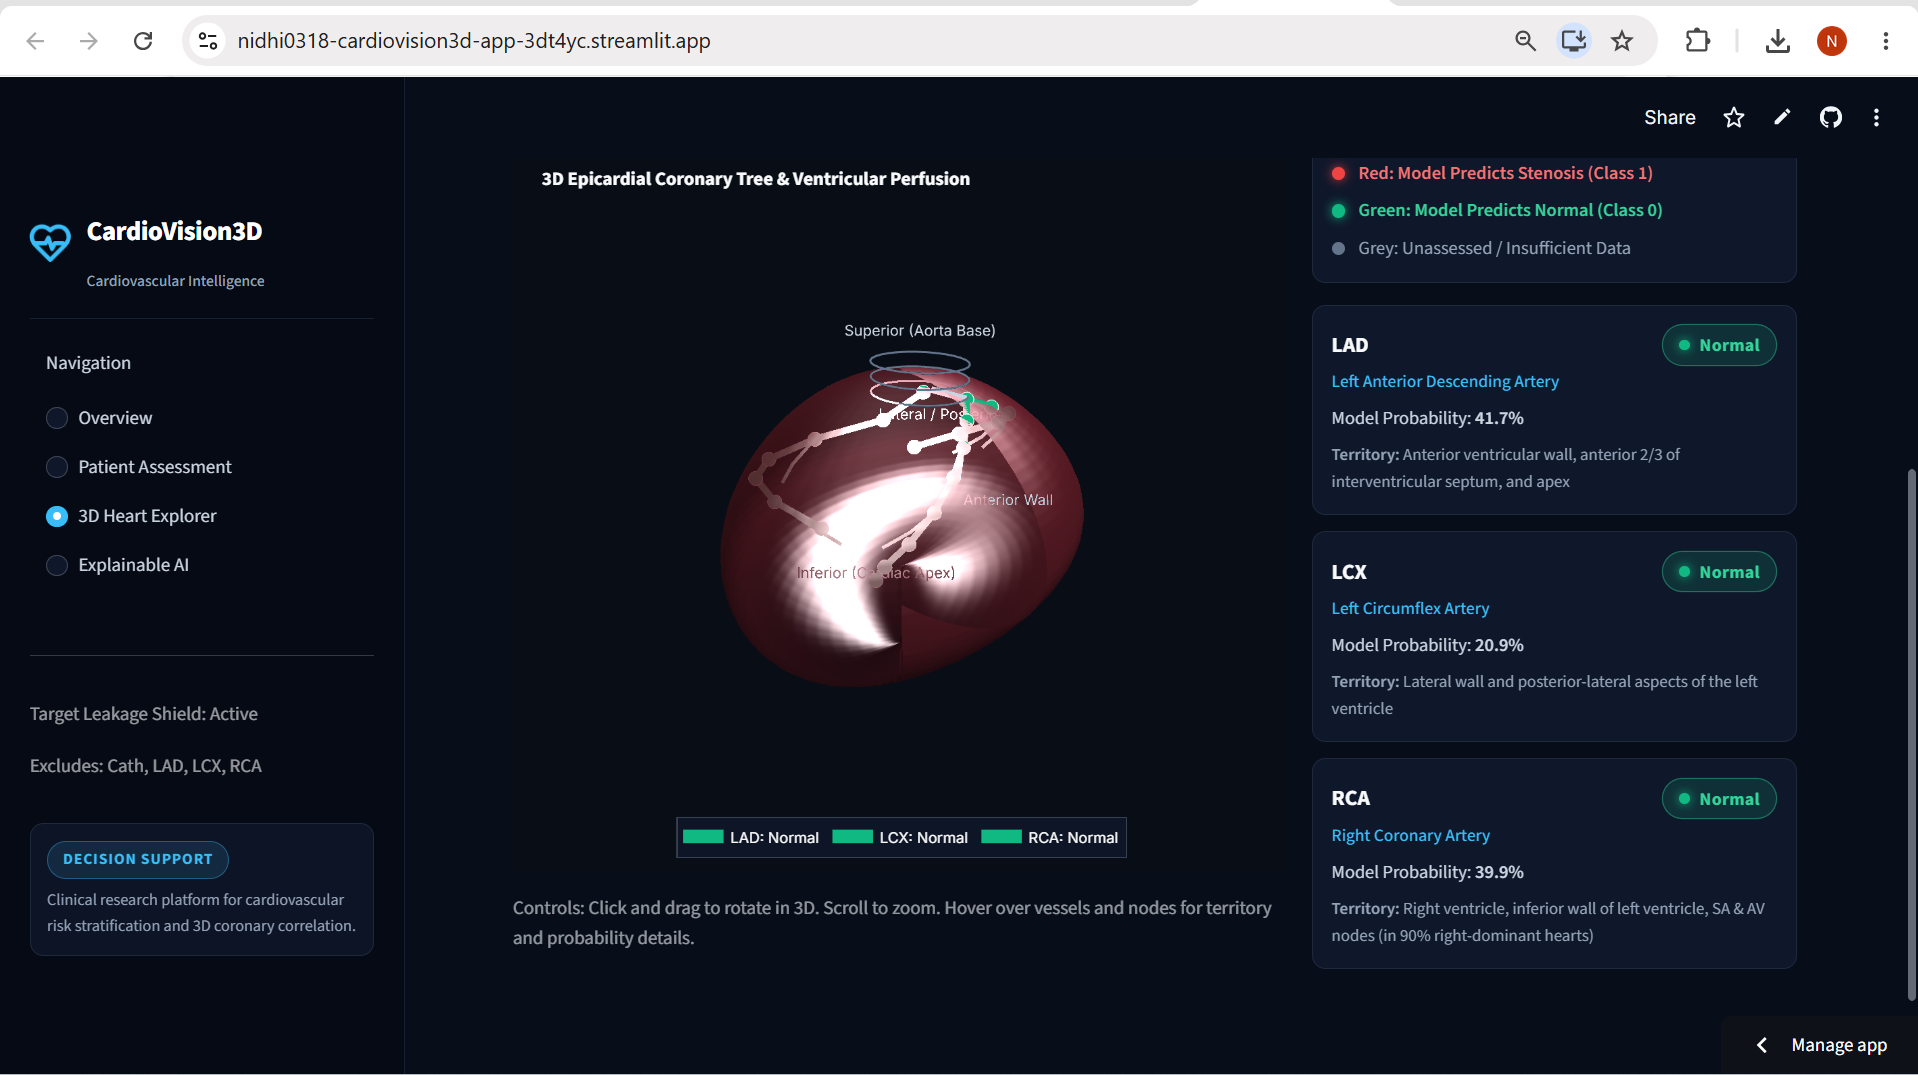
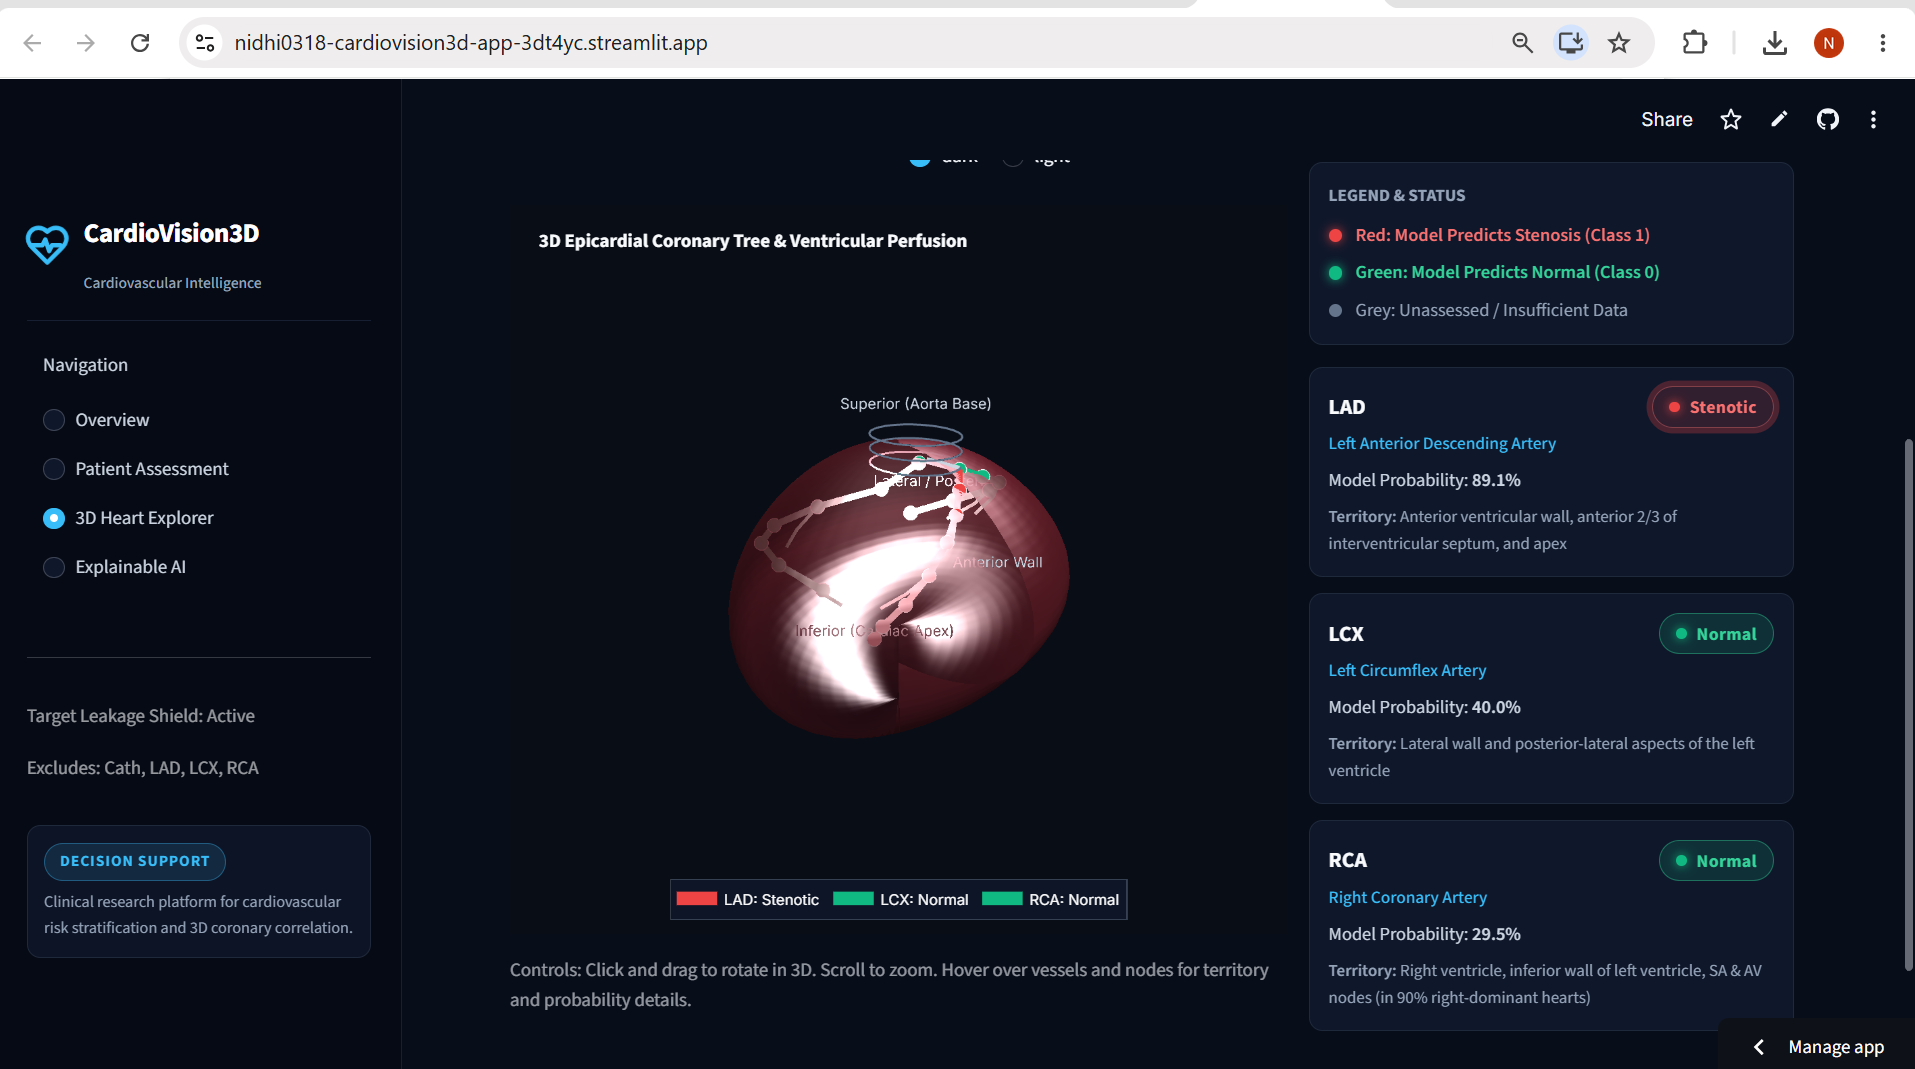
3D Explore of the heart
-
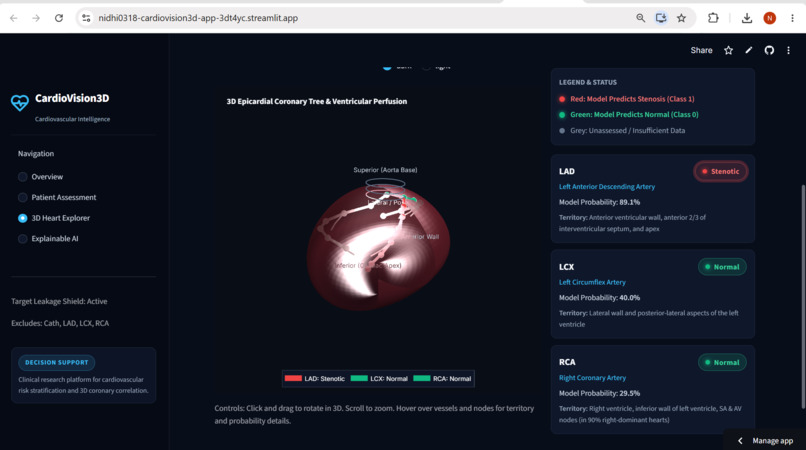
Defect Showed
-
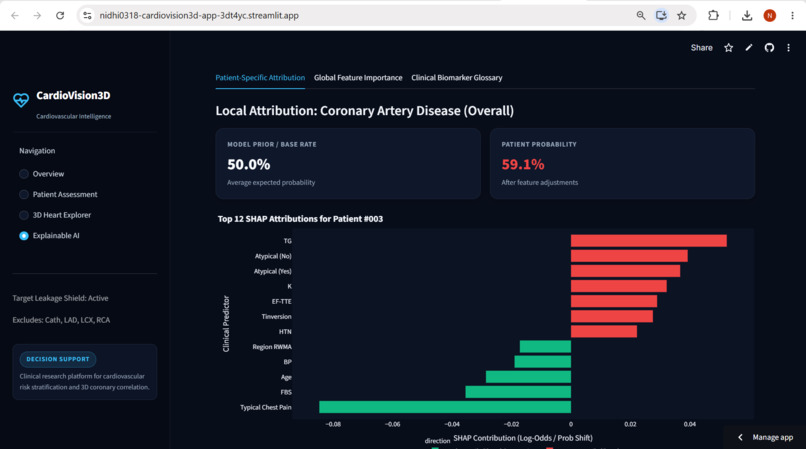
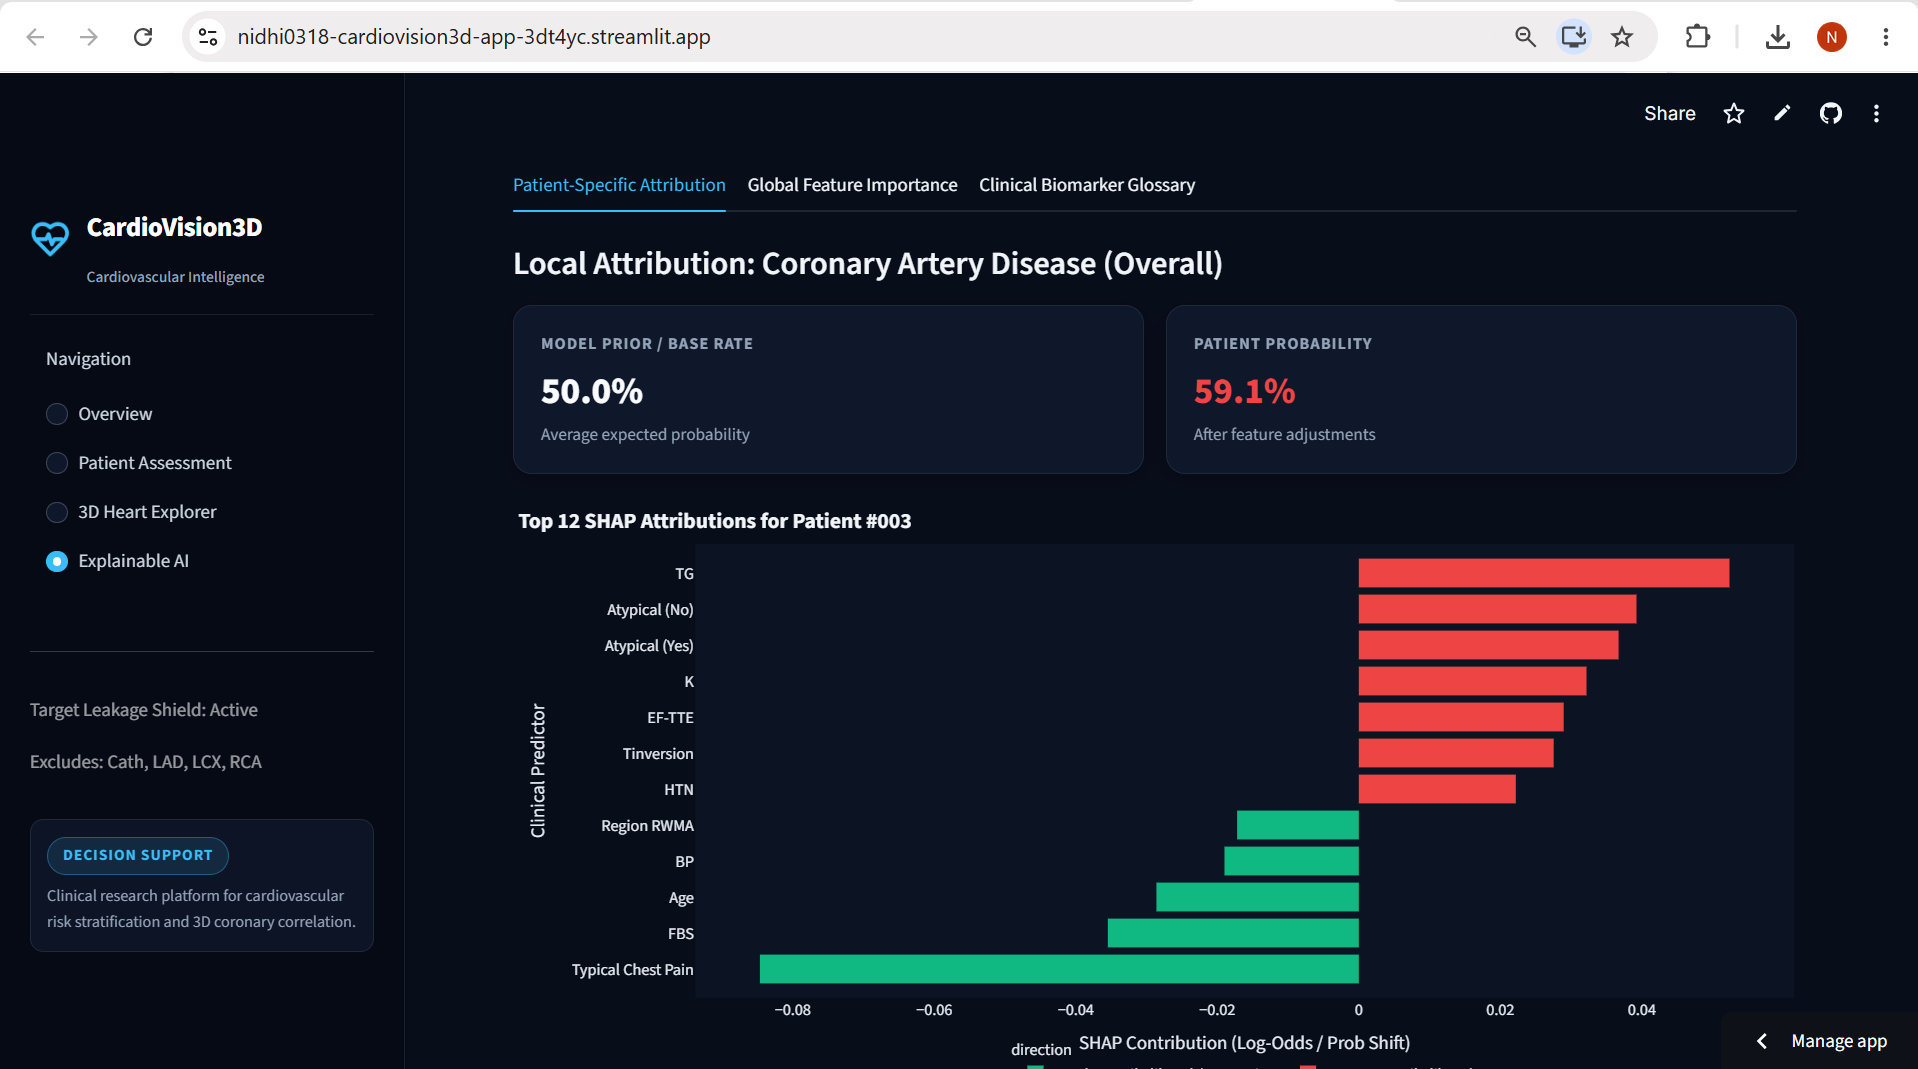
Local Attribution: Coronary Artery Disease
-
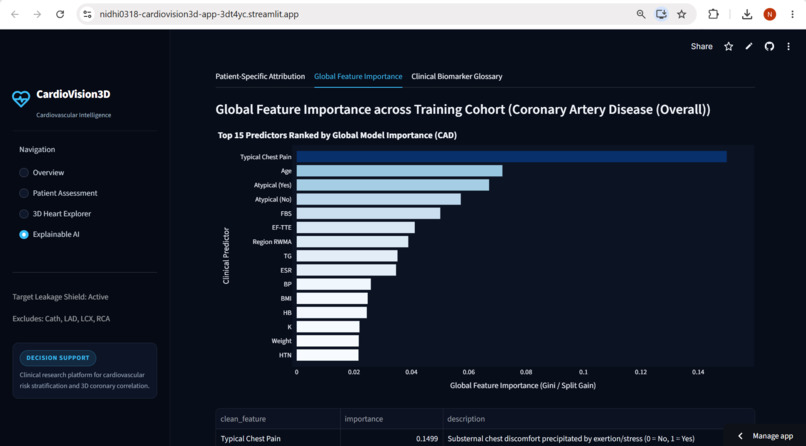
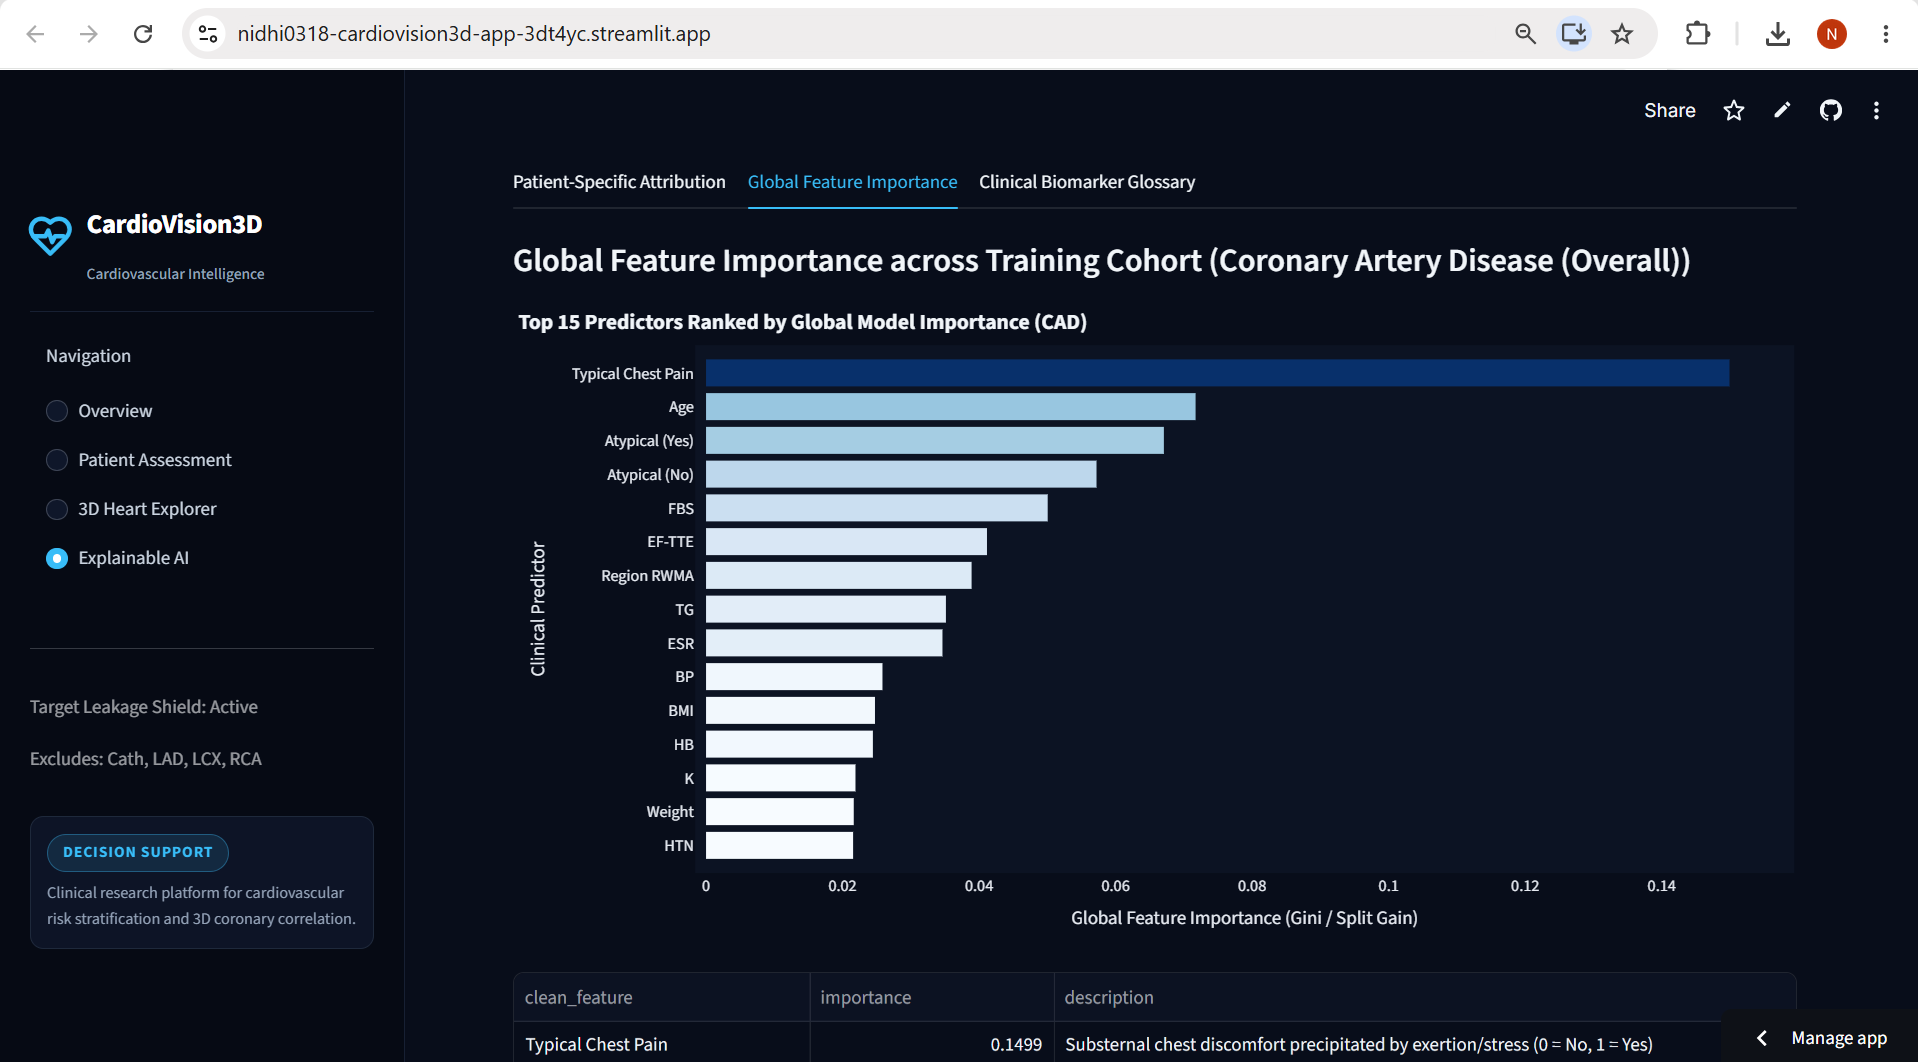
Global Feature importance
-
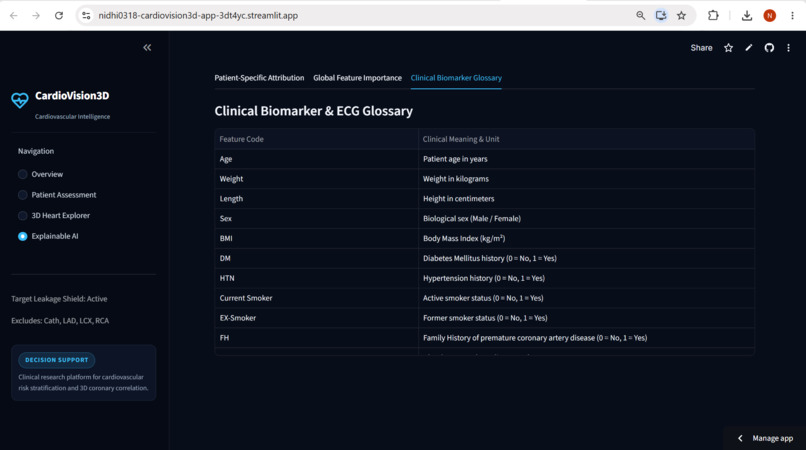
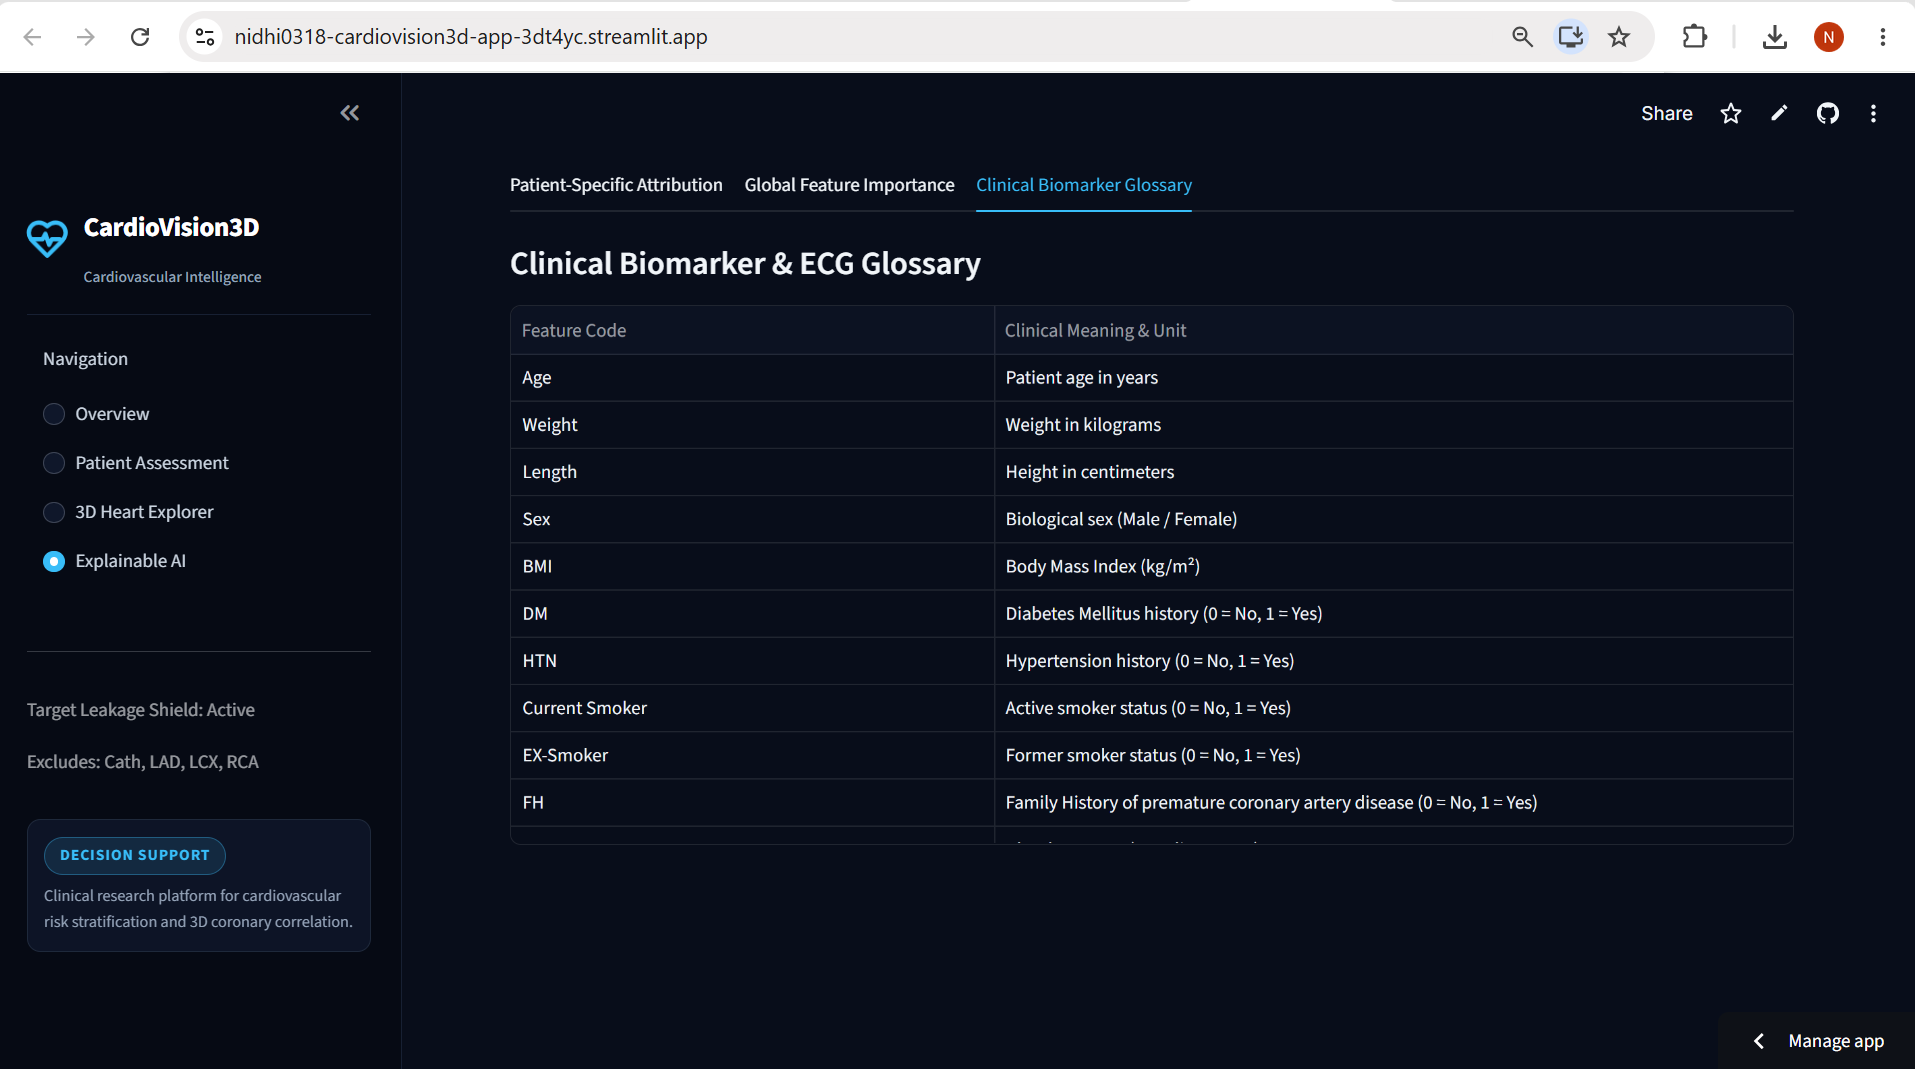
Clinical Biomarker & ECG Glossary
Inspiration
Cardiovascular diseases are a major health concern. I wanted to explore how AI could help analyze cardiovascular data and make machine learning predictions easier to understand through interactive visualization.
What It Does
CardioVision3D combines machine learning, explainable AI, and interactive 3D heart visualization. It explores cardiovascular indicators and supports predictions for Cath, LAD, LCX, and RCA using clinical and laboratory features from the Z-Alizadeh Sani dataset.
How We Built It
The project uses Python, pandas, NumPy, scikit-learn, Streamlit, and Plotly. We developed data preprocessing and model training pipelines, evaluated predictions using performance metrics, and created an interactive schematic of the heart. SHAP and LIME can provide feature-level explanations when integrated into the prediction workflow.
Challenges
Key challenges included preprocessing clinical data, preventing target leakage, handling different prediction targets, evaluating model performance, and connecting model outputs with clear visualizations.
What I Learned
This project helped me understand machine learning workflows, clinical data analysis, model evaluation, explainable AI concepts, and interactive application development. It also reinforced the importance of transparency, responsible AI, and honest reporting of model limitations.
Future Scope
Future improvements include stronger model validation, enhanced explainability, better 3D visualization, and secure deployment.
Disclaimer: CardioVision3D is an experimental educational and research project, not a clinically validated diagnostic tool. Its predictions should not replace professional medical advice.
Built With
- 3dvisualization
- artificial-intelligence
- datascience
- datavisualixation
- git
- github
- lime
- machine-learning
- numpy
- pandas
- plotly
- python
- scikit-learn
- shap
- streamlit


Log in or sign up for Devpost to join the conversation.