CARDIOVISION X
Inspiration Cardiovascular diseases are among the major health challenges worldwide, and understanding coronary artery disease can be complex for both patients and healthcare professionals. We were inspired by the idea of combining Artificial Intelligence, explainable machine learning and interactive 3D visualization to make cardiovascular data easier to understand and explore. We wanted to build more than a conventional prediction system. The intention was to create a platform that not only estimates coronary artery disease risk but also helps users understand the factors influencing its predictions via explanations and visual representations of the heart.
What we built
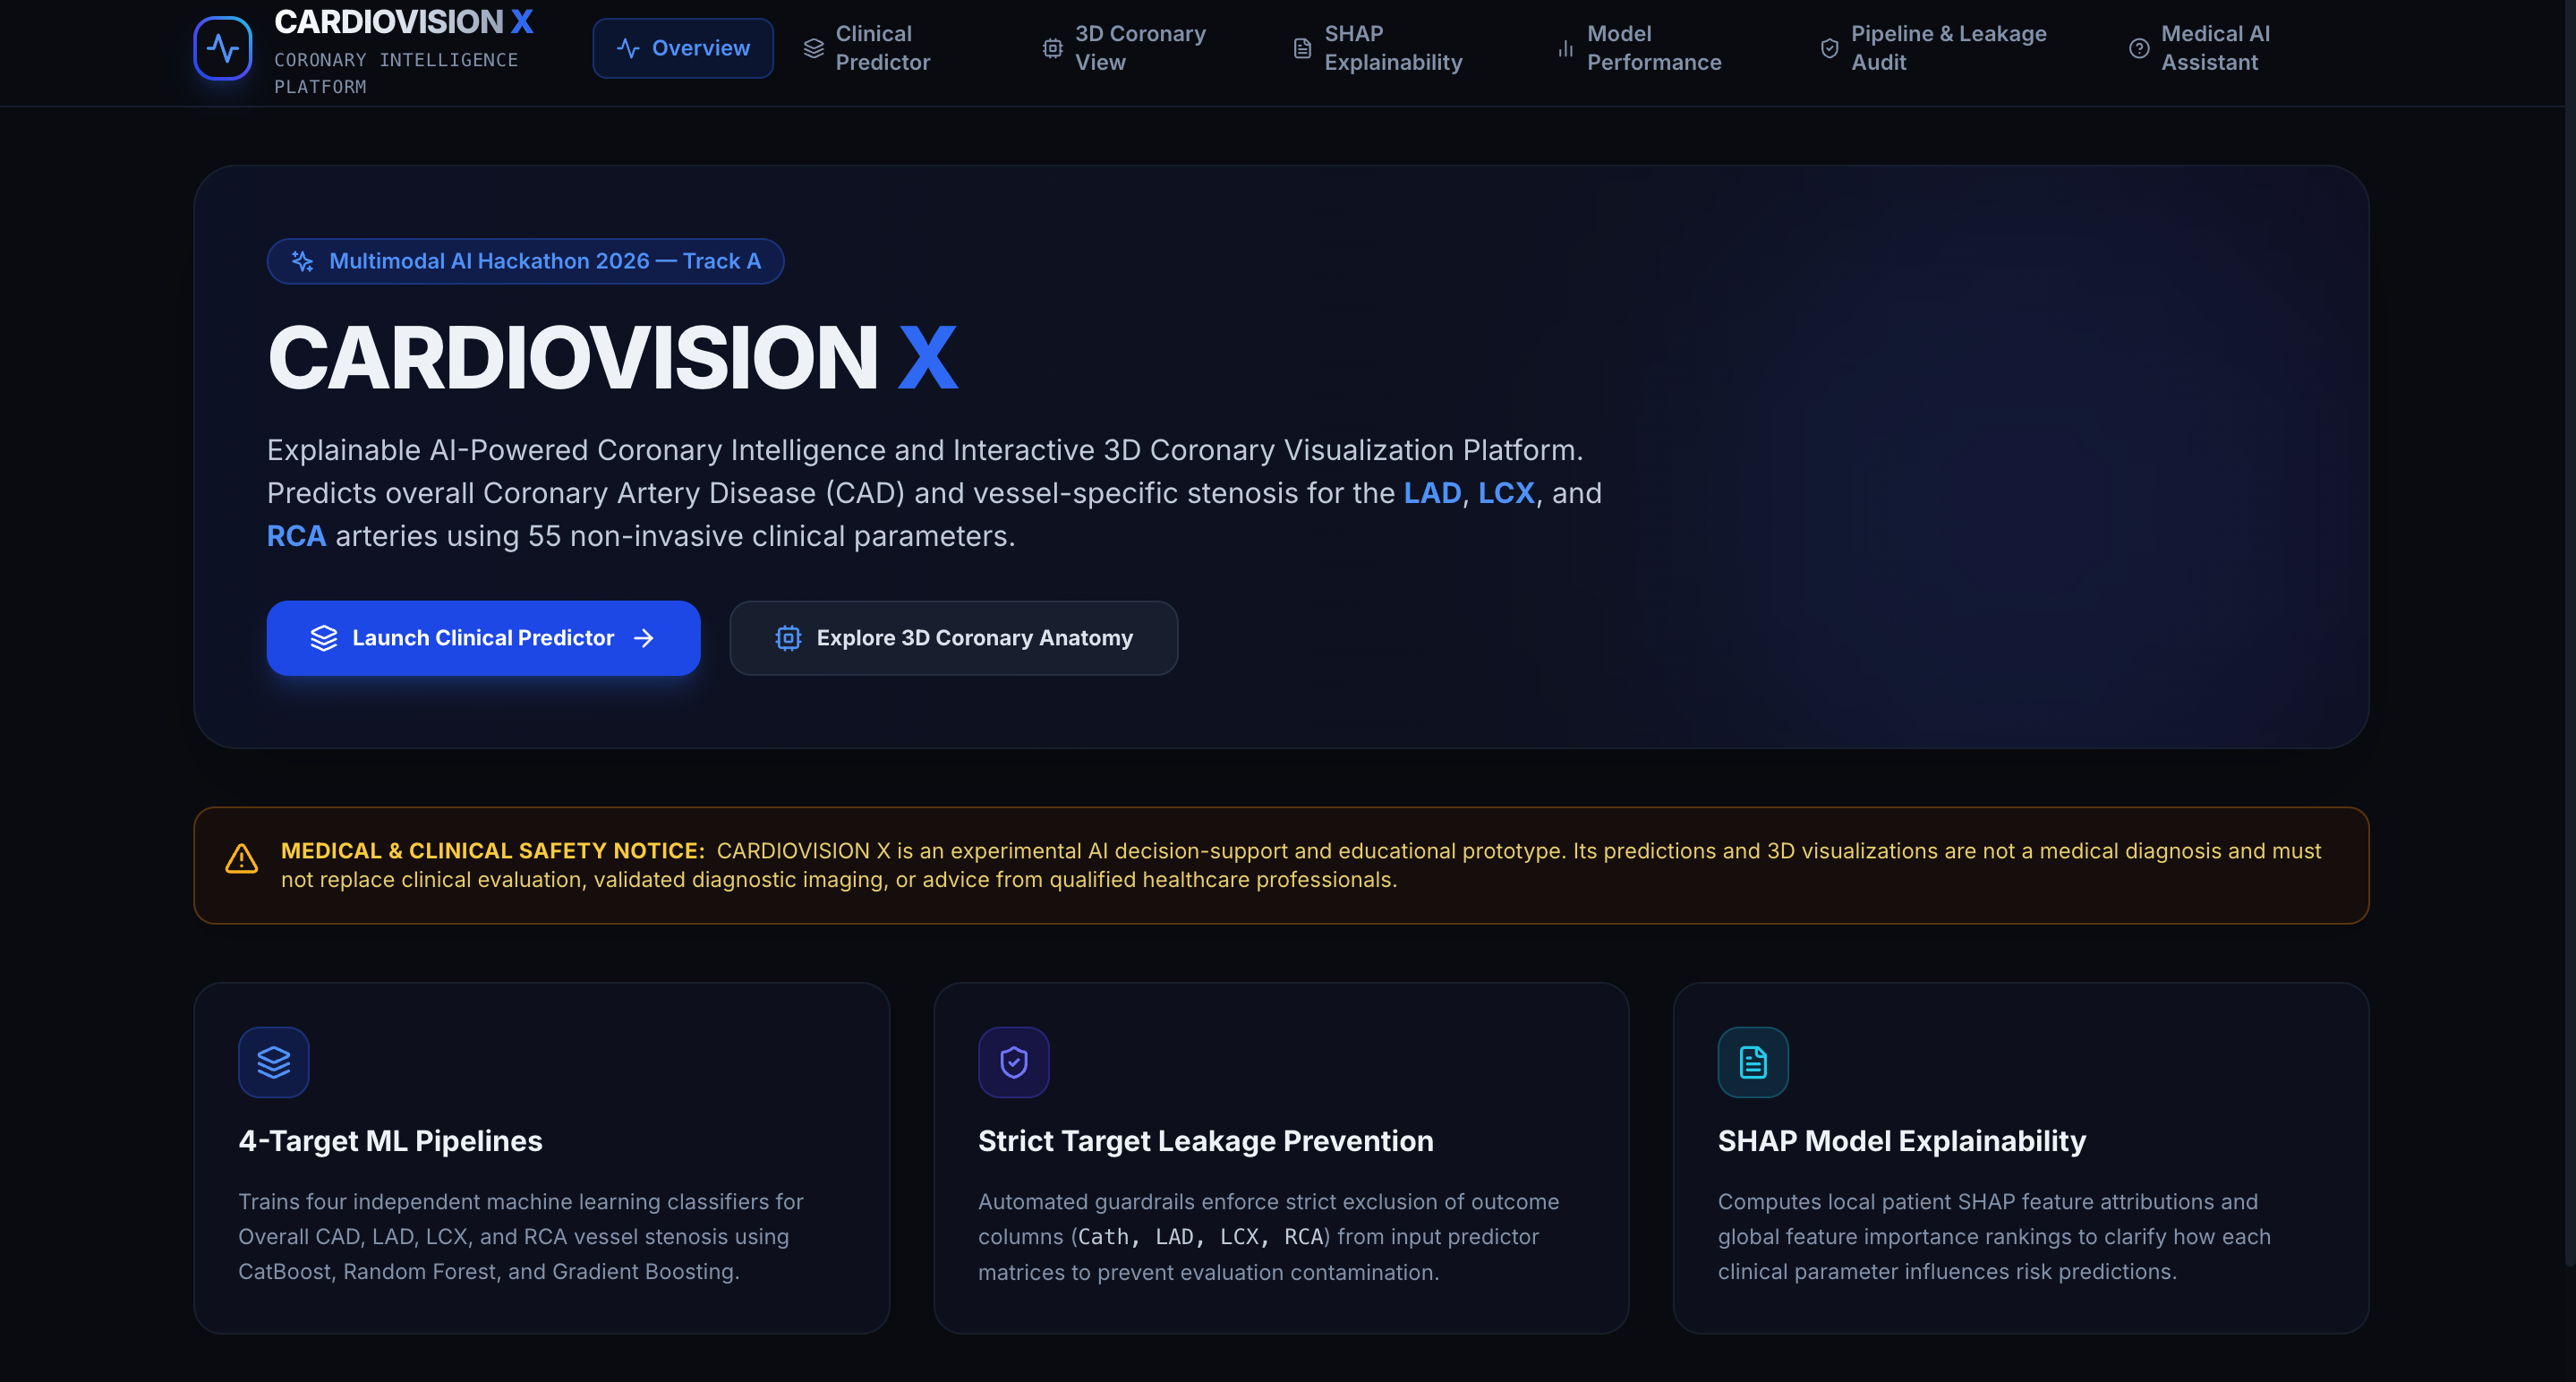
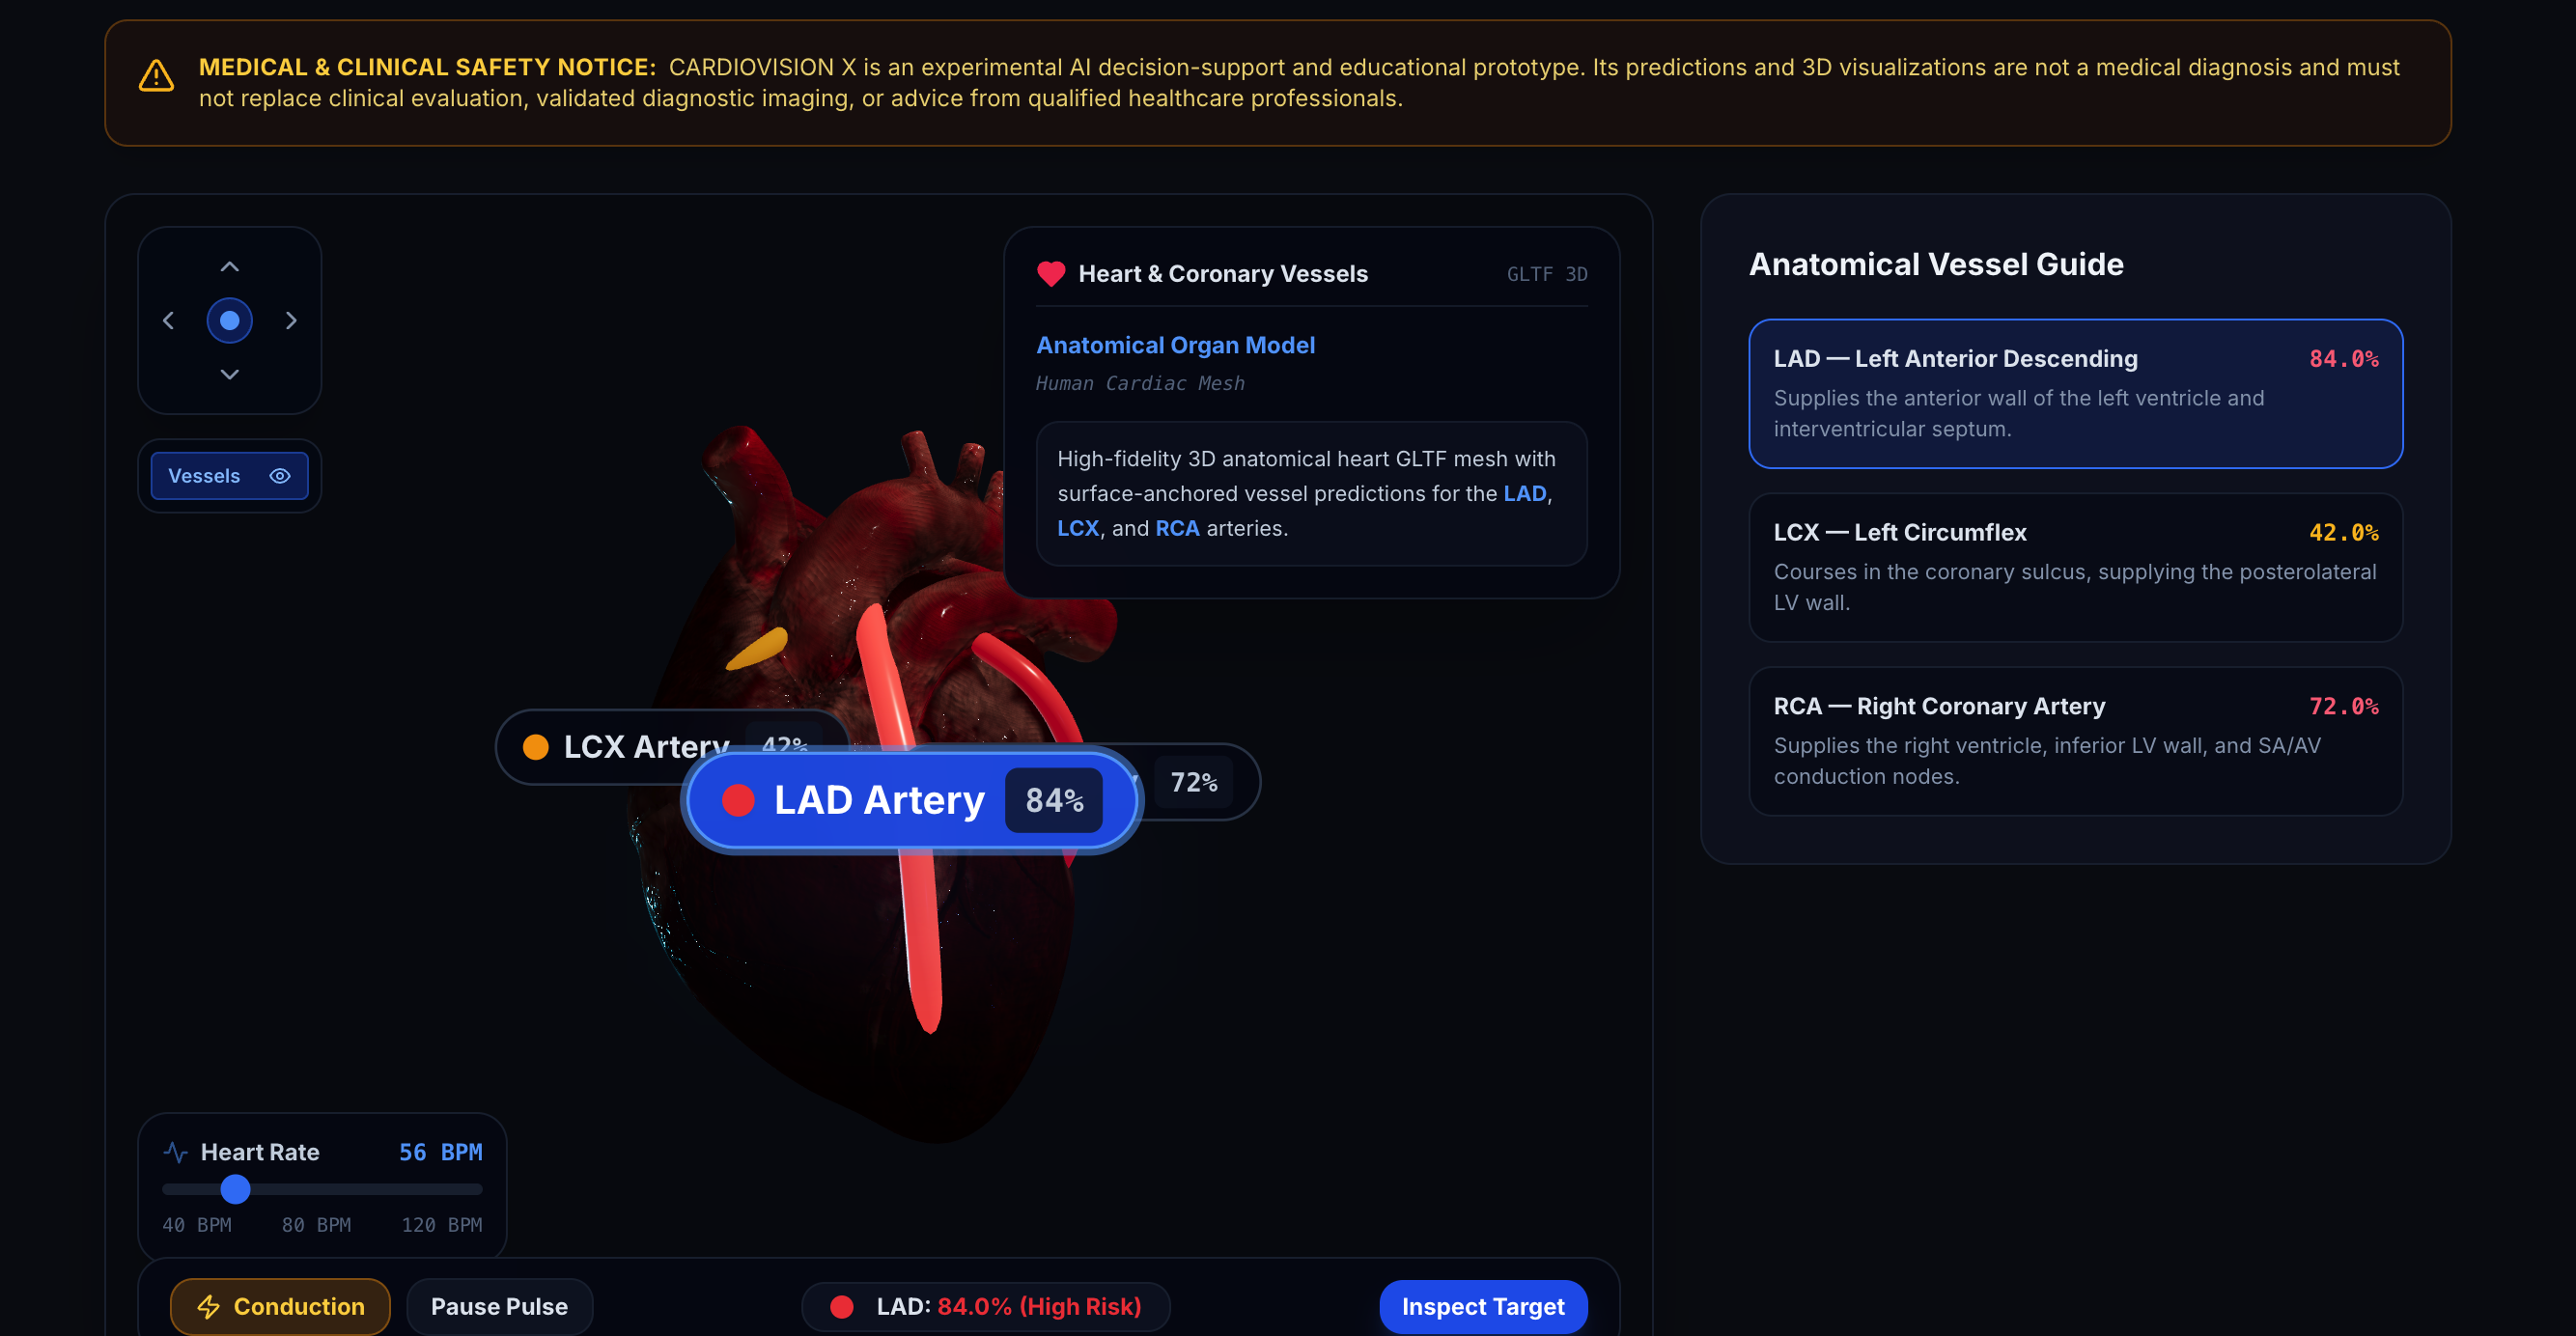
CARDIOVISION X — Explainable AI-Powered Coronary Intelligence and 3D Visualization Platform is an AI-driven prototype exploring cardiovascular risk assessment through data analysis, machine learning, and interactive anatomical visualization. The platform focuses on overall coronary artery disease (CAD) and three major coronary arteries: the Left Anterior Descending (LAD), Left Circumflex (LCX), and Right Coronary Artery (RCA).
Our project highlights several key capabilities:
- AI-powered risk assessment: Machine learning models analyze relevant clinical features to estimate coronary disease probabilities.
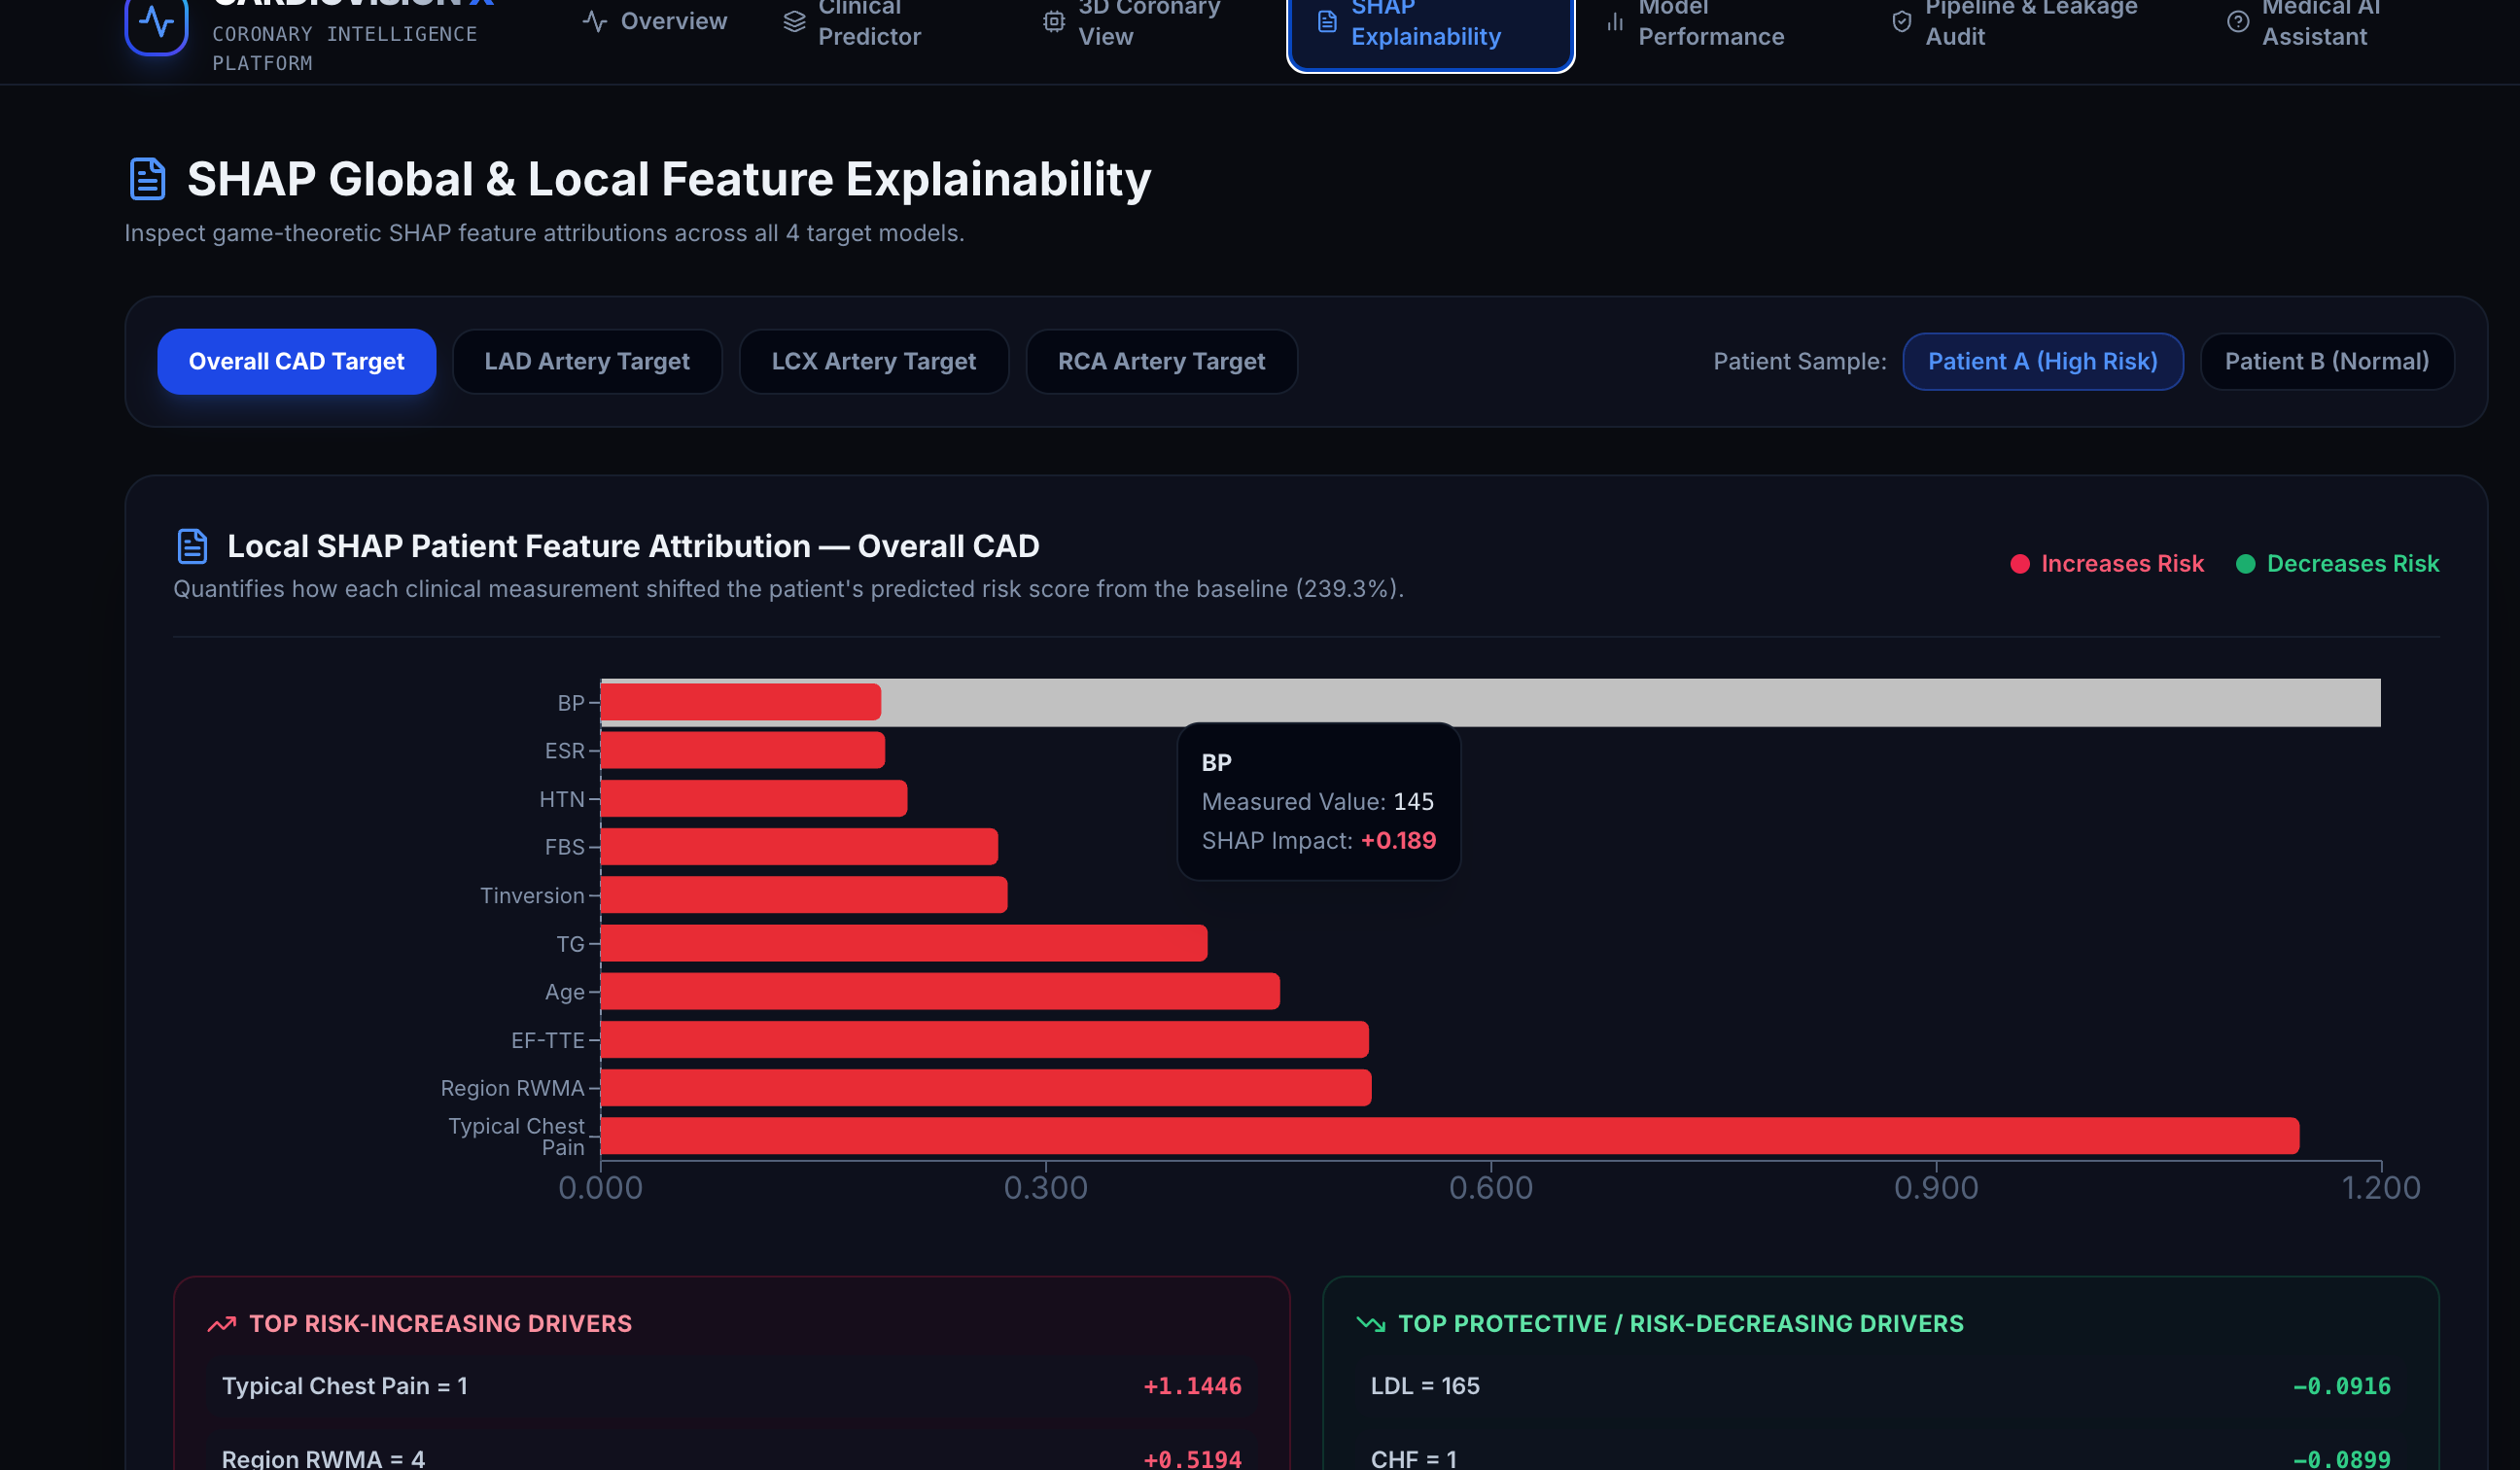
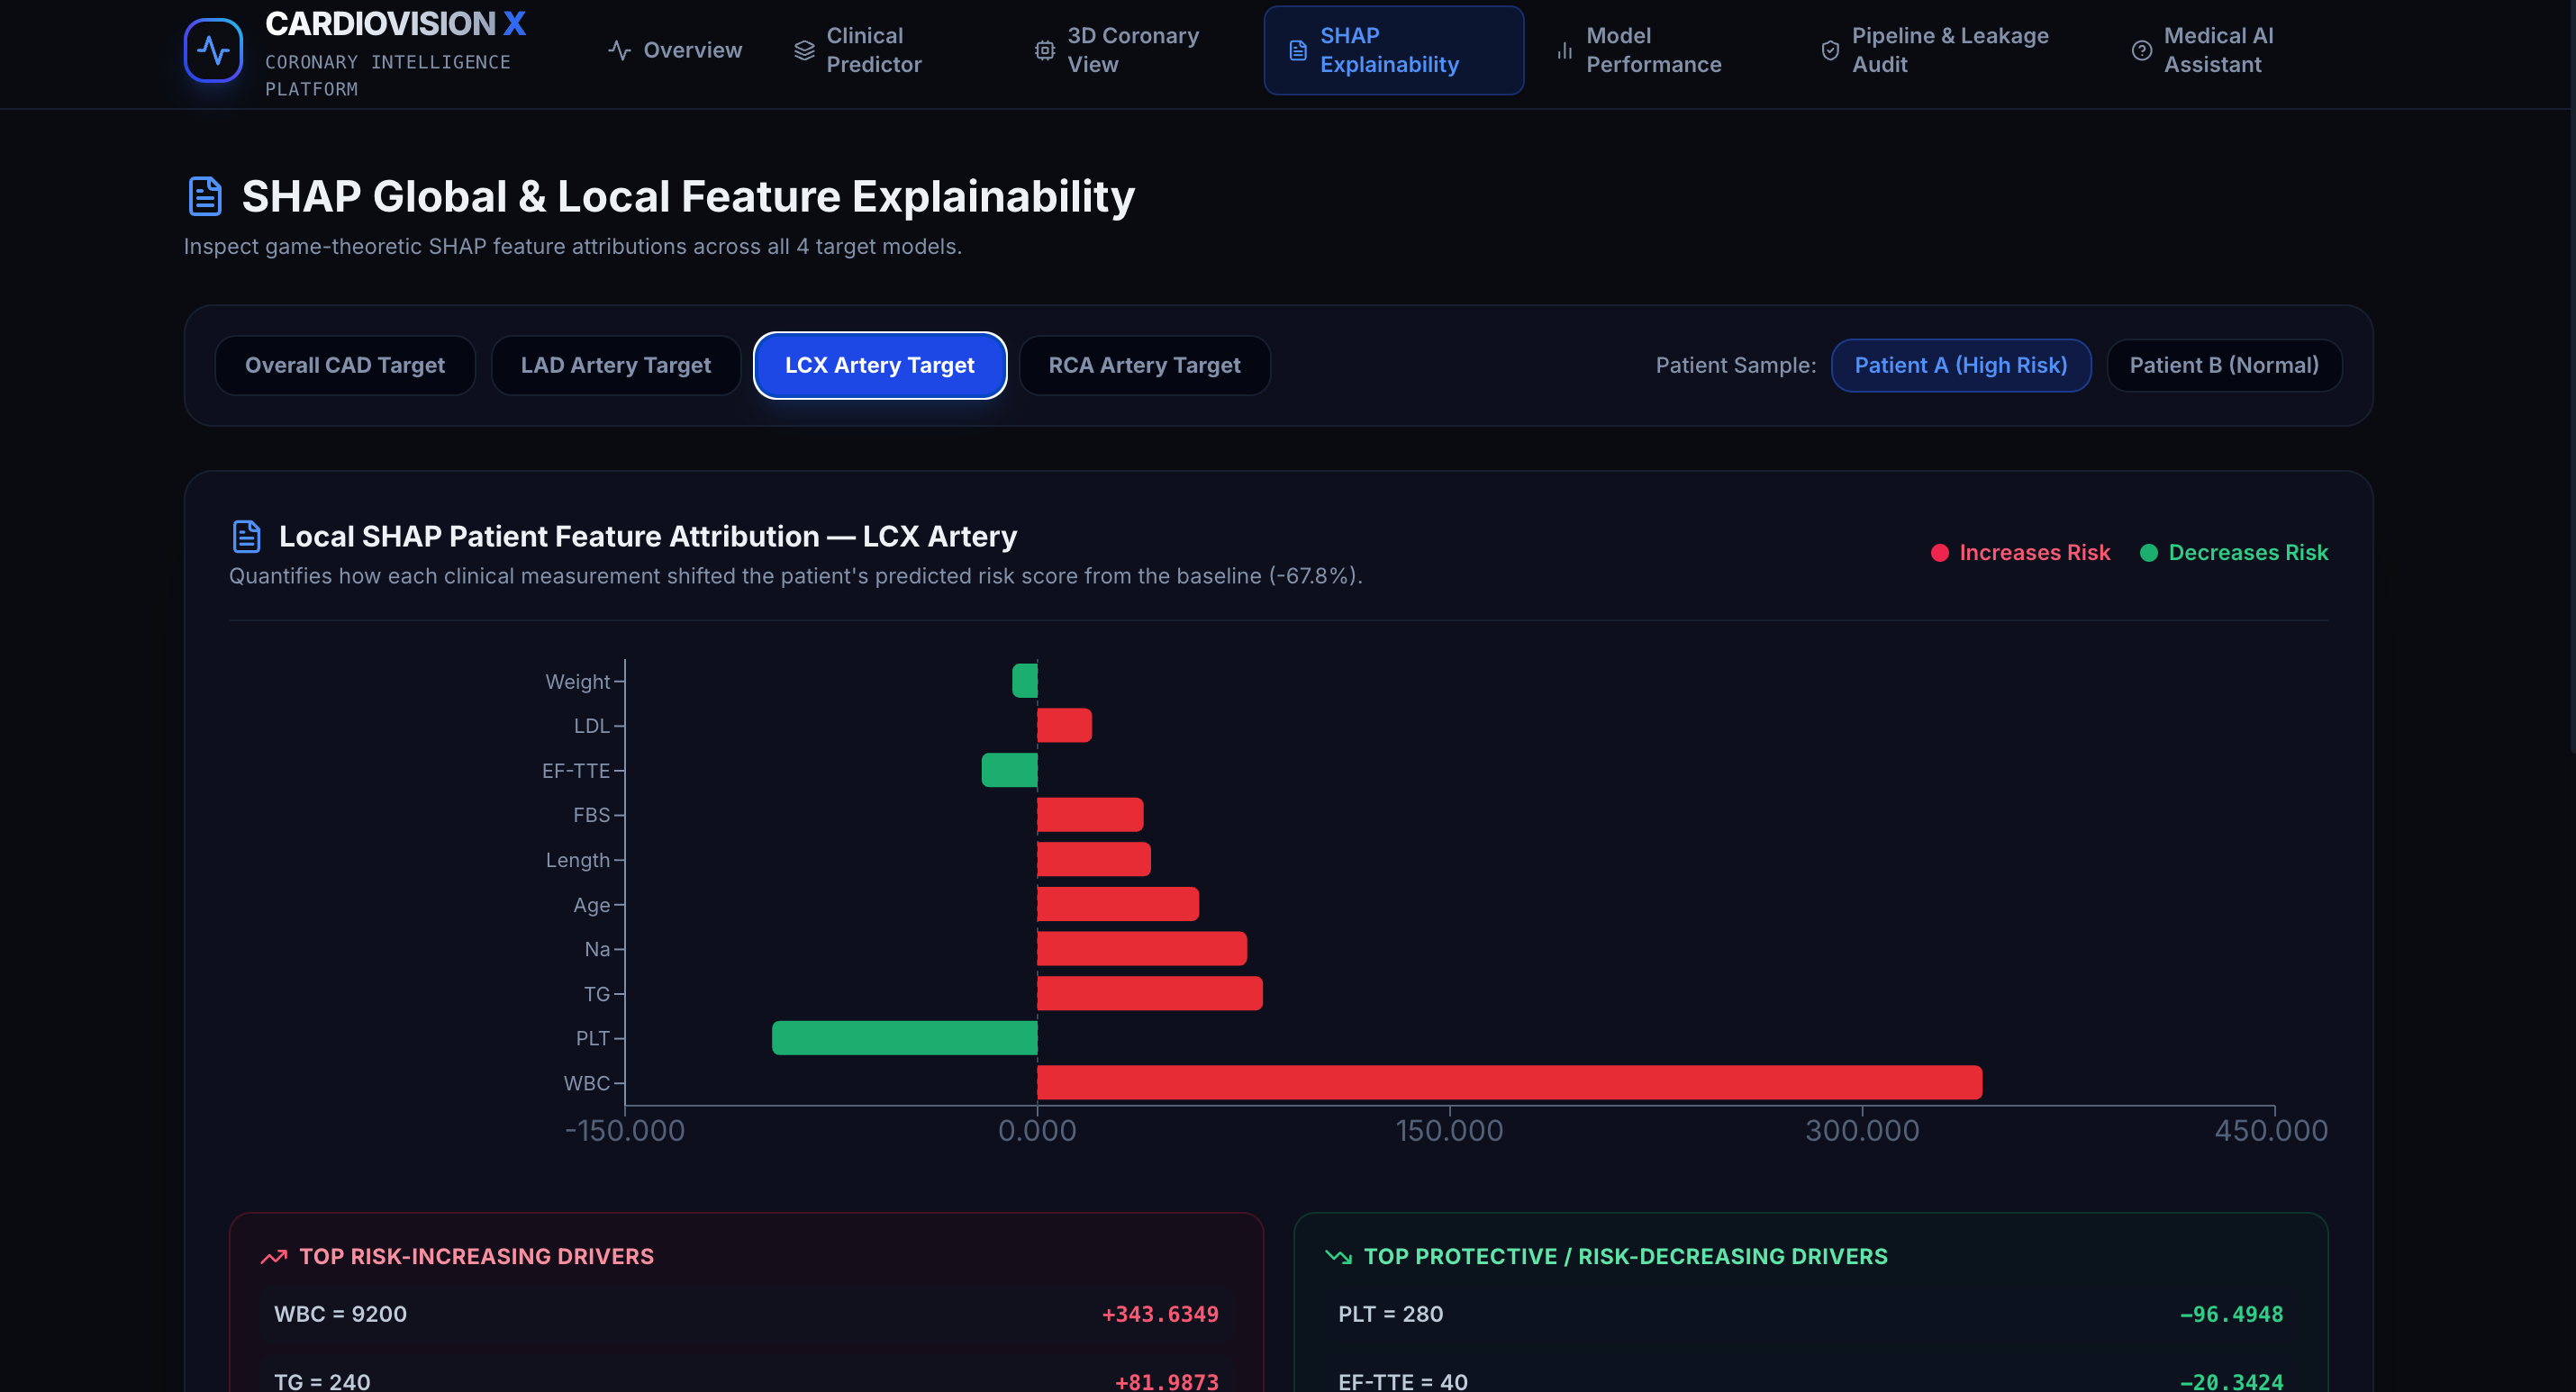
- Explainable AI: SHAP-based explanations help users understand which input features influence a model's predictions.
- Interactive 3D heart visualization: A three-dimensional heart model helps users explore coronary anatomy in a more intuitive and engaging way.
- Model evaluation: Performance metrics help assess the strengths and limitations of the trained models.
- Responsible AI: The platform is designed as an experimental educational and decision-support prototype, not as a replacement for medical professionals or validated clinical diagnosis.
How we built it
We have designed CARDIOVISION X as a full-stack application incorporating a Python machine-learning backend and a web-based interface using React, TypeScript, and modern visualization technologies.
The frontend makes use of React, TypeScript, Three.js and React Three Fiber for the 3D visualization, and the backend employs Python and FastAPI to handle model-related operations and prediction requests.
For machine learning, we explore data preprocessing, feature validation, model training and evaluation using Pandas, NumPy and Scikit-learn, with CatBoost as a candidate model. SHAP is employed to explore prediction explanations.
A principal design consideration is to avoid data leakage. Target labels such as CAD, LAD, LCX, and RCA, and other potentially leakage-prone fields, should not be used as input features in predicting those same targets. We also aim to keep model evaluation transparent and avoid presenting unverified results as established performance.
Challenges we faced
One of our biggest challenges was to bring together multiple technologies into one coherent platform. Building a machine learning model is only one aspect of the process, connecting it to a frontend and presenting meaningful explanations and an intuitive 3D visualization is much more involved.
Another challenge was working with a relatively small clinical dataset. This makes validation, appropriate evaluation metrics, and honest communication of model limitations especially important.
We also learned that medical visualizations need to be presented responsibly. A predicted probability should not be mistaken for a confirmed diagnosis, and a 3D anatomical model should not be seen as identifying a real patient's exact blockage or lesion location unless that information is supported by appropriate data.
These challenges prompted us to think beyond simply making a model output something. We have focused on interpretability, reliability, usability, and responsible presentation.
What we learned
Through this project, we have explored how machine learning, explainable AI, full-stack development, and 3D visualization can come together to address a complex real-world problem.
We learned the importance of data quality, feature selection, model evaluation, frontend–backend communication, and the distinction between a model prediction and a clinically validated conclusion. We also gained an appreciation for how visualization can make technical information easier to explore and understand.
Most importantly, we learned that building AI for healthcare requires more than just accuracy. It requires transparency, care in validation, clear communication, and respect for the limitations of the available data.
FUTURE SCOPE: CARDIOVISION X can be expanded by incorporating a larger and more diverse clinical dataset, external validation, better probability calibration, and clinically reviewed anatomical visualizations. Future versions could explore integration with validated medical imaging workflows, subject to appropriate clinical evaluation, privacy safeguards, and regulatory requirements.
Our long-term vision is to make complex cardiovascular information more understandable through responsible AI and interactive visualization.
OUR VISION: CARDIOVISION X aims to bridge the gap between clinical data, explainable artificial intelligence, and intuitive visualization, to make coronary risk information more accessible and exploratory.
This project is an experimental prototype created for learning, research, and innovation. Its outputs are not medical diagnoses and should not be employed to make treatment decisions without qualified clinical assessment.

Log in or sign up for Devpost to join the conversation.