-
-
Getting Started
-
Dashboard
-
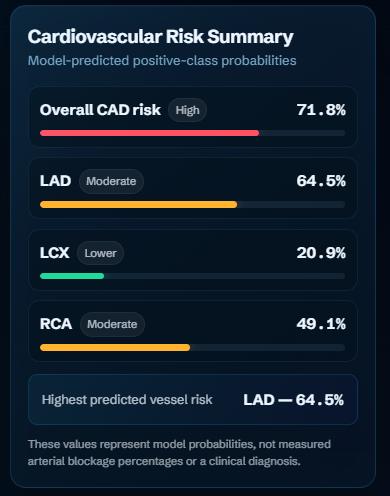
Summary
-
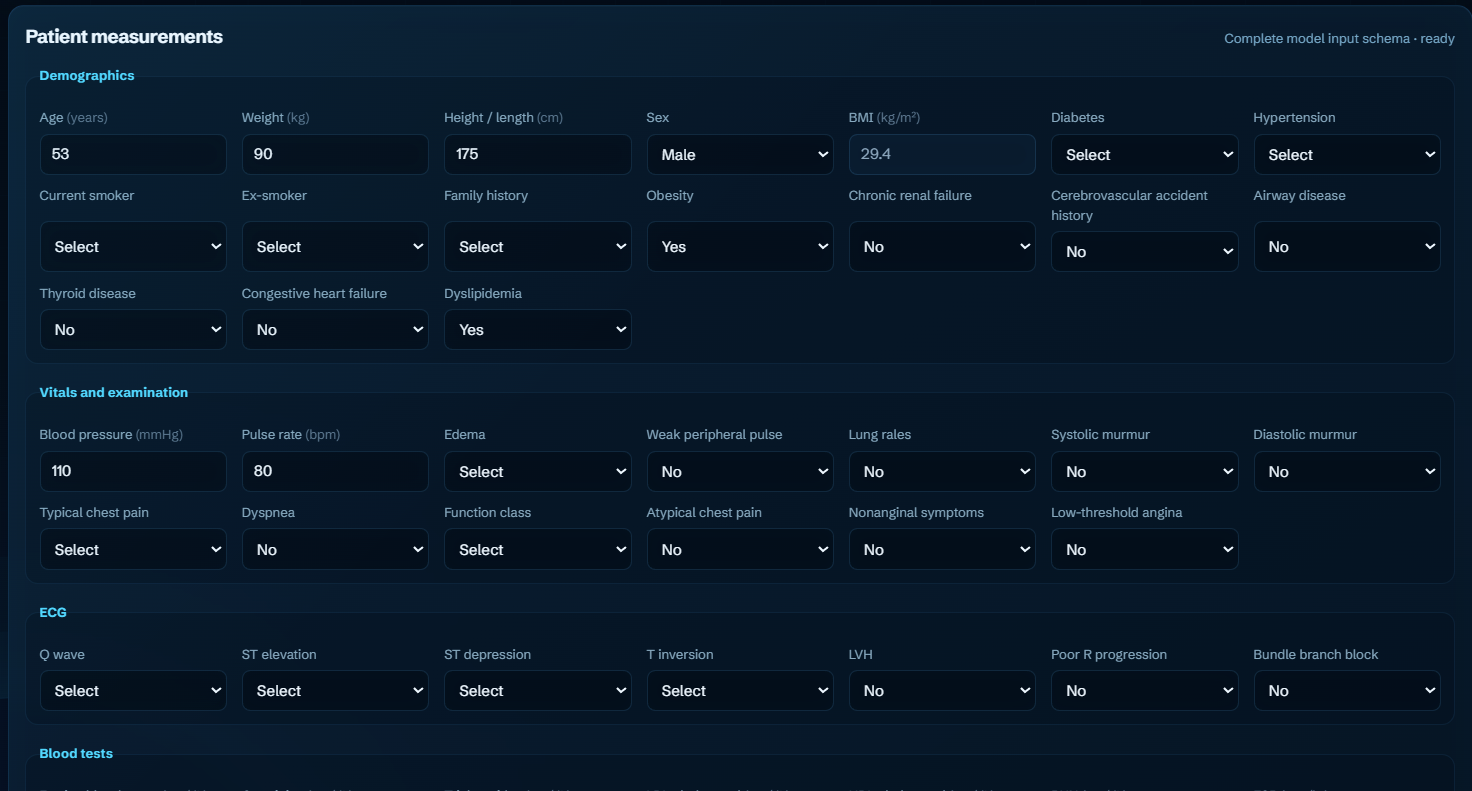
Patient Measurements [total ~54]
-
There's much more!
-
Inspiration
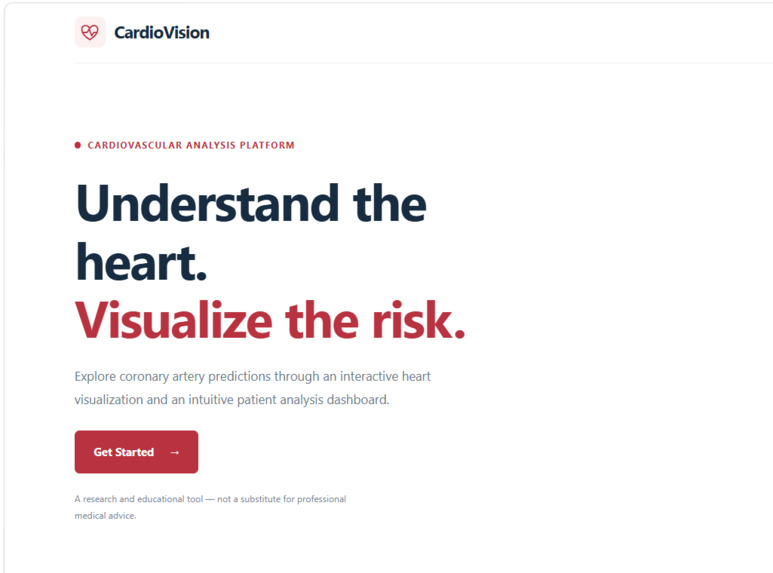
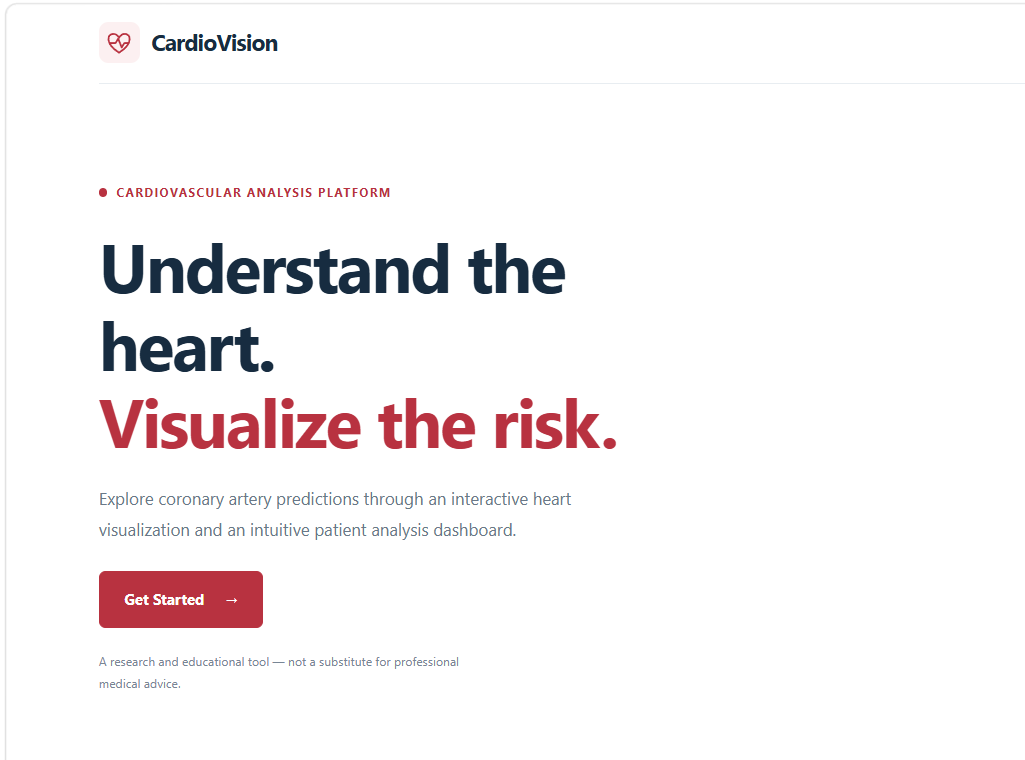
Cardiovascular diseases remain a major health concern, and understanding potential coronary artery risks through data can be challenging. I built CardioVision to explore how machine learning, interactive visualization, and explainable AI could come together in one accessible dashboard. My goal was to make experimental model predictions easier to explore and understand.
What it does
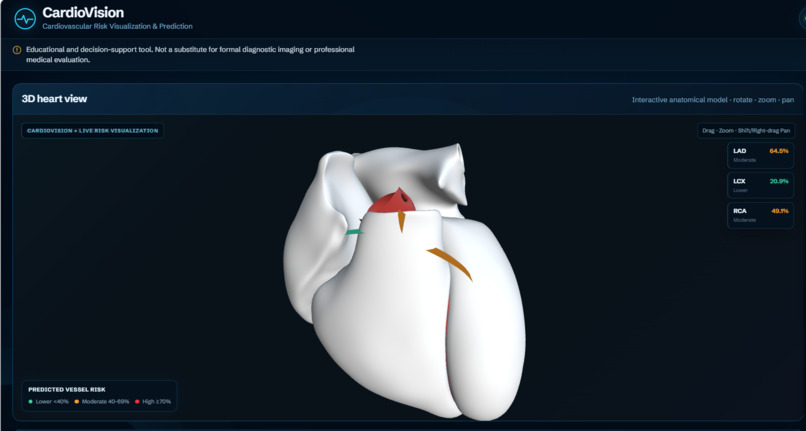
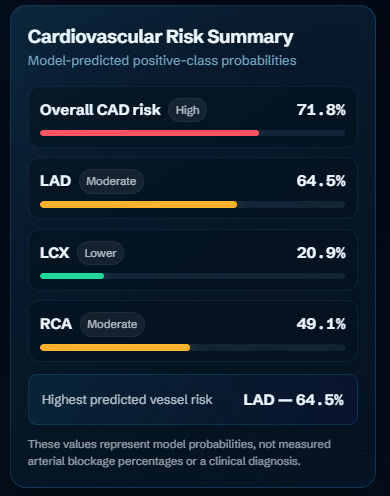
CardioVision is an experimental cardiovascular risk analysis dashboard that uses patient measurements to generate predictions for four targets: Cath, LAD, LCX, and RCA.
- Machine learning predictions: Generates model-predicted probabilities for each target.
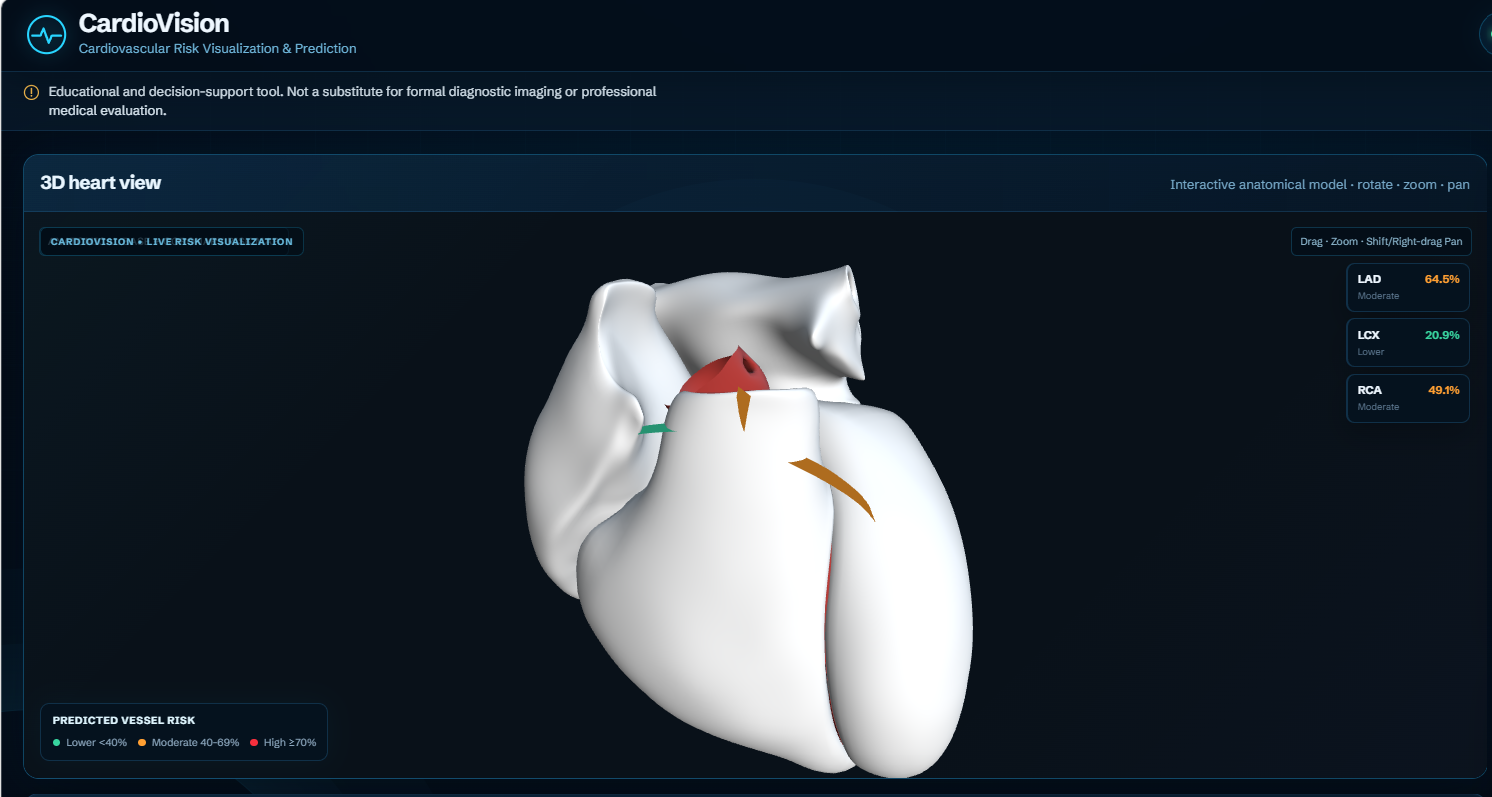
- Interactive 3D heart visualization: Provides a visual component for exploring the cardiovascular system.
- Model performance metrics: Displays evaluation results for the trained models.
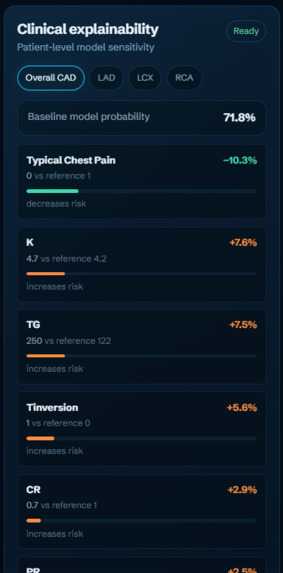
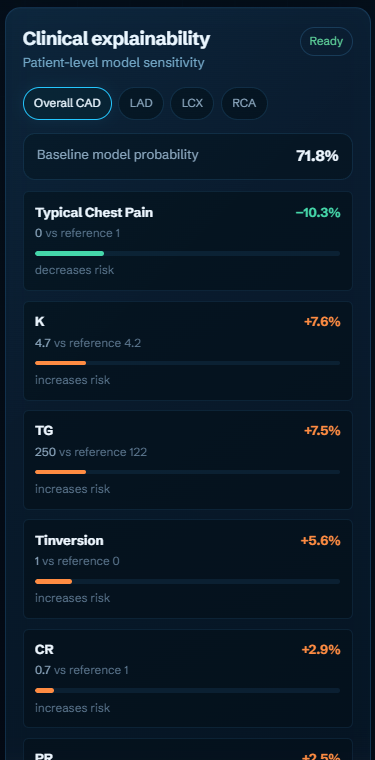
- Explainable AI: Shows feature contributions to help users explore which input features influence predictions.
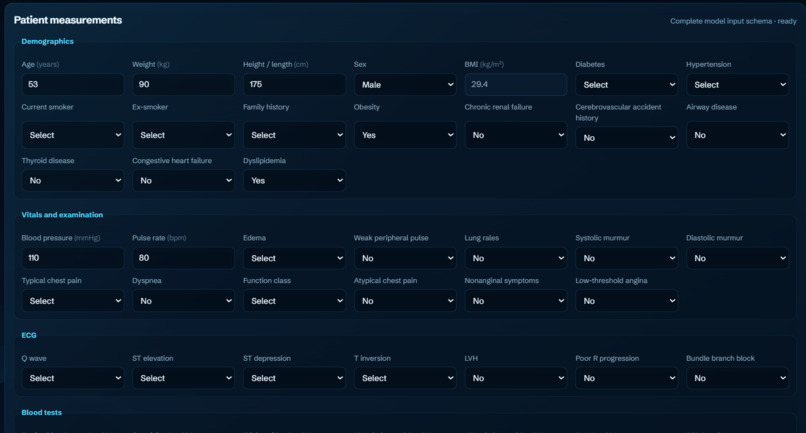
- Patient input workflow: Allows users to enter patient measurements and view the resulting outputs in one interface.
CardioVision is a prototype for learning and exploration, not a clinically validated diagnostic system.
How I built it
I built CardioVision using a React-based frontend and a Python backend powered by FastAPI. I trained separate machine learning models for Cath, LAD, LCX, and RCA and integrated them into the application to process patient inputs and return prediction results.
I developed an interactive dashboard featuring a 3D heart viewer, model performance information, and explainability panels. I used Python's machine learning ecosystem for model training and evaluation, alongside web technologies for the user interface and API integration.
Challenges I ran into
One of my biggest challenges was connecting the machine learning pipeline to a working web application. I had to handle differences between the model's expected input format and the frontend's patient measurements while ensuring that prediction results were displayed consistently.
I also worked through Python dependency and environment compatibility issues, model evaluation, and the integration of feature explanations into the dashboard. Building the 3D heart visualization was another challenge, particularly in balancing interactivity with anatomical detail.
Accomplishments I'm proud of
I'm proud to have brought together multiple machine learning models, a functioning prediction workflow, model performance reporting, explainability features, and a 3D heart visualization in one application.
Another accomplishment was moving beyond a standalone model and building a full-stack prototype connecting a user interface, backend API, and trained models. Developing CardioVision independently has helped me explore how different AI components can work together in a practical application.
What I learned
I learned how to integrate machine learning models into a full-stack application, connect a React frontend to a FastAPI backend, and work through real-world development and dependency issues.
I also learned that model predictions need careful interpretation: a predicted probability is not the same as a measured percentage of arterial blockage or a confirmed medical diagnosis. Explainability and transparent limitations are especially important when building AI applications related to healthcare.
What's next for CardioVision
I plan to improve the anatomical realism and interactivity of the 3D heart, strengthen model evaluation, refine the explainability interface, and improve the overall user experience.
Future improvements could include more rigorous validation on independent datasets, better documentation of model limitations, and collaboration with qualified healthcare professionals to assess whether the system could support meaningful research use.

Log in or sign up for Devpost to join the conversation.