Inspiration
Cardiovascular diseases remain among the leading causes of mortality worldwide. According to the Global Burden of Disease (GBD) 2023 estimates, published in 2025, cardiovascular diseases caused approximately 3.12 million deaths in India in 2023, highlighting the urgent need for accessible cardiovascular assessment, early risk identification, and connected healthcare solutions. However, cardiovascular healthcare faces challenges beyond disease detection. Patients frequently deal with fragmented medical histories, scattered laboratory reports, complex medical terminology, and difficulties maintaining continuity between consultations. Doctors, meanwhile, must interpret clinical measurements, patient histories, diagnostic reports, and previous assessments to make informed decisions. We realized that the problem wasn't simply a lack of medical data; it was the lack of a unified, accessible platform connecting that information with meaningful interpretation and ongoing care. This inspired us to ask: What if patients and doctors could access medical histories, organize diagnostic reports, explore AI-powered cardiovascular predictions, understand the factors behind those predictions, and visualize coronary anatomy within a single connected platform? That question became the foundation of CardioVision AI. As Biotechnology undergraduates at Delhi Technological University with a strong interest in artificial intelligence and software engineering, we wanted to combine our understanding of human physiology with practical machine learning to address a meaningful healthcare challenge. Our objective was not simply to build another heart disease prediction model, but to develop a more comprehensive cardiovascular intelligence and connected-care platform.
What it does
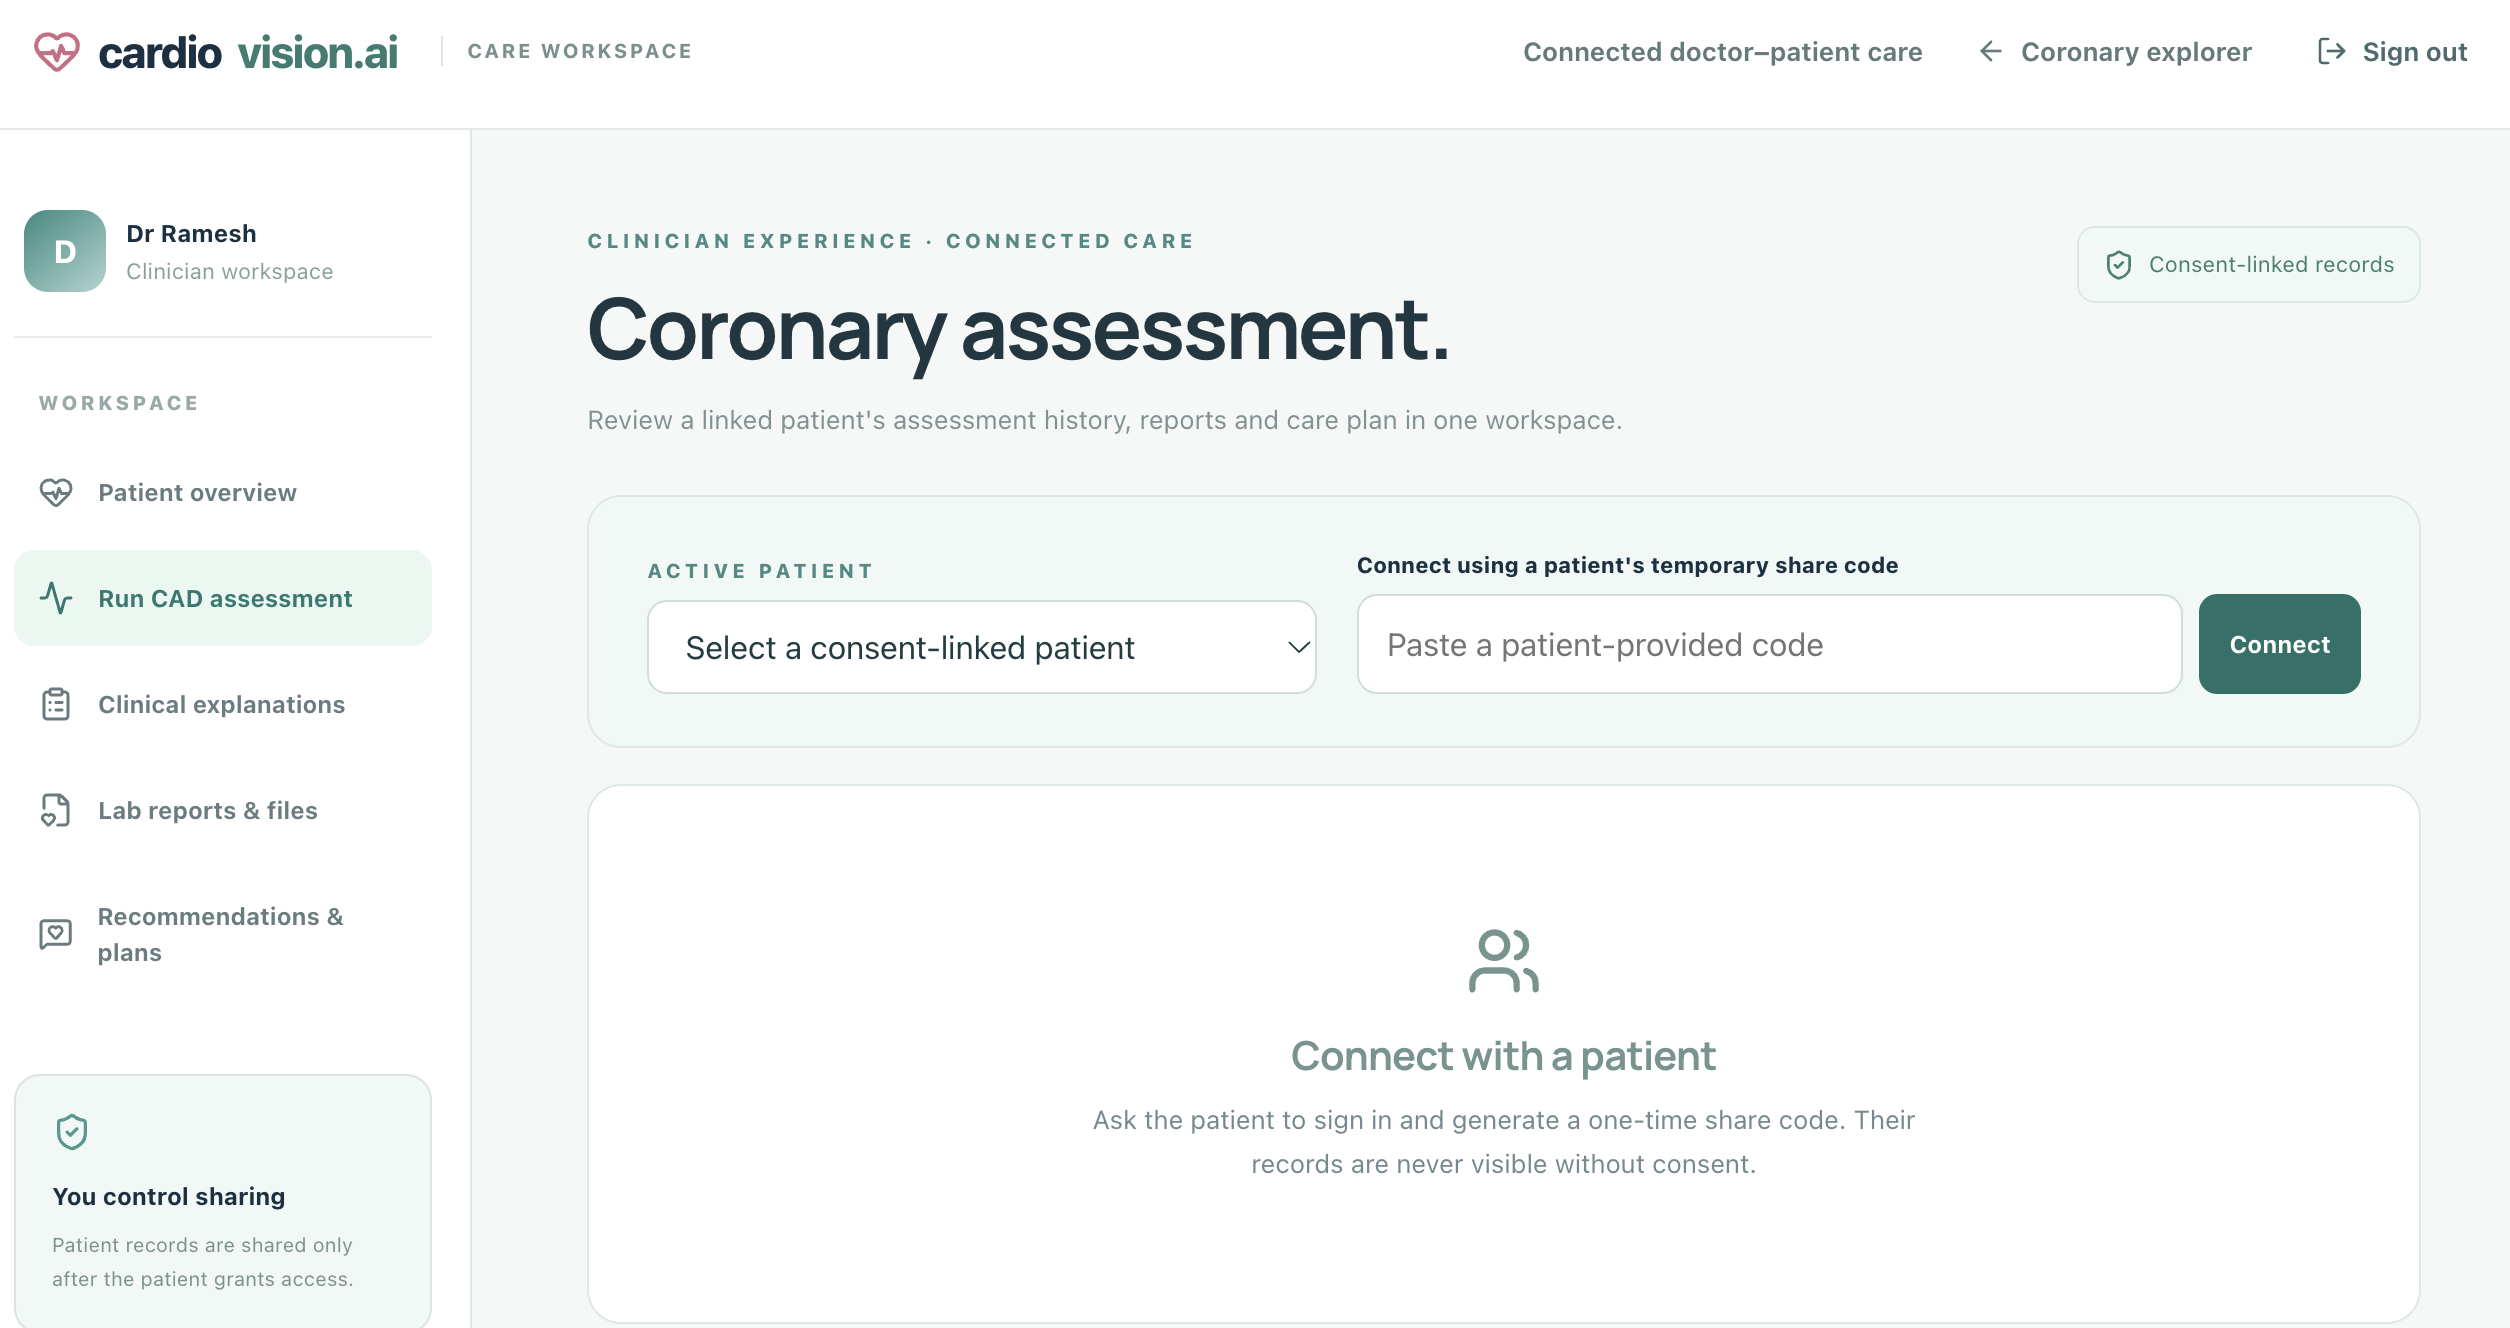
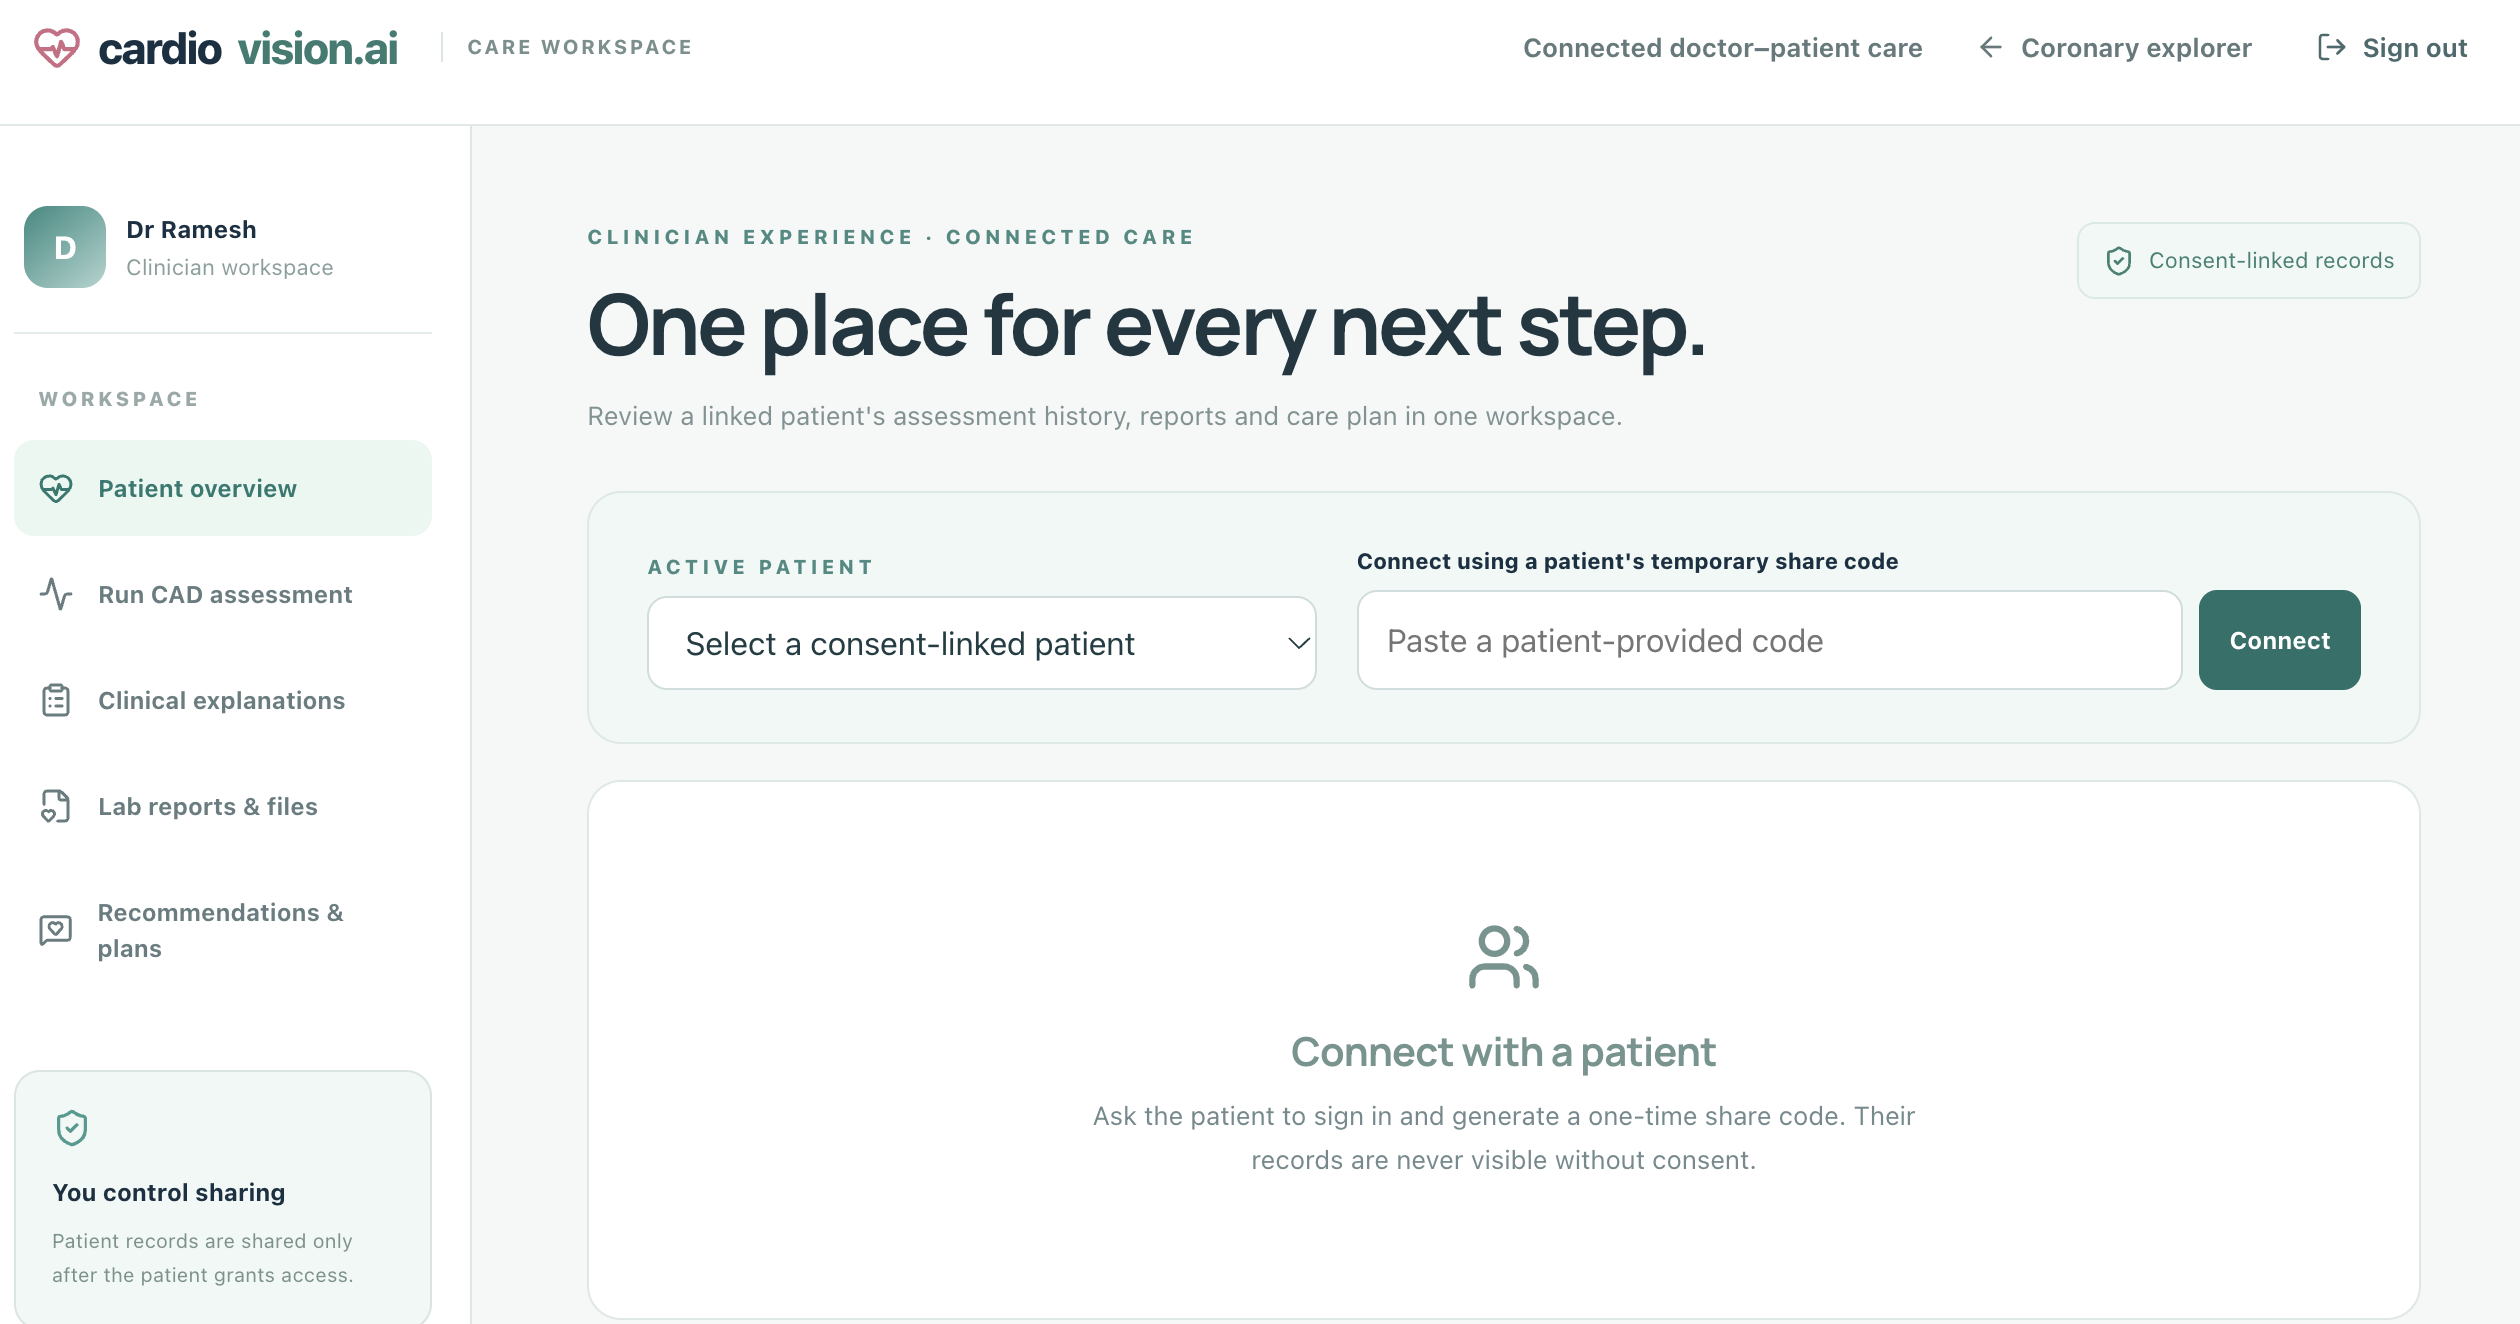
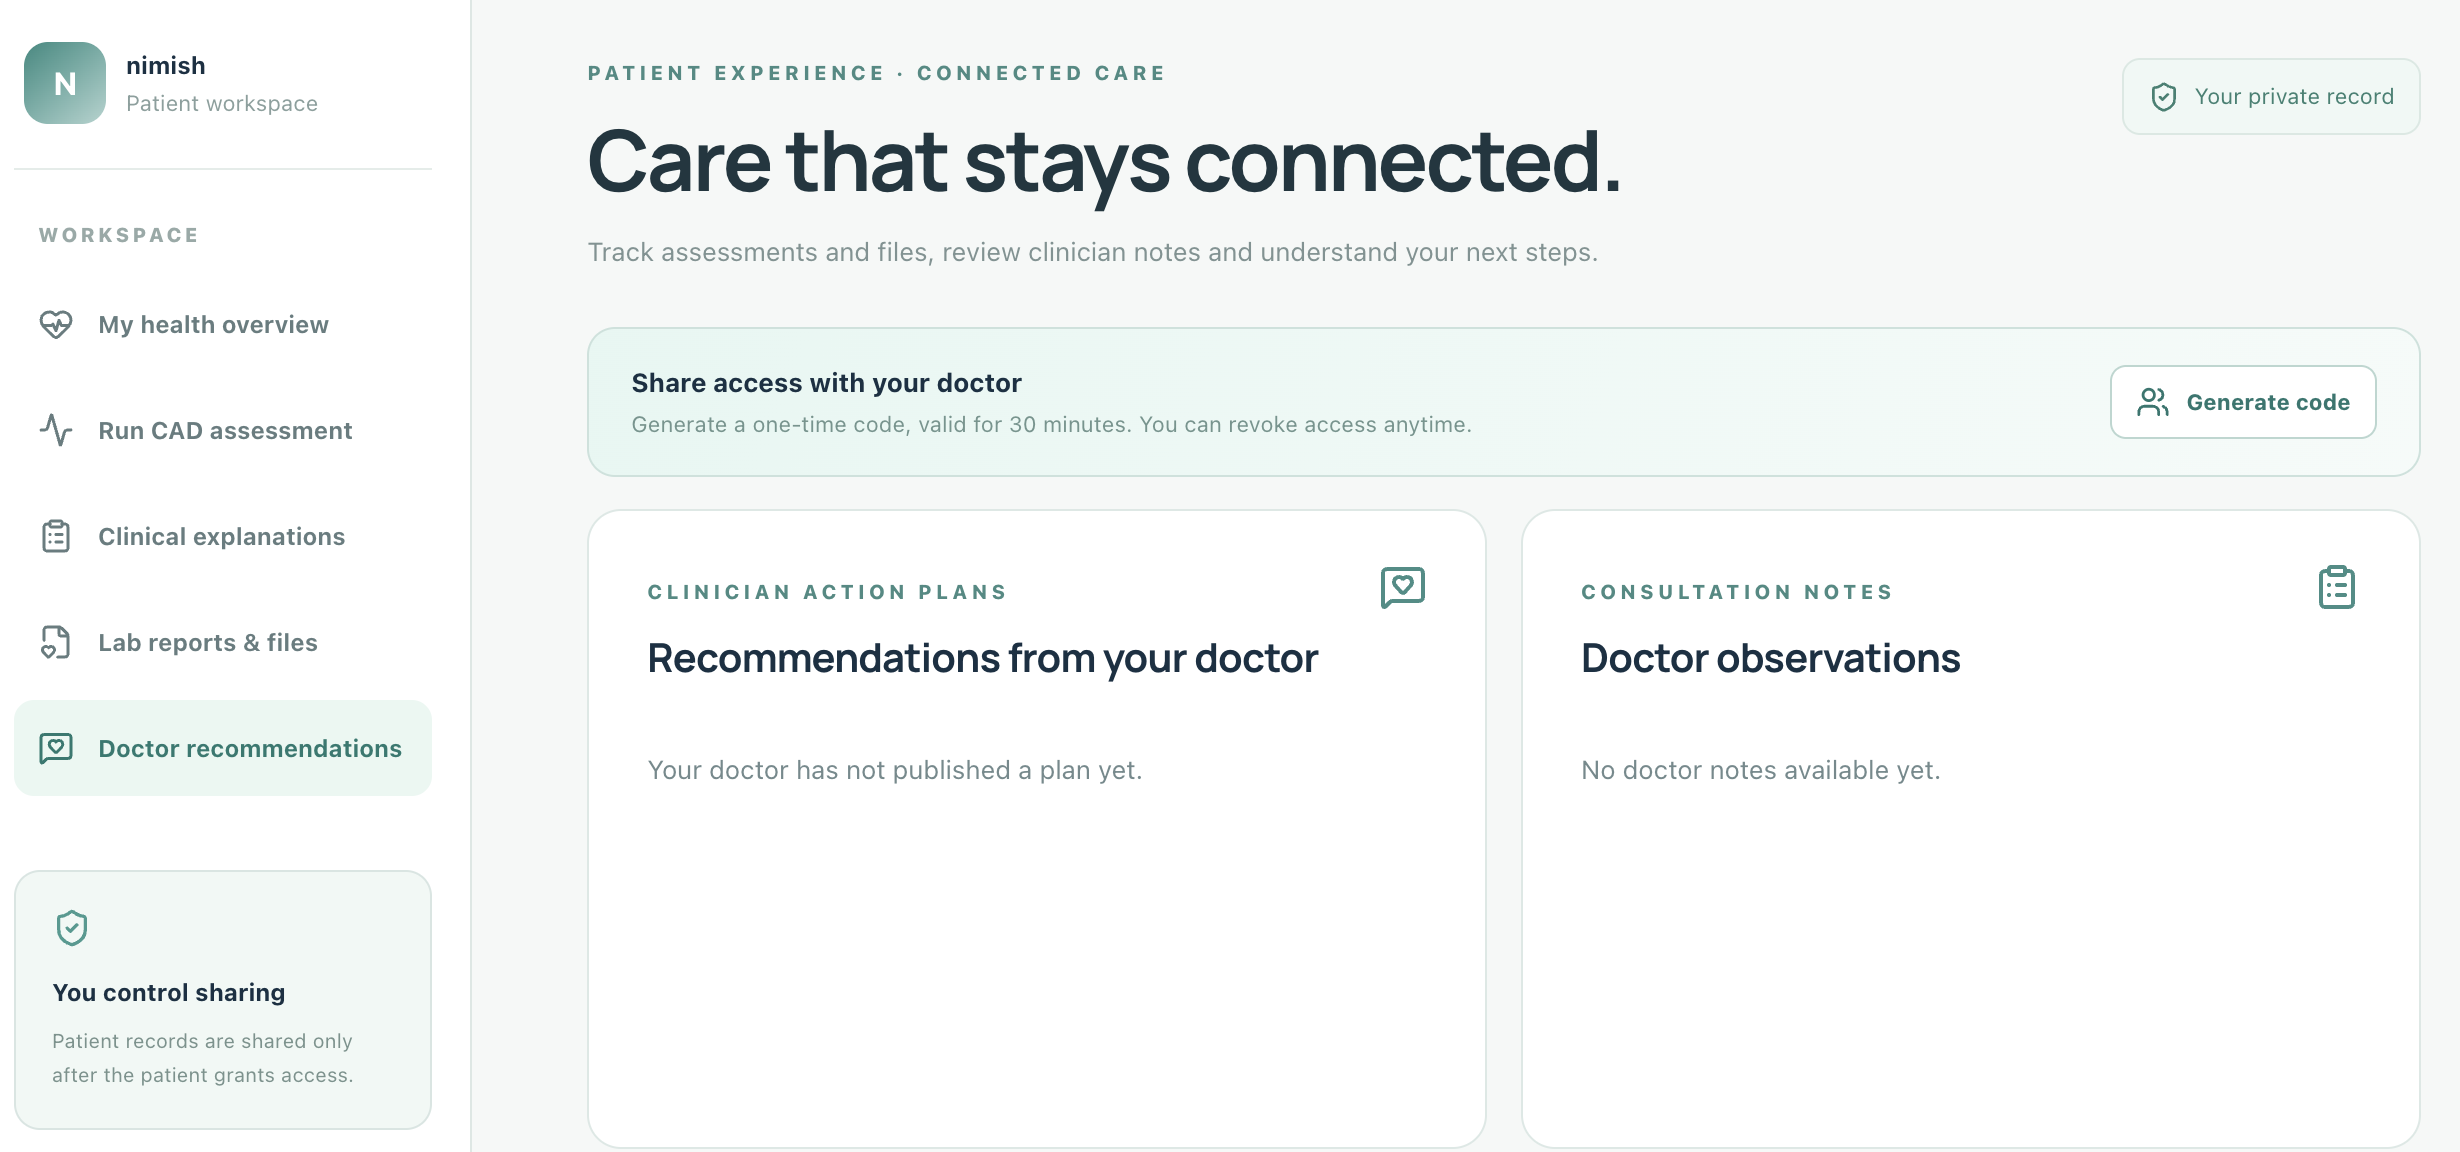
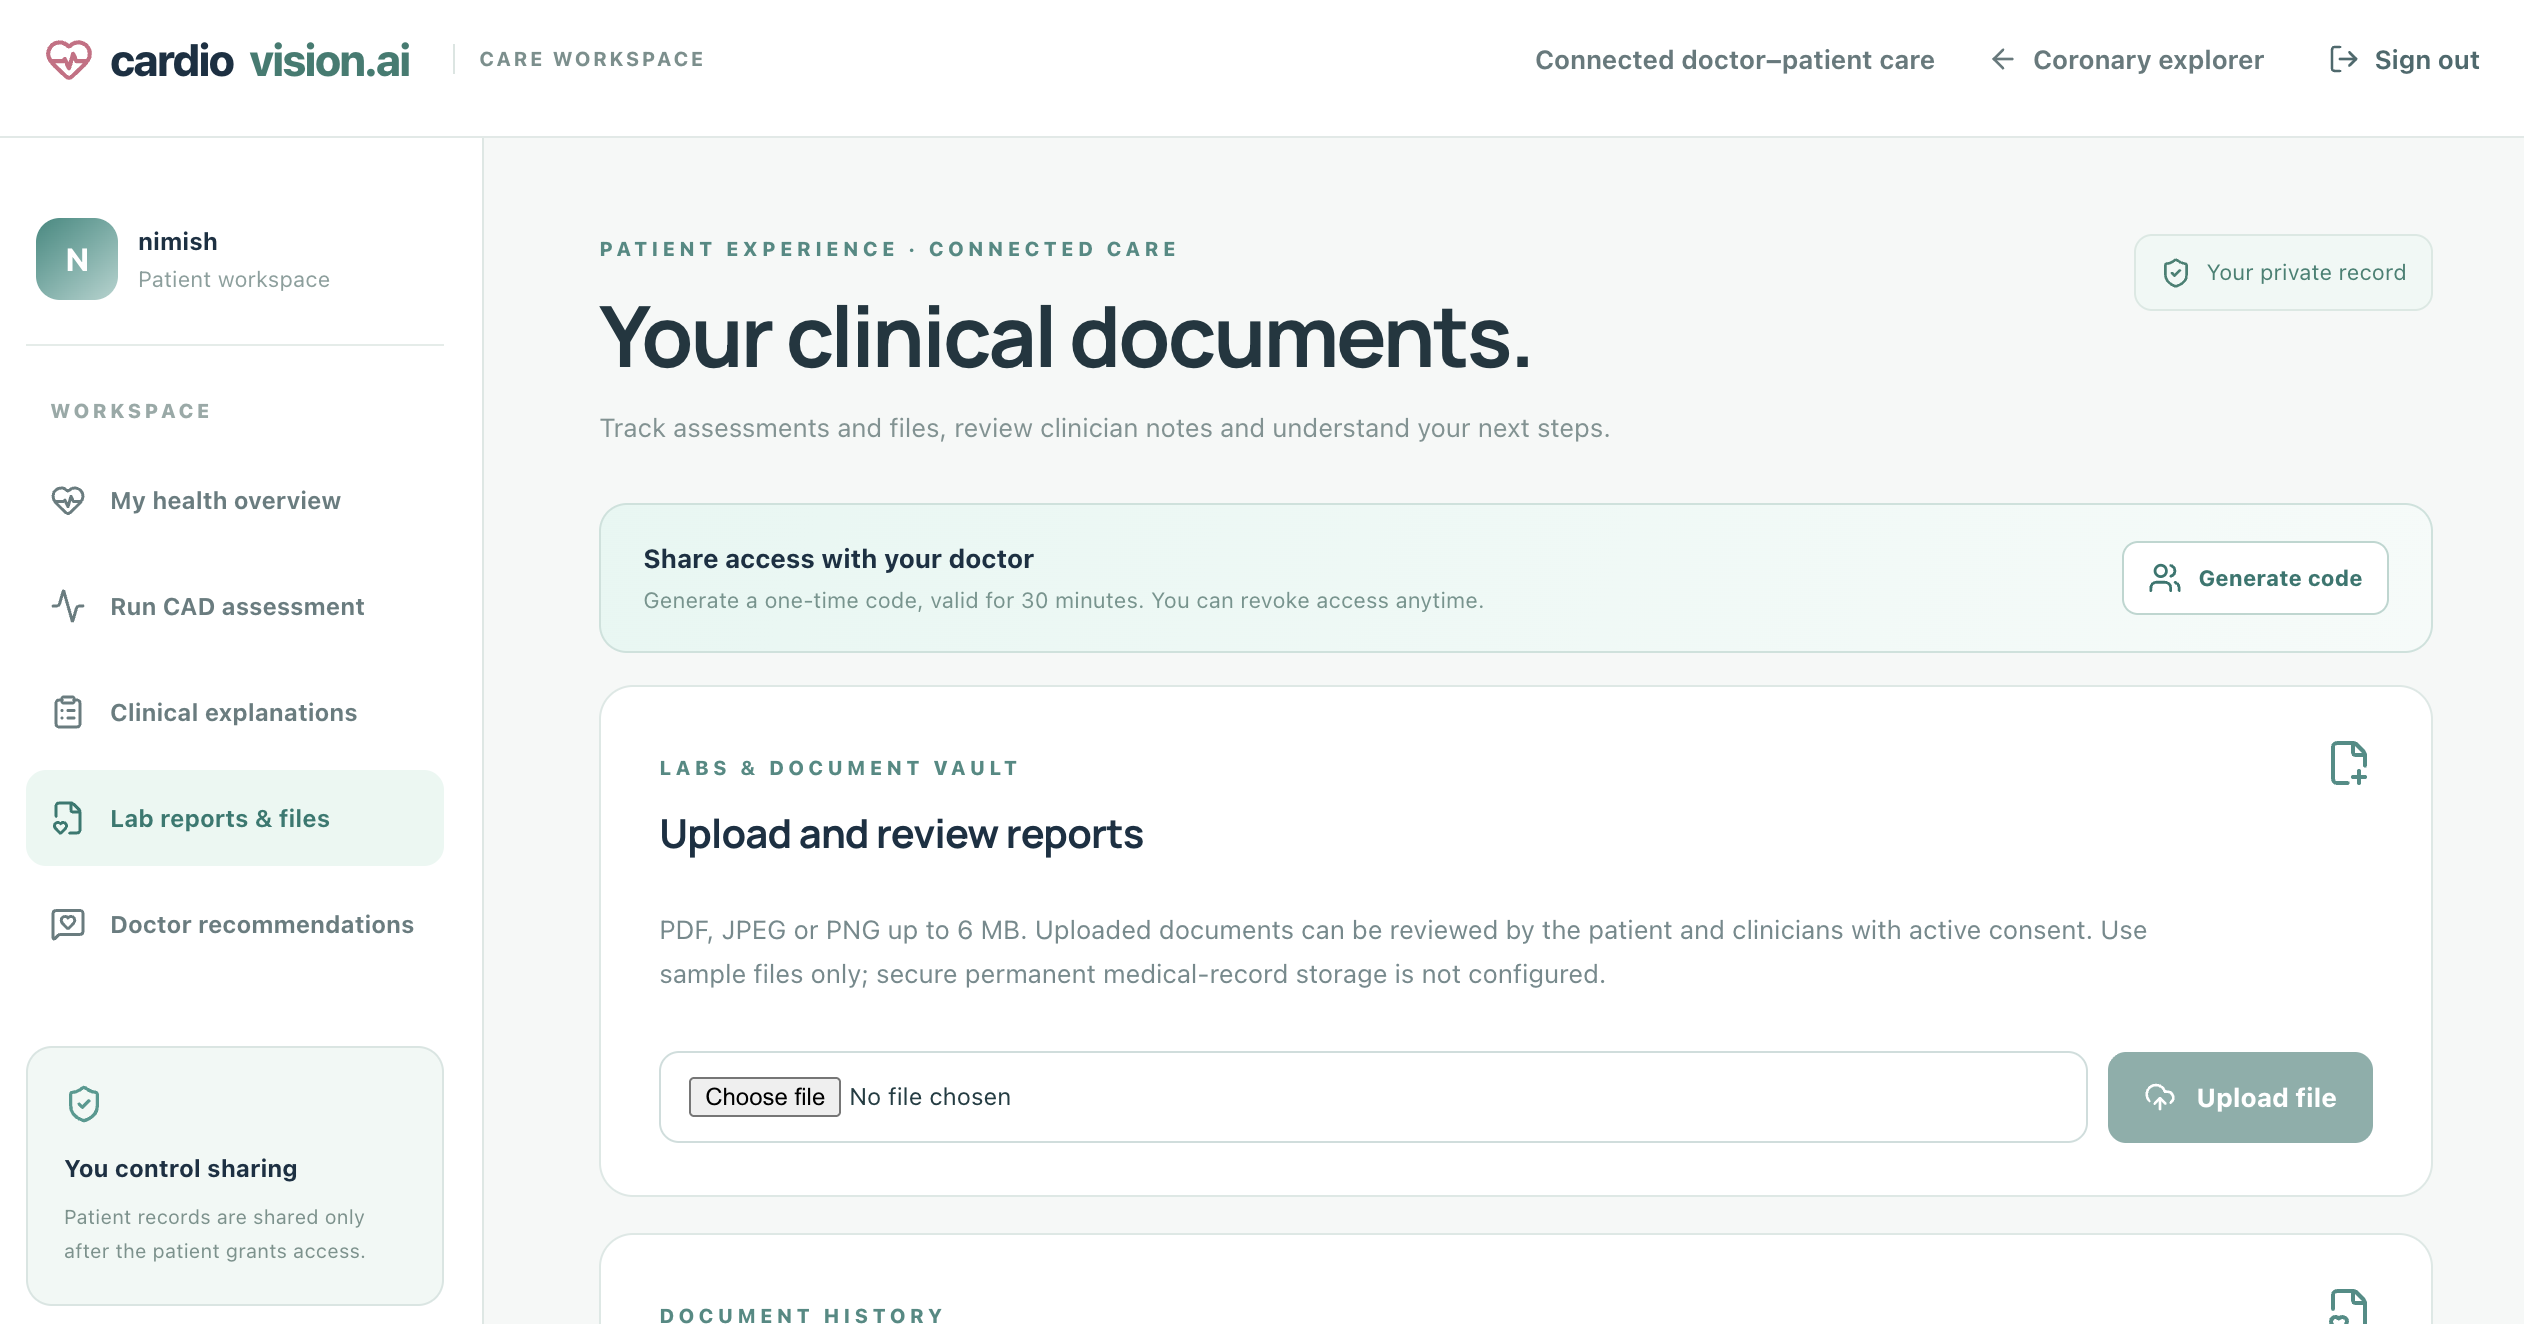
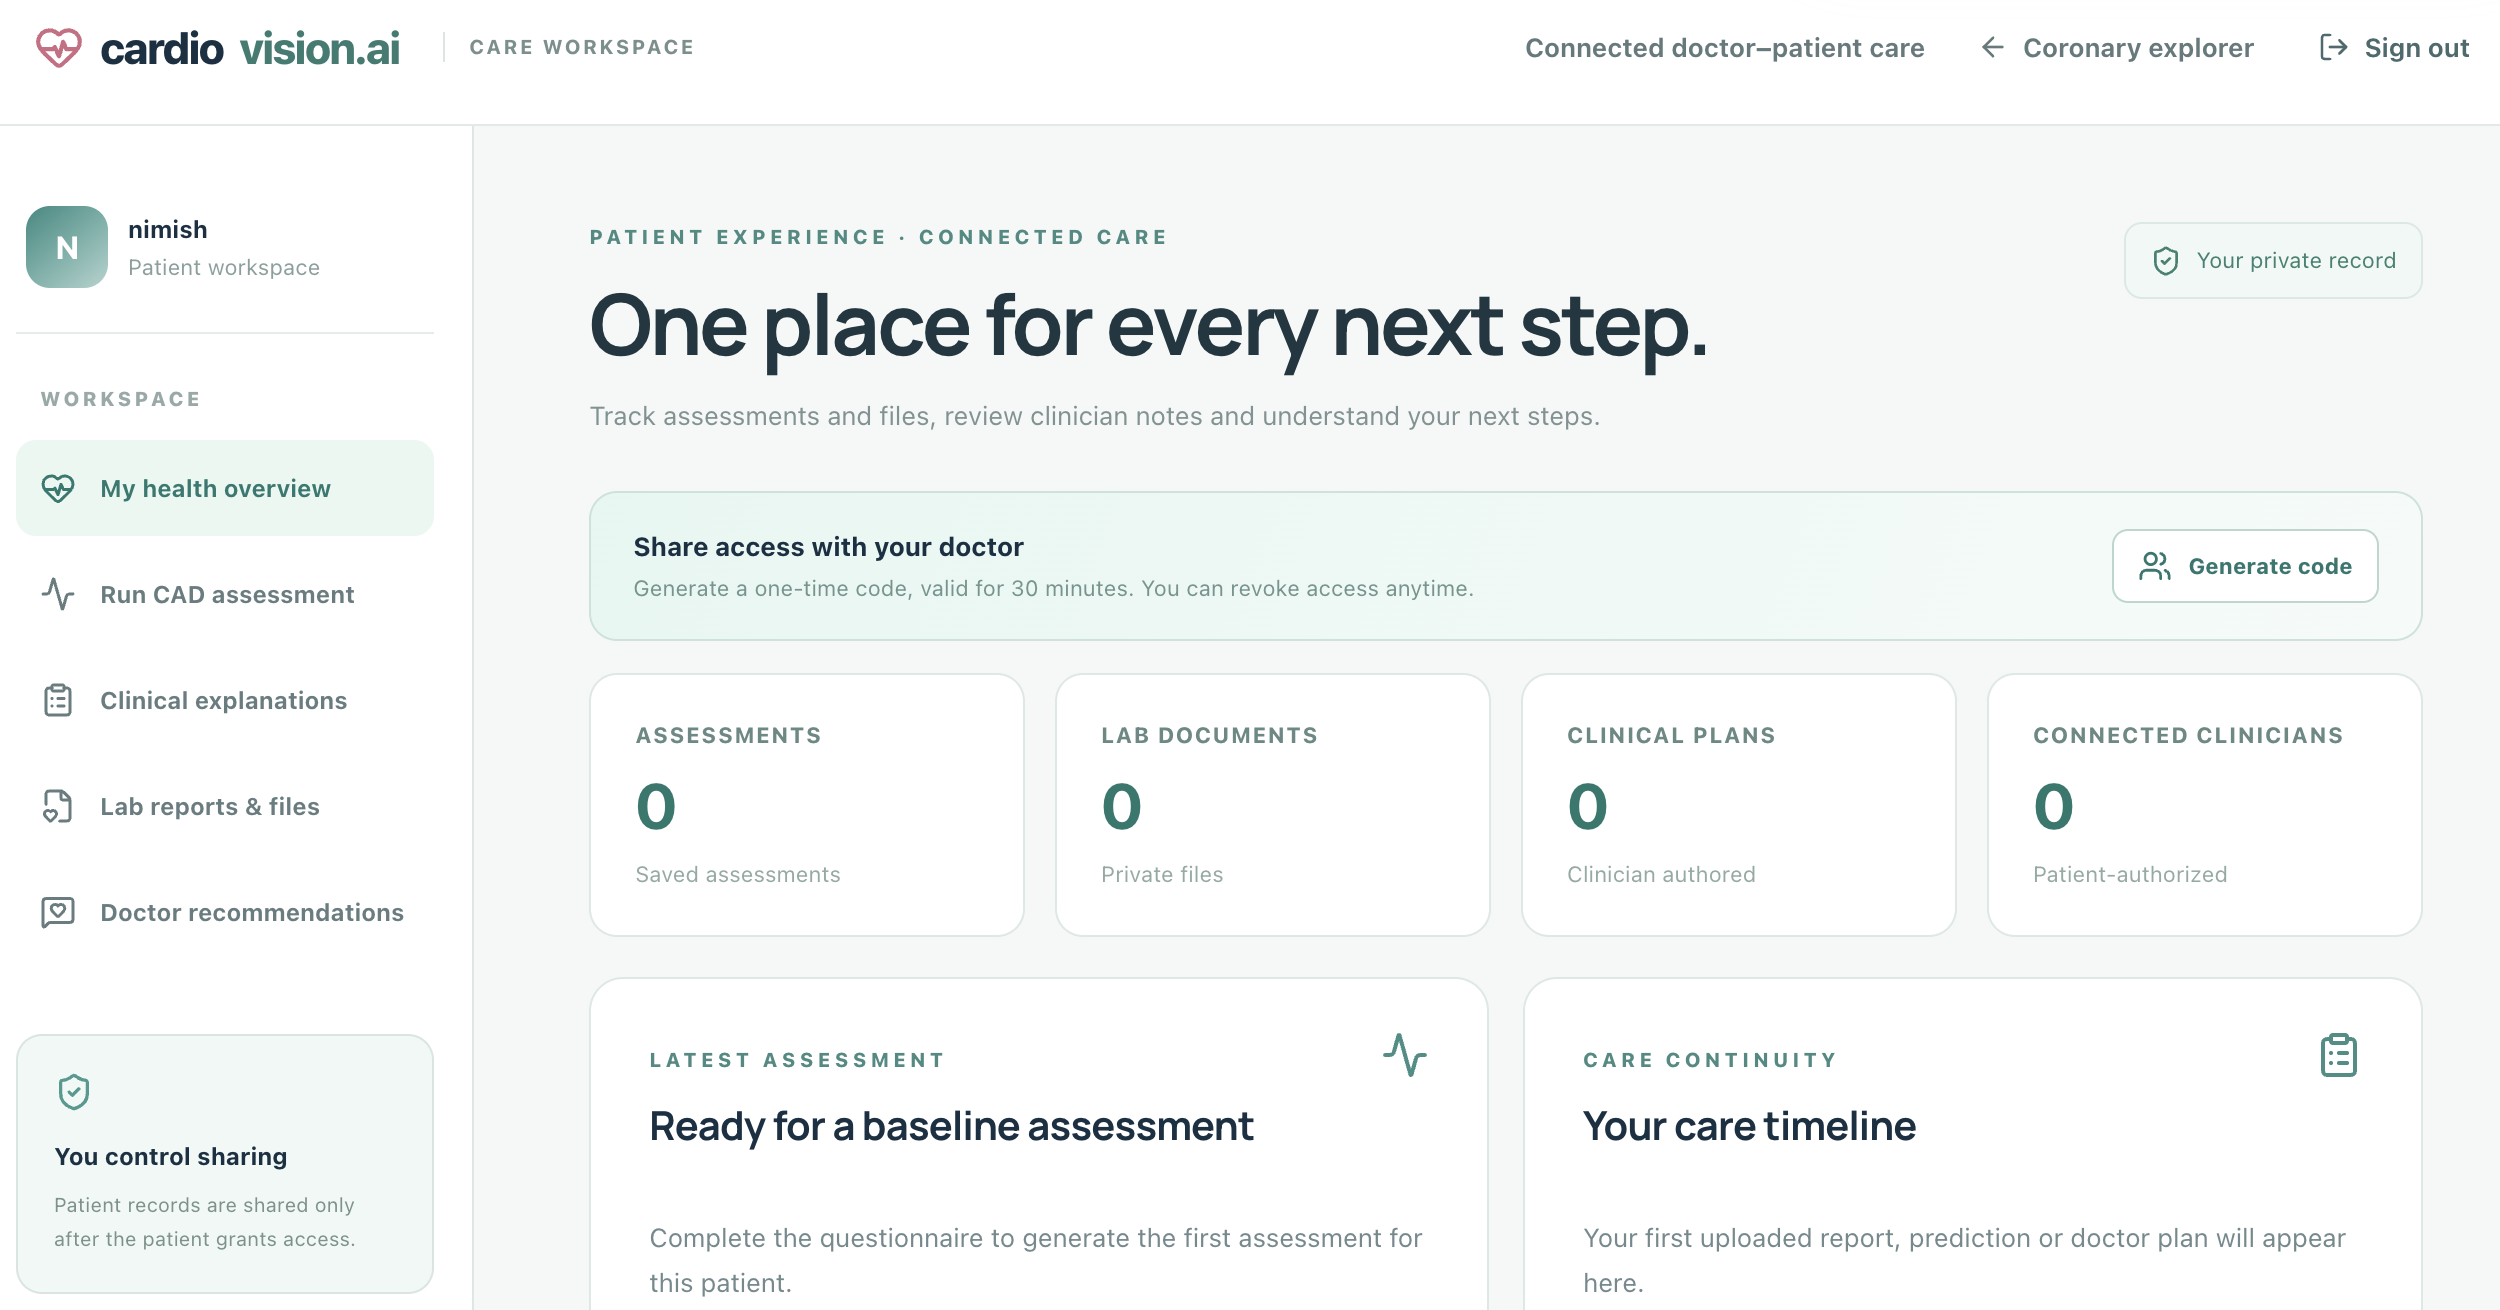
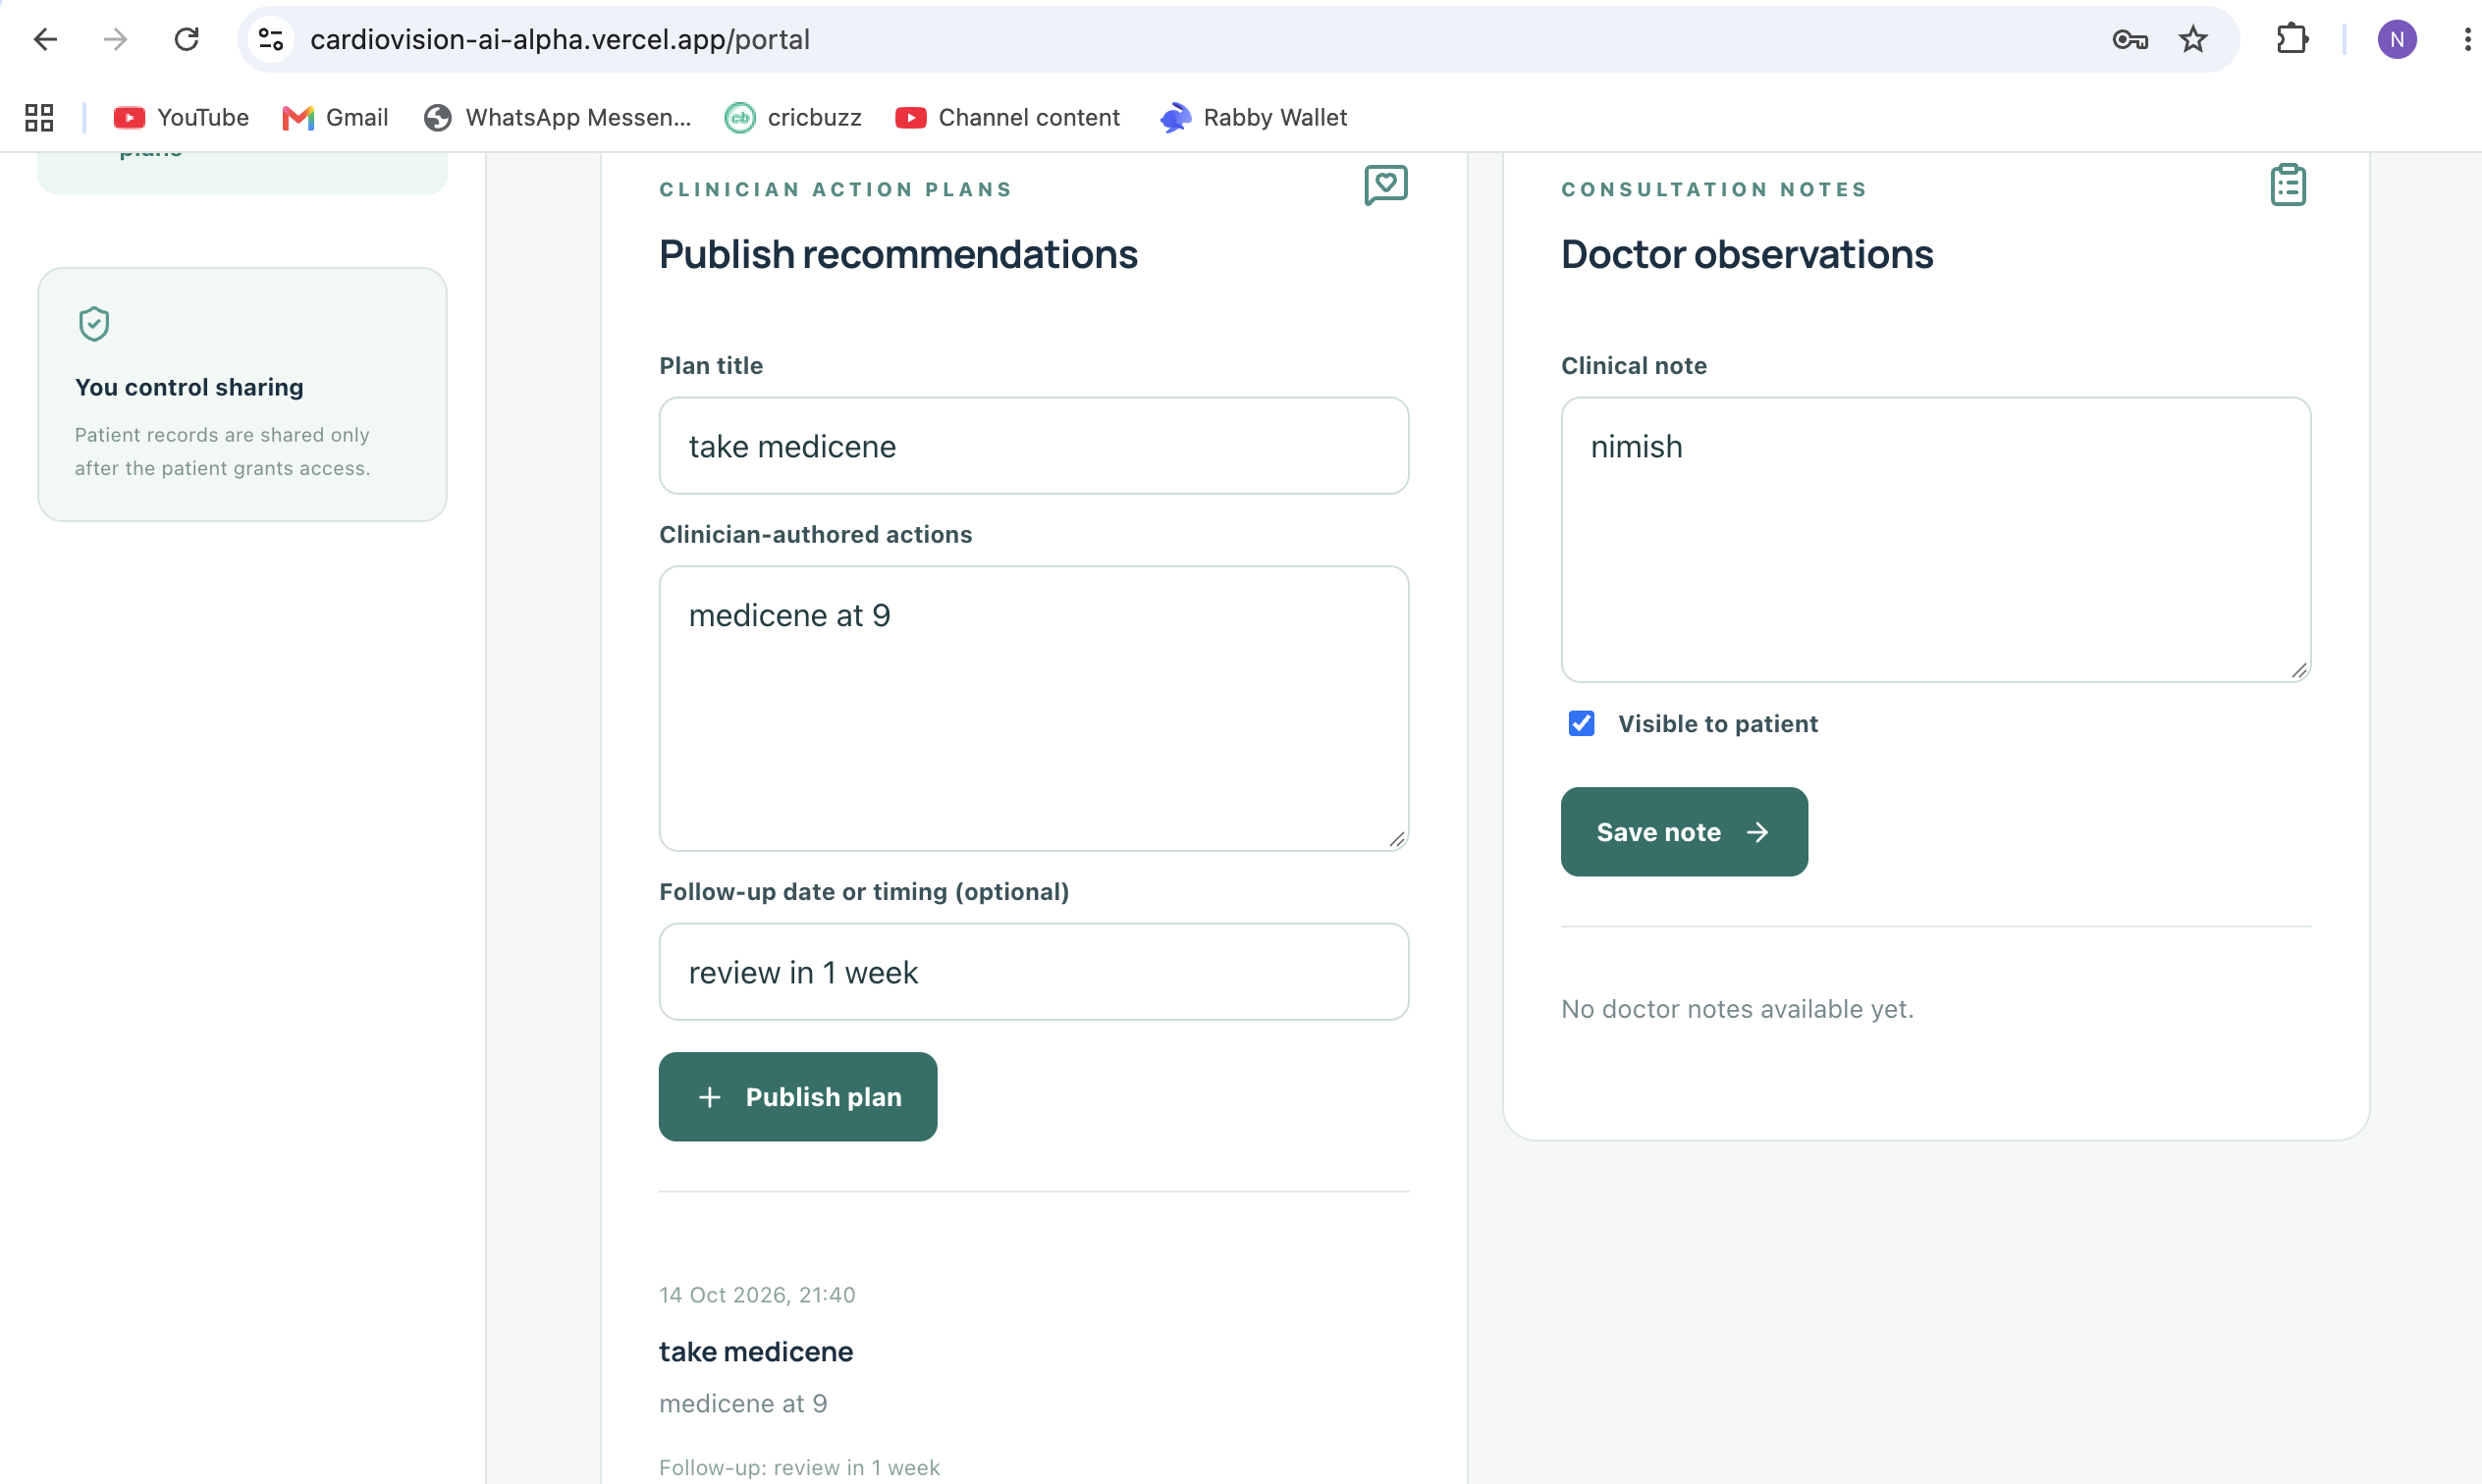
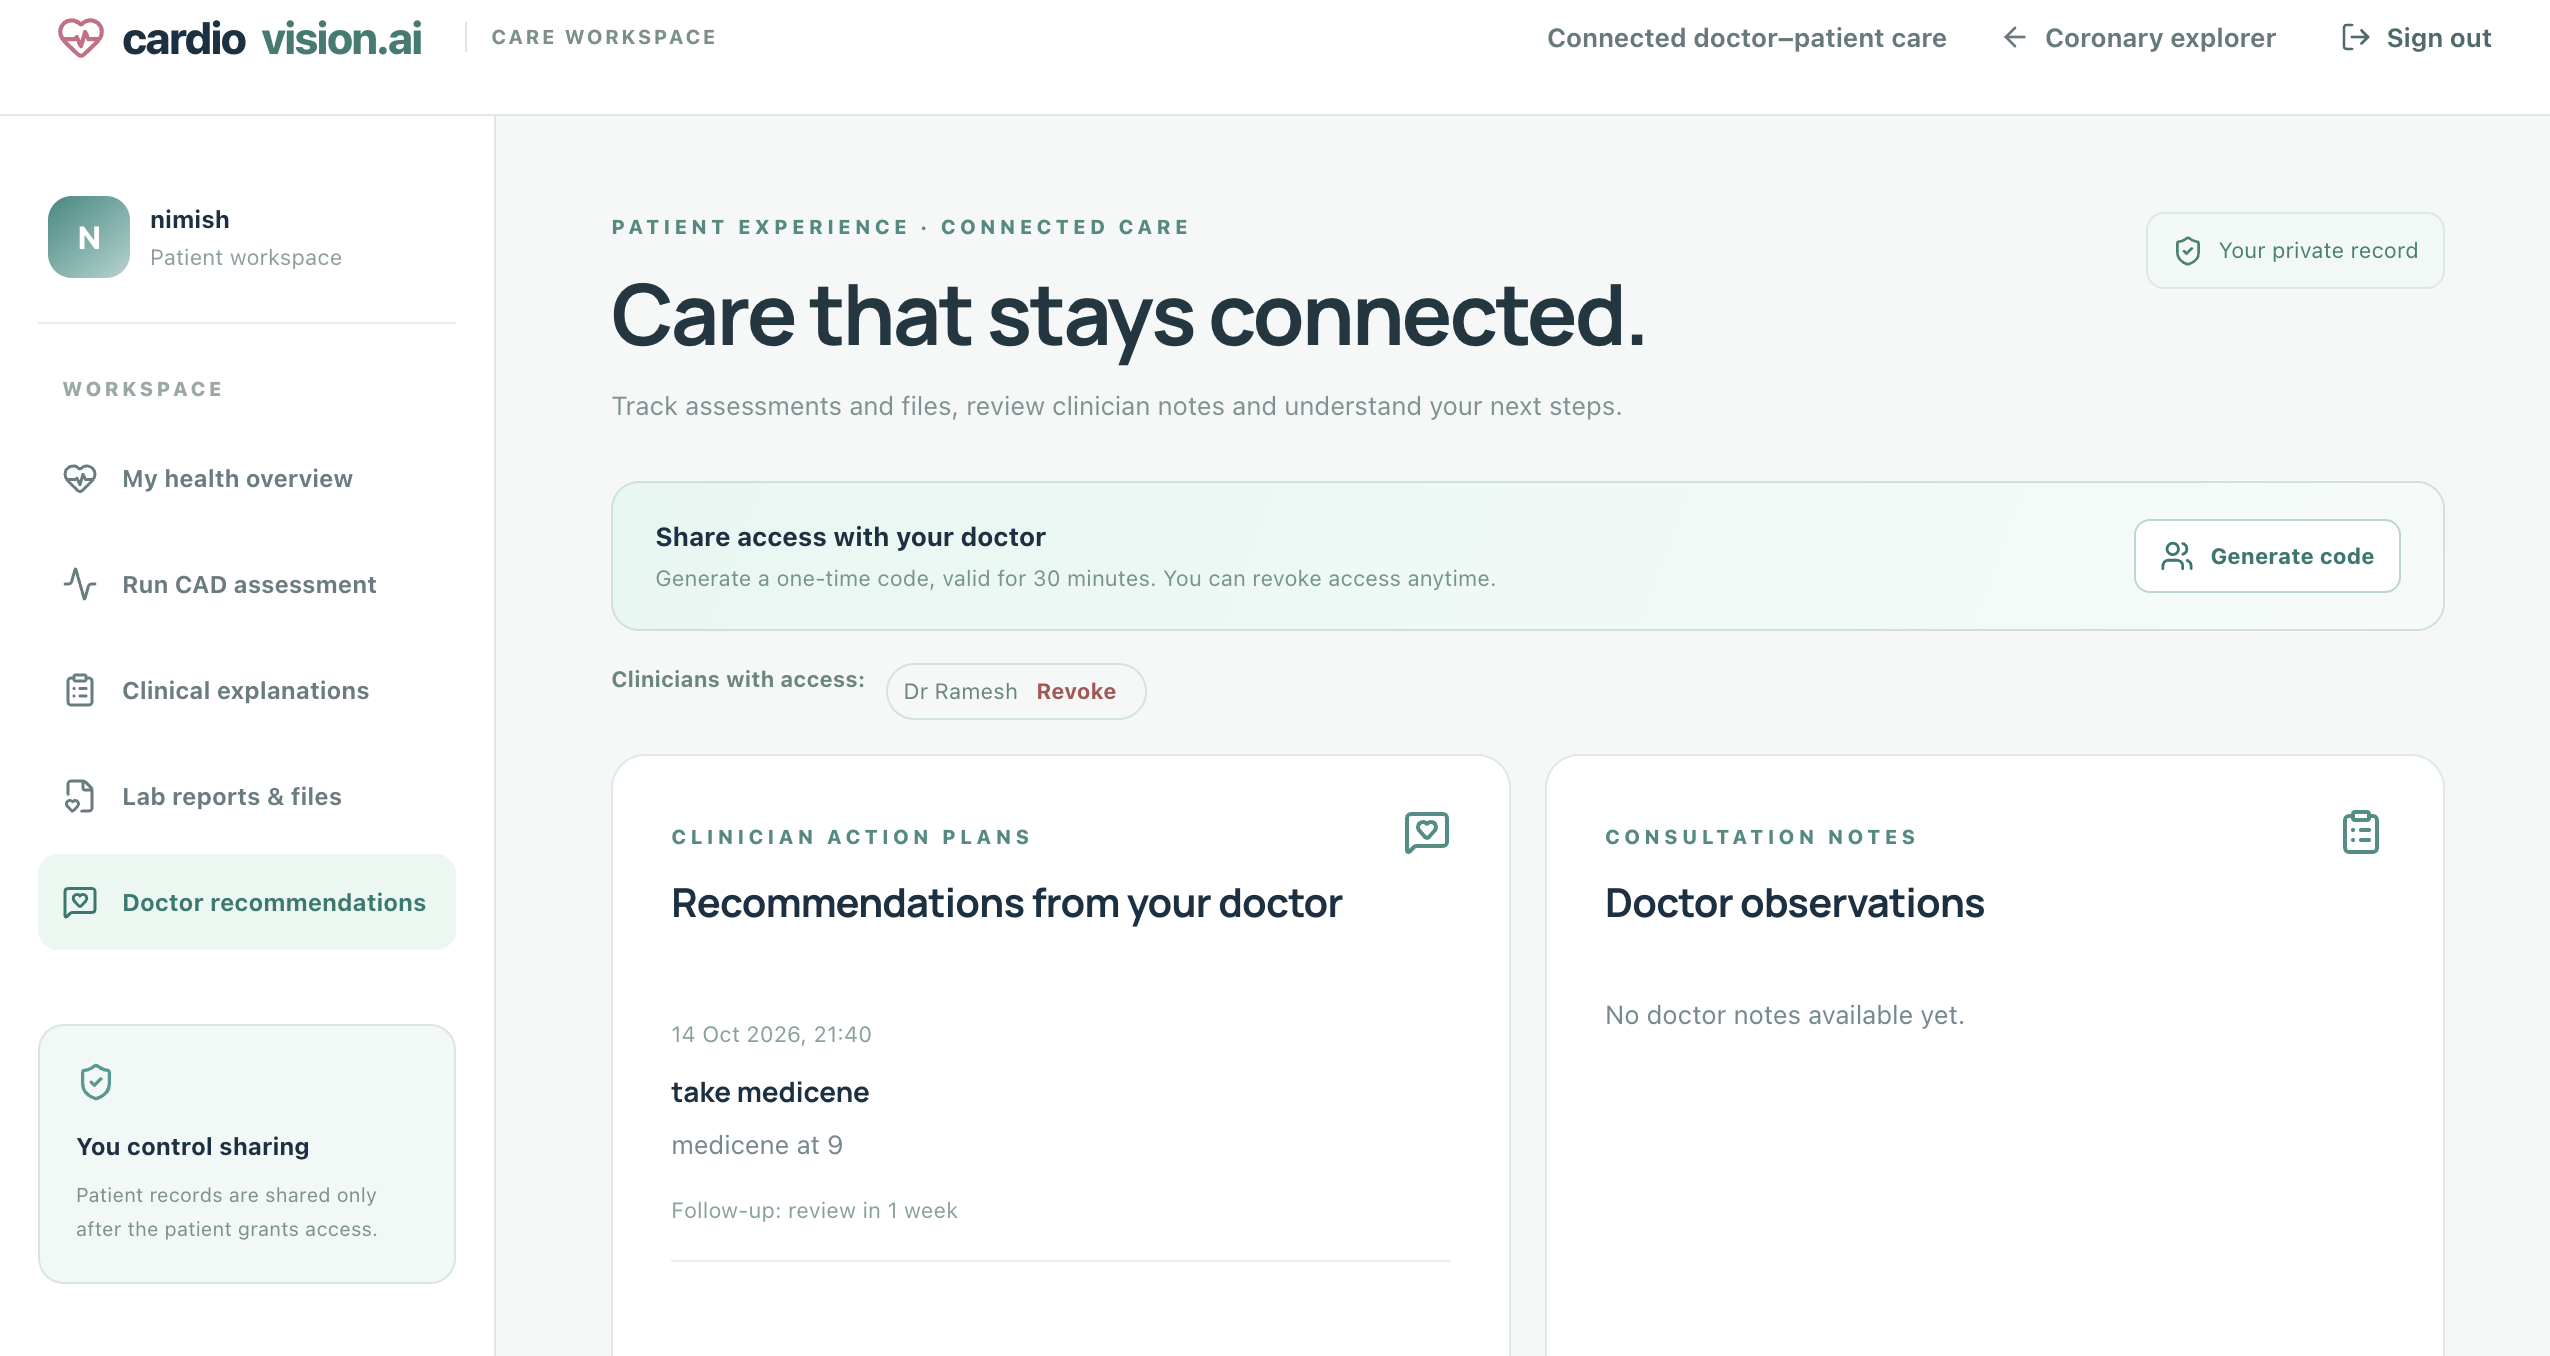
CardioVision AI is an integrated cardiovascular-care platform that combines doctor–patient collaboration, machine-learning predictions, explainable AI, and interactive 3D cardiac visualization. The platform is organized around three core capabilities. 1. Connected Doctor–Patient Healthcare Platform We developed separate dashboards for patients and doctors to provide a structured environment for managing cardiovascular information. Patient Dashboard Patients can create accounts and access a personalized healthcare workspace where they can: Upload, organize, and review medical files and laboratory reports. Access their cardiovascular assessment history. Run AI-powered cardiovascular assessments. Review previous model outputs and physiological measurements. Connect with doctors through consent-based record sharing. View clinician-authored recommendations, consultation notes, and follow-up plans. Maintain a consolidated view of their available medical information.
Doctor Dashboard The doctor-facing interface supports: Viewing records shared by connected patients. Reviewing patient histories, assessment results, and uploaded reports. Accessing CAD and coronary vessel-specific prediction tools. Examining feature contributions and physiological information. Recording consultation notes and follow-up recommendations. Creating personalized care and monitoring plans. Reviewing information across successive patient interactions. This connected-care workflow is central to our project. Rather than treating prediction as an isolated event, CardioVision brings assessment results into a broader patient-management experience.
The current portal implements these workflows for demonstration with synthetic information. Clinical deployment would require verified healthcare professionals and production-grade medical-record infrastructure.
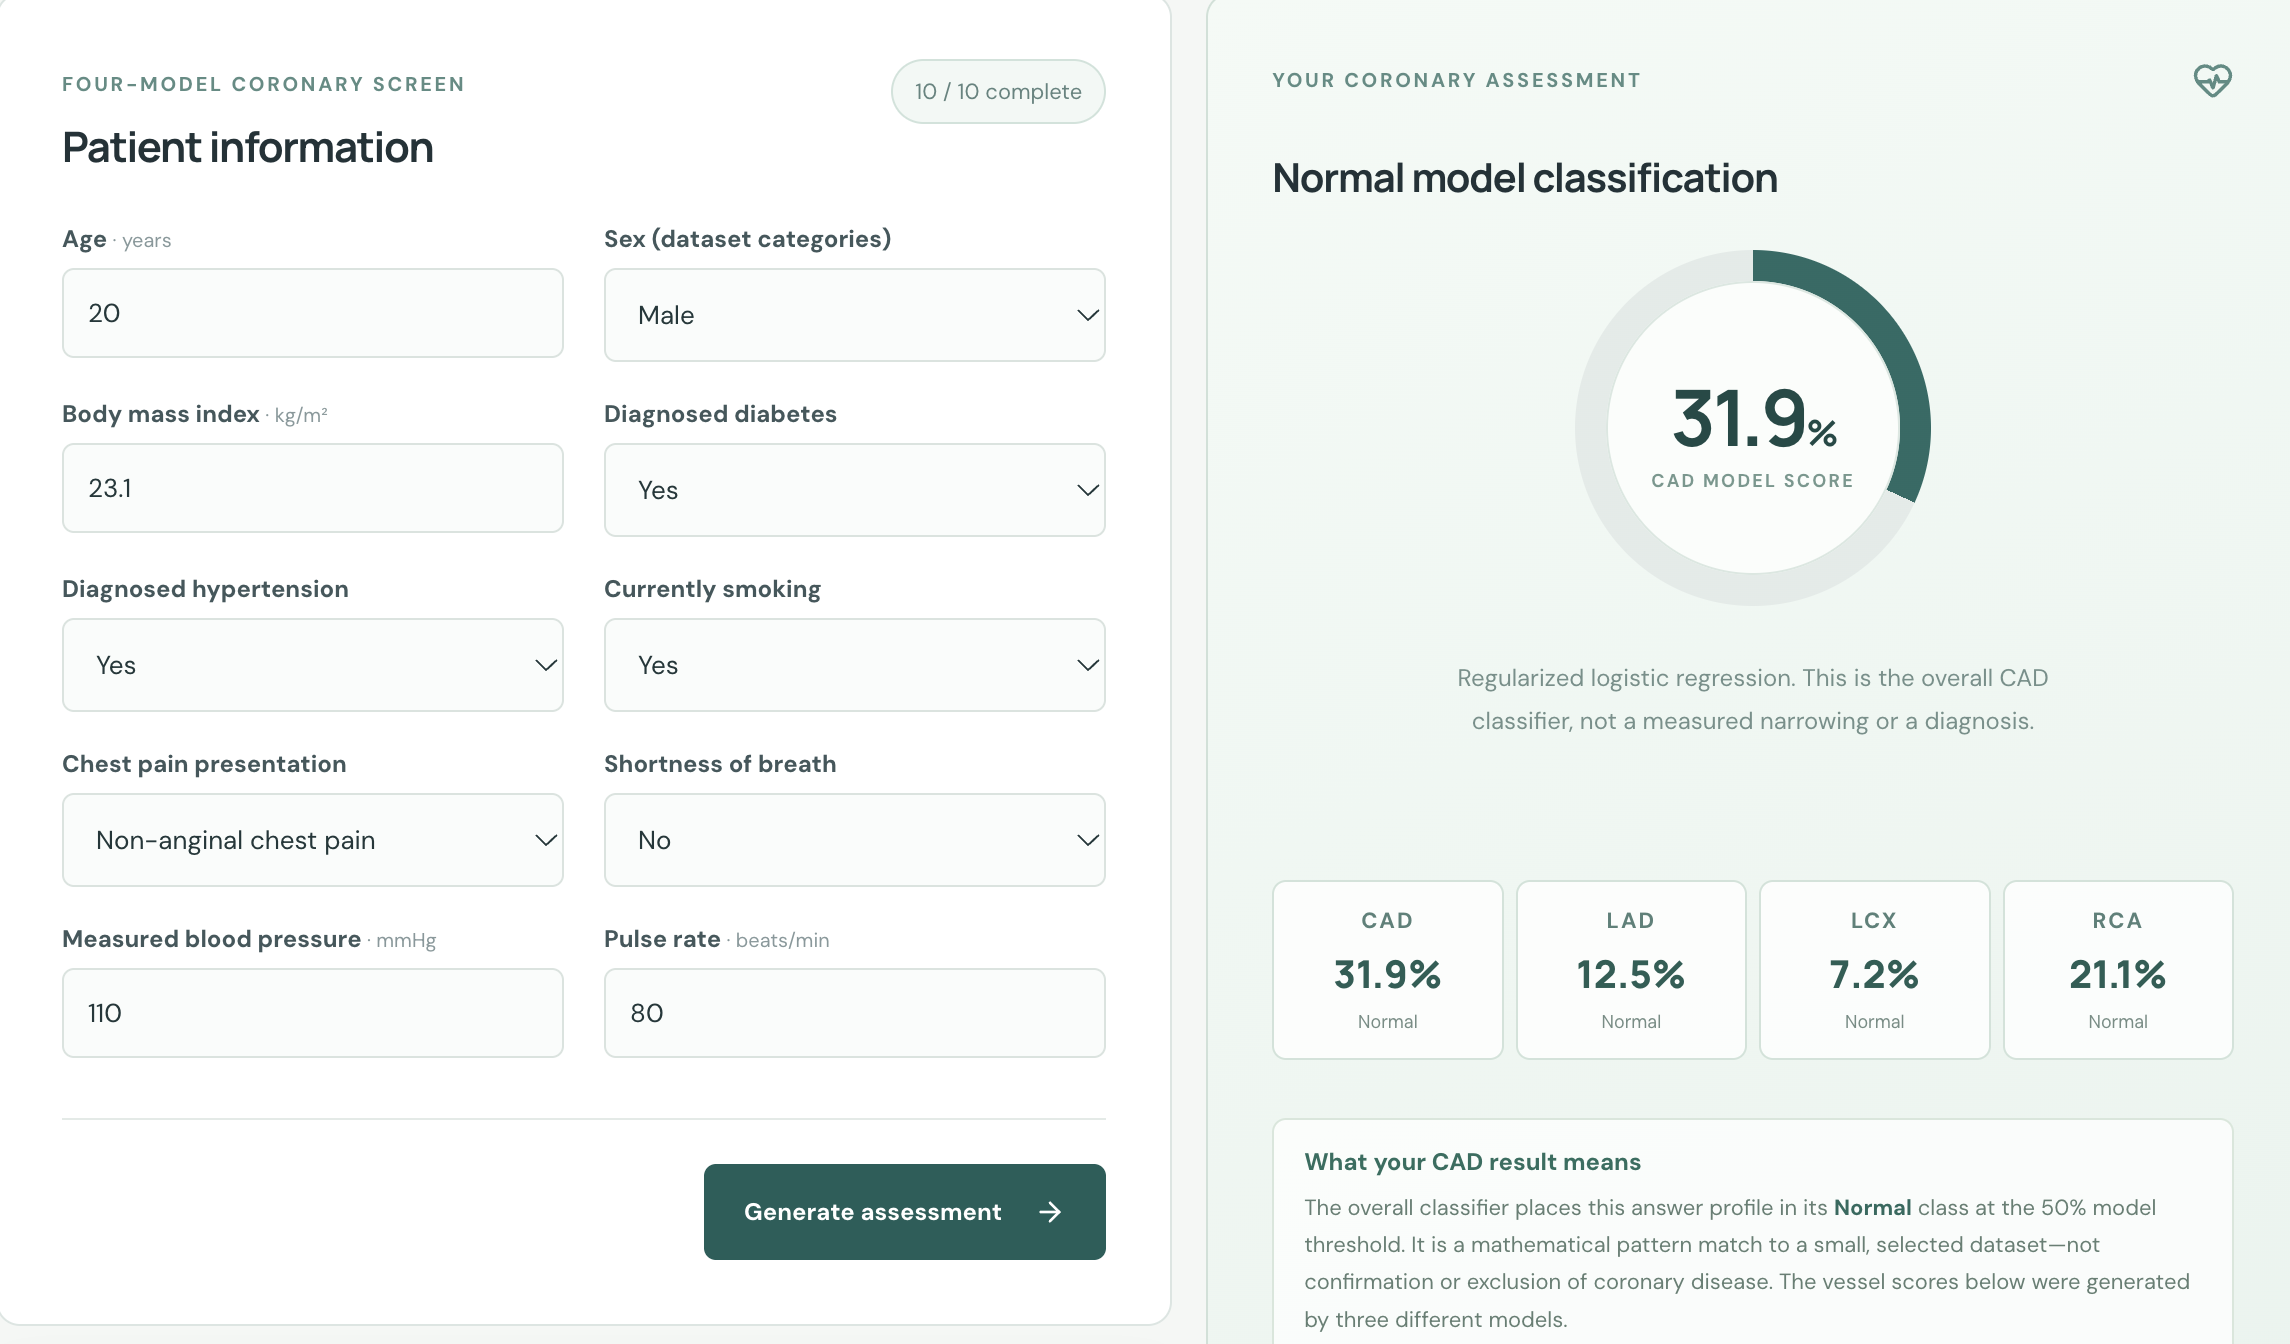
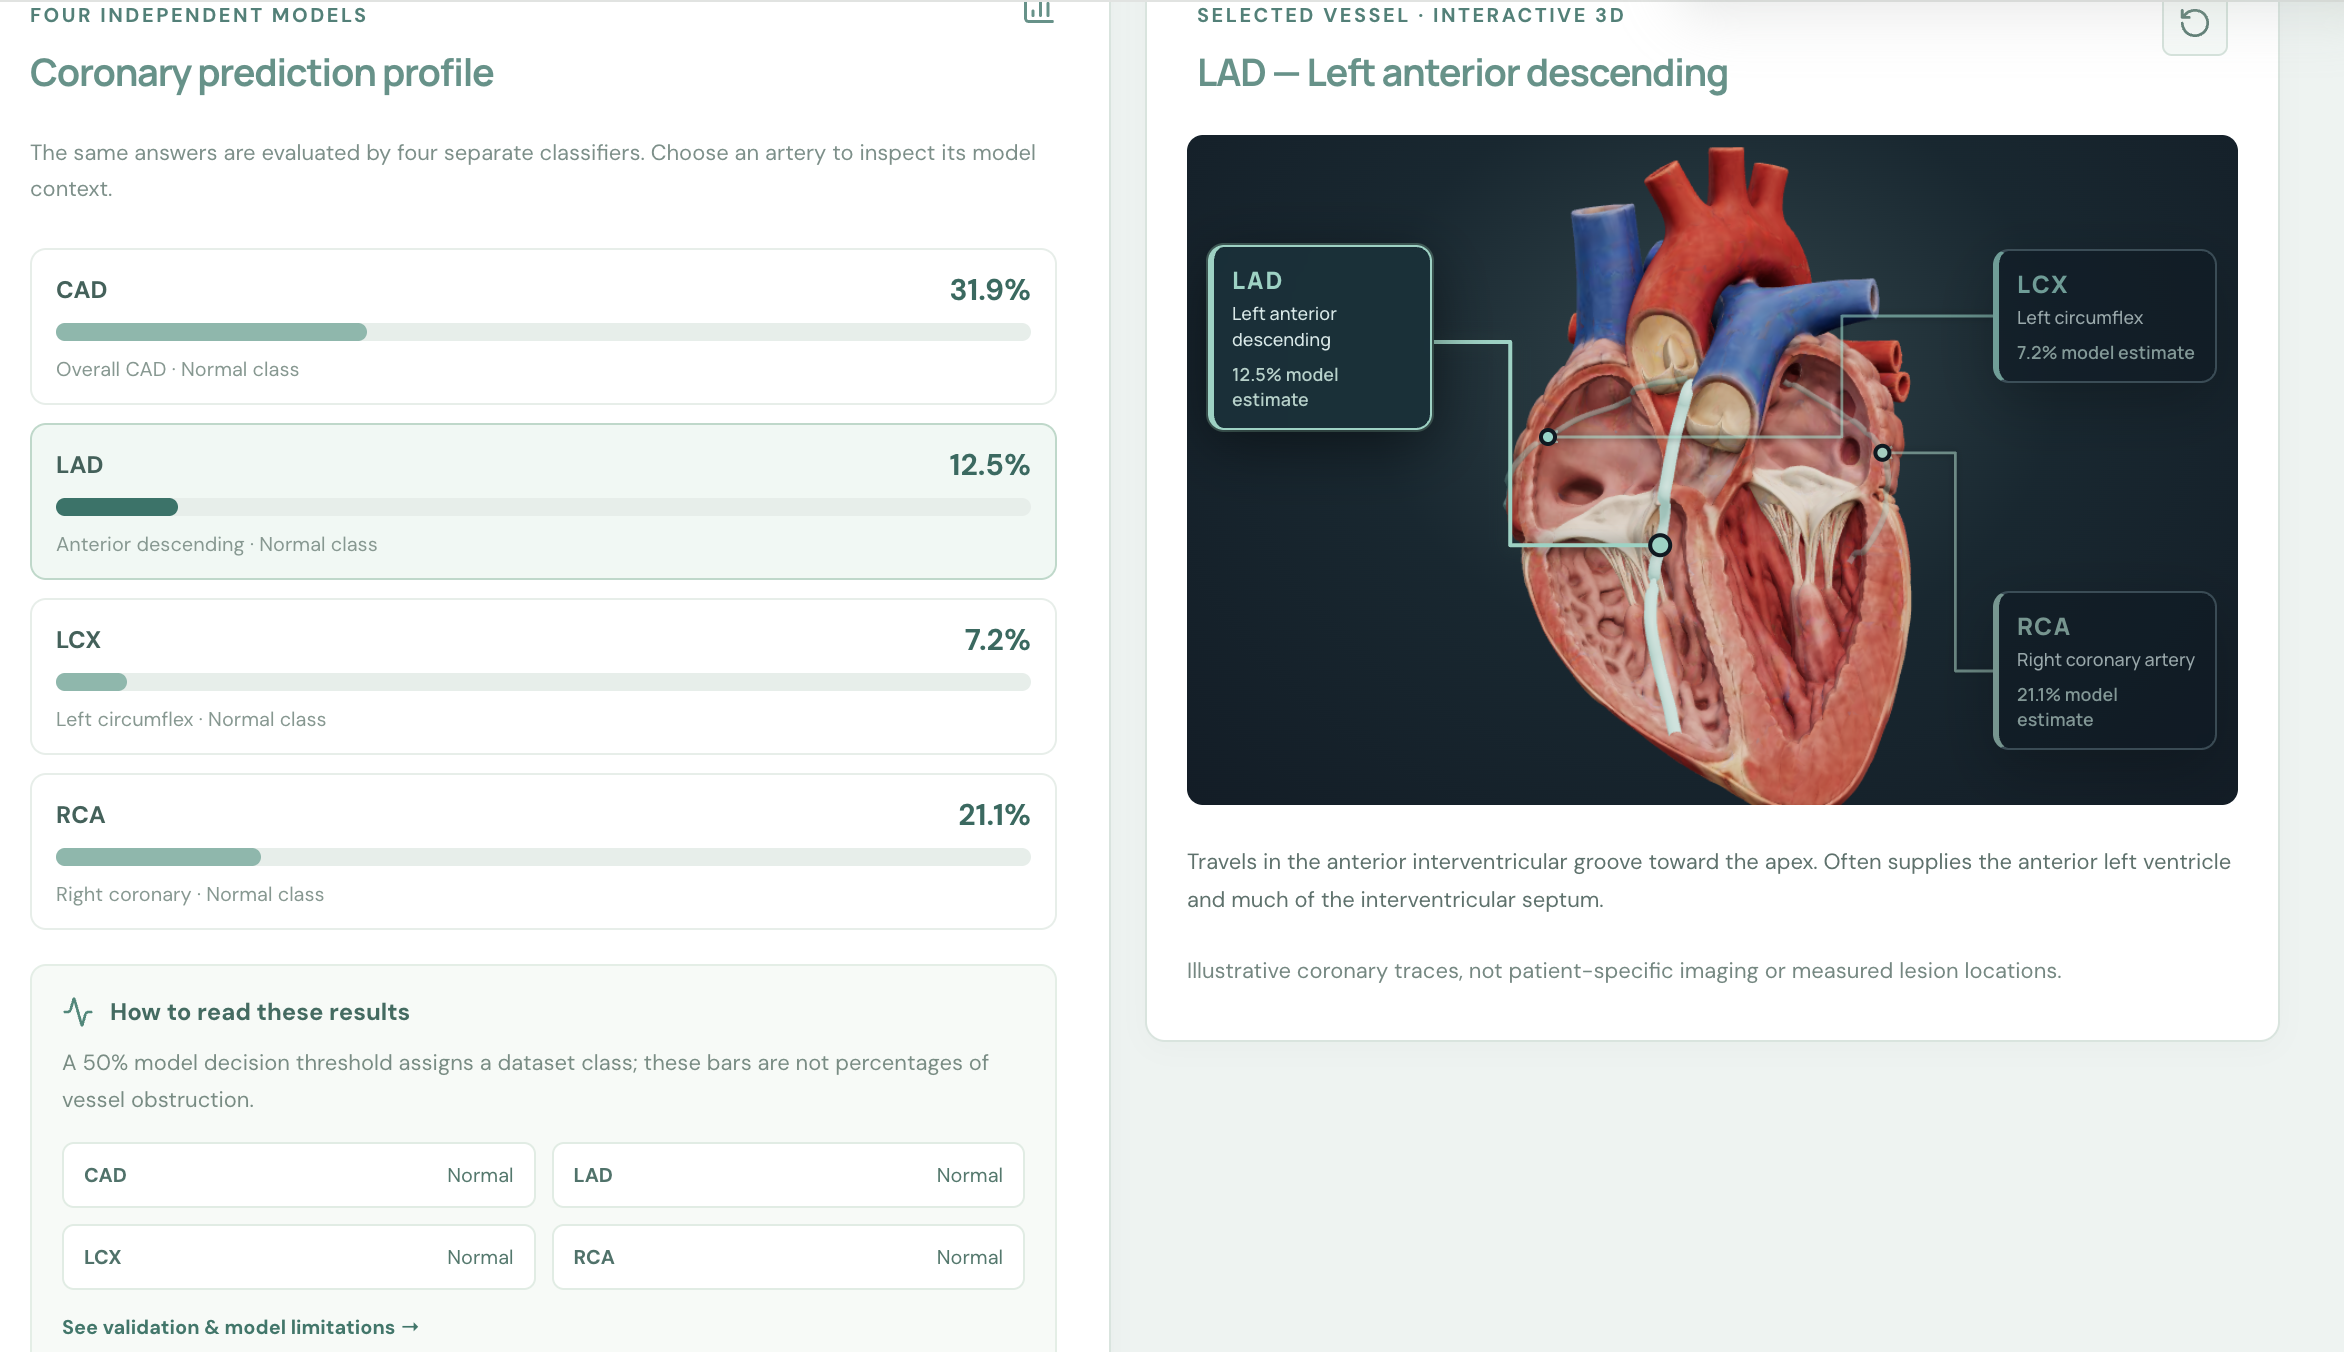
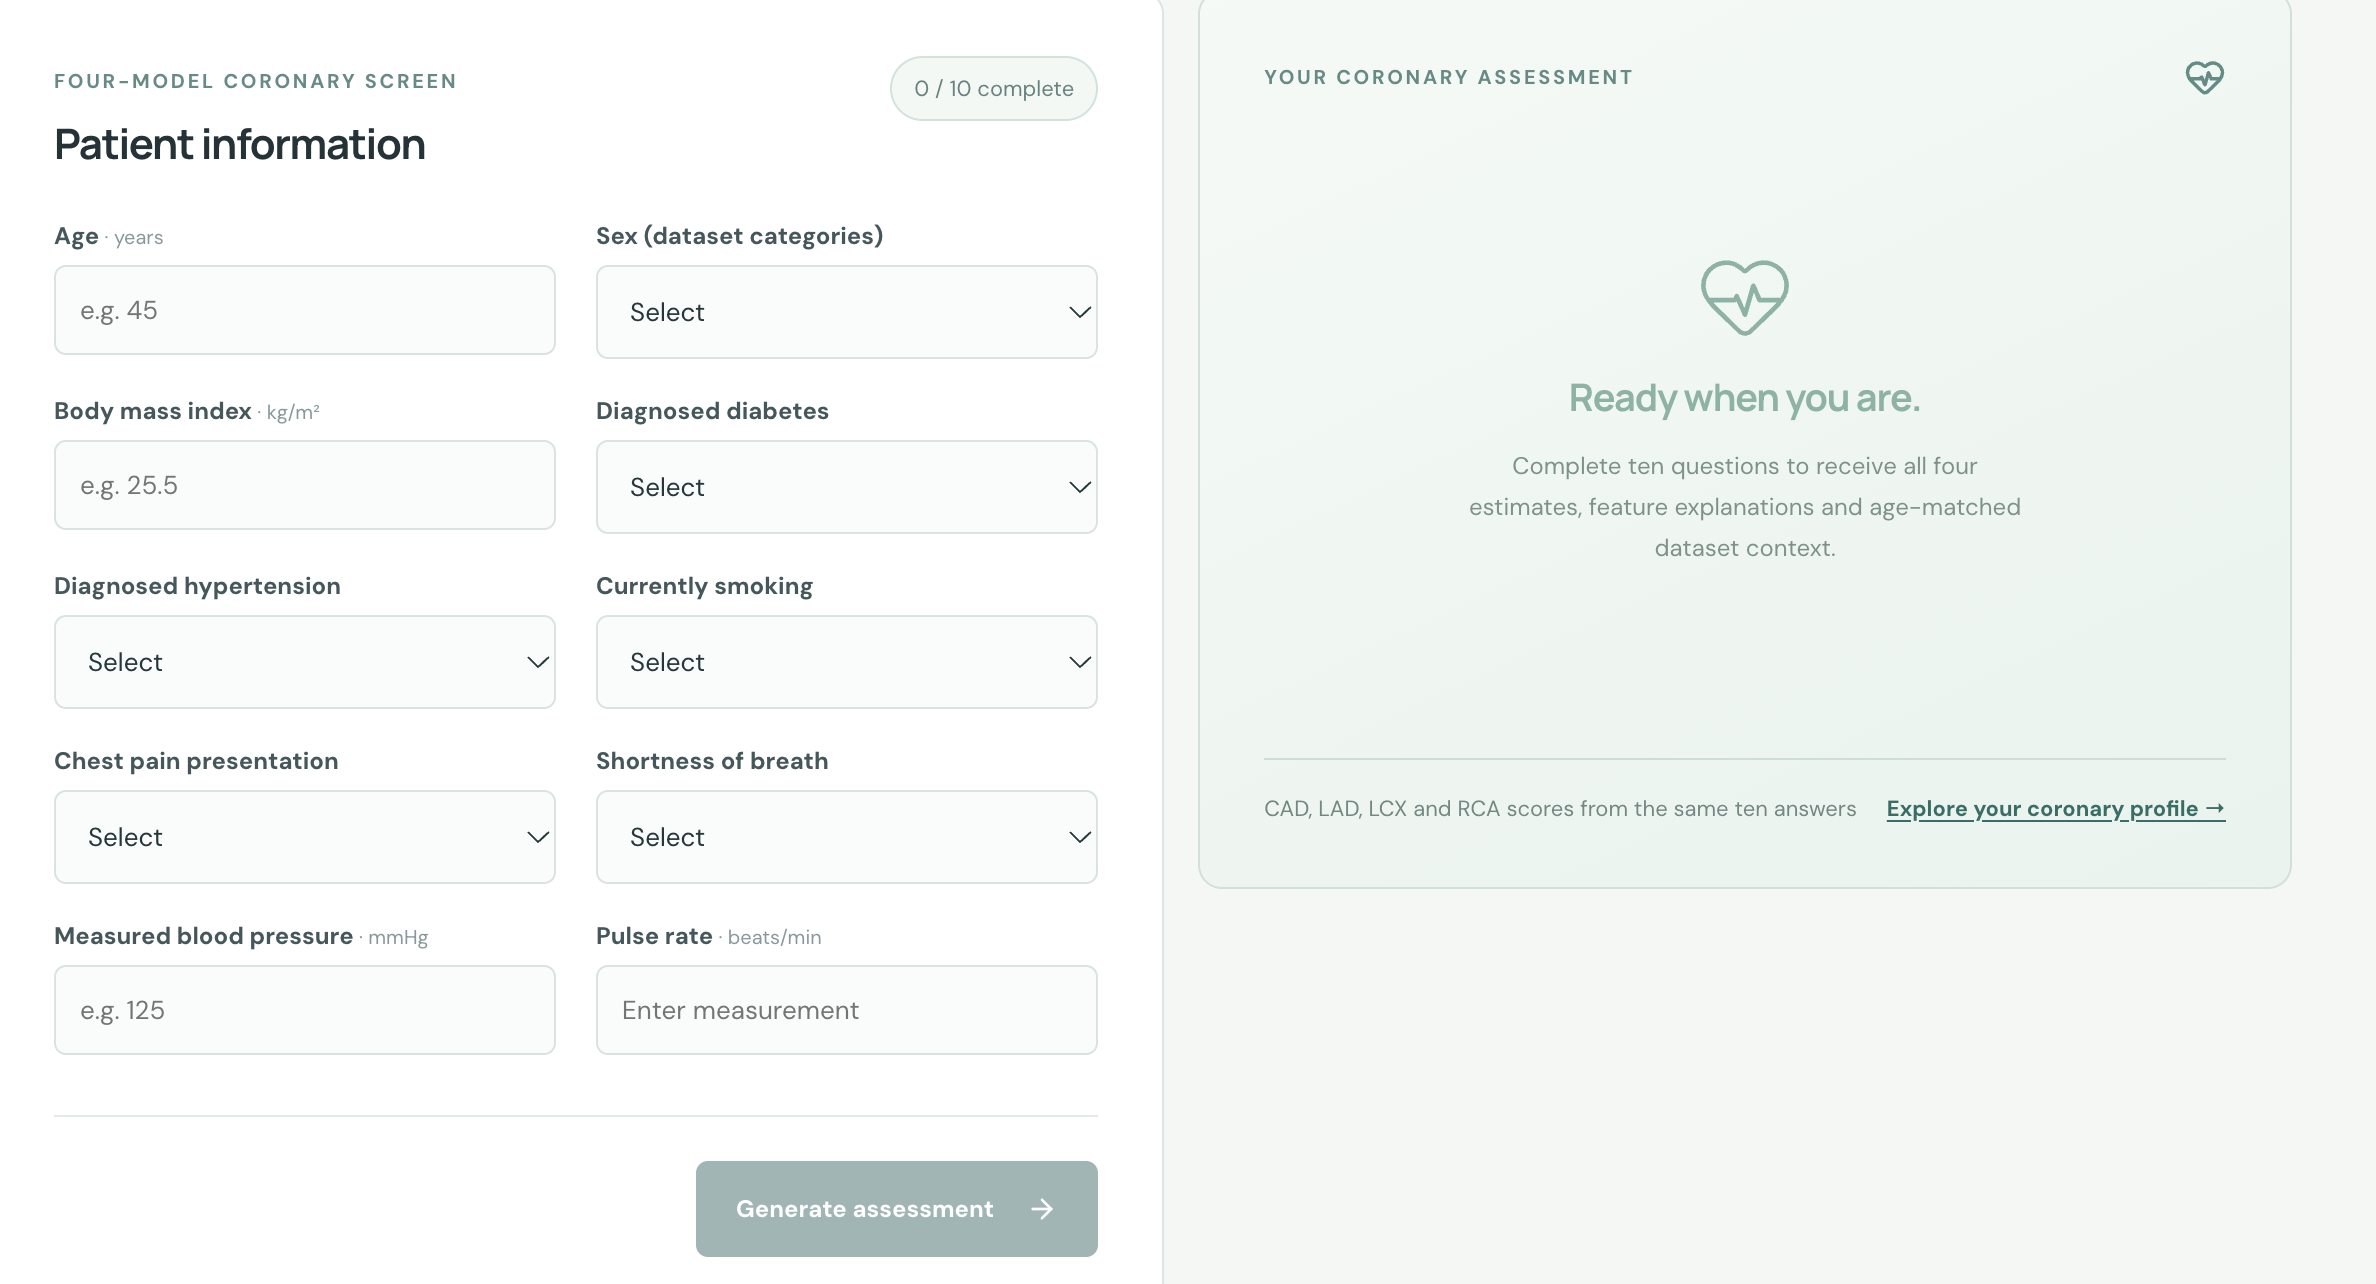
2. AI-Powered Cardiovascular Prediction Engine CardioVision includes four independently trained machine-learning classifiers: CAD ** - Overall coronary artery disease classification; **LAD- Left anterior descending artery stenosis classification; LCX- Left circumflex artery stenosis classification; RCA- Right coronary artery stenosis classification; We developed a streamlined 10-question patient assessment using accessible clinical and physiological information: Age and sex; Body mass index (BMI); Diabetes and hypertension history; Smoking status; Chest pain characteristics; Breathlessness; Blood pressure; Pulse rate; These inputs are processed through trained machine-learning pipelines, producing four independent model estimates. The application presents the outputs through intuitive scorecards, graphical comparisons, and contextual explanations.
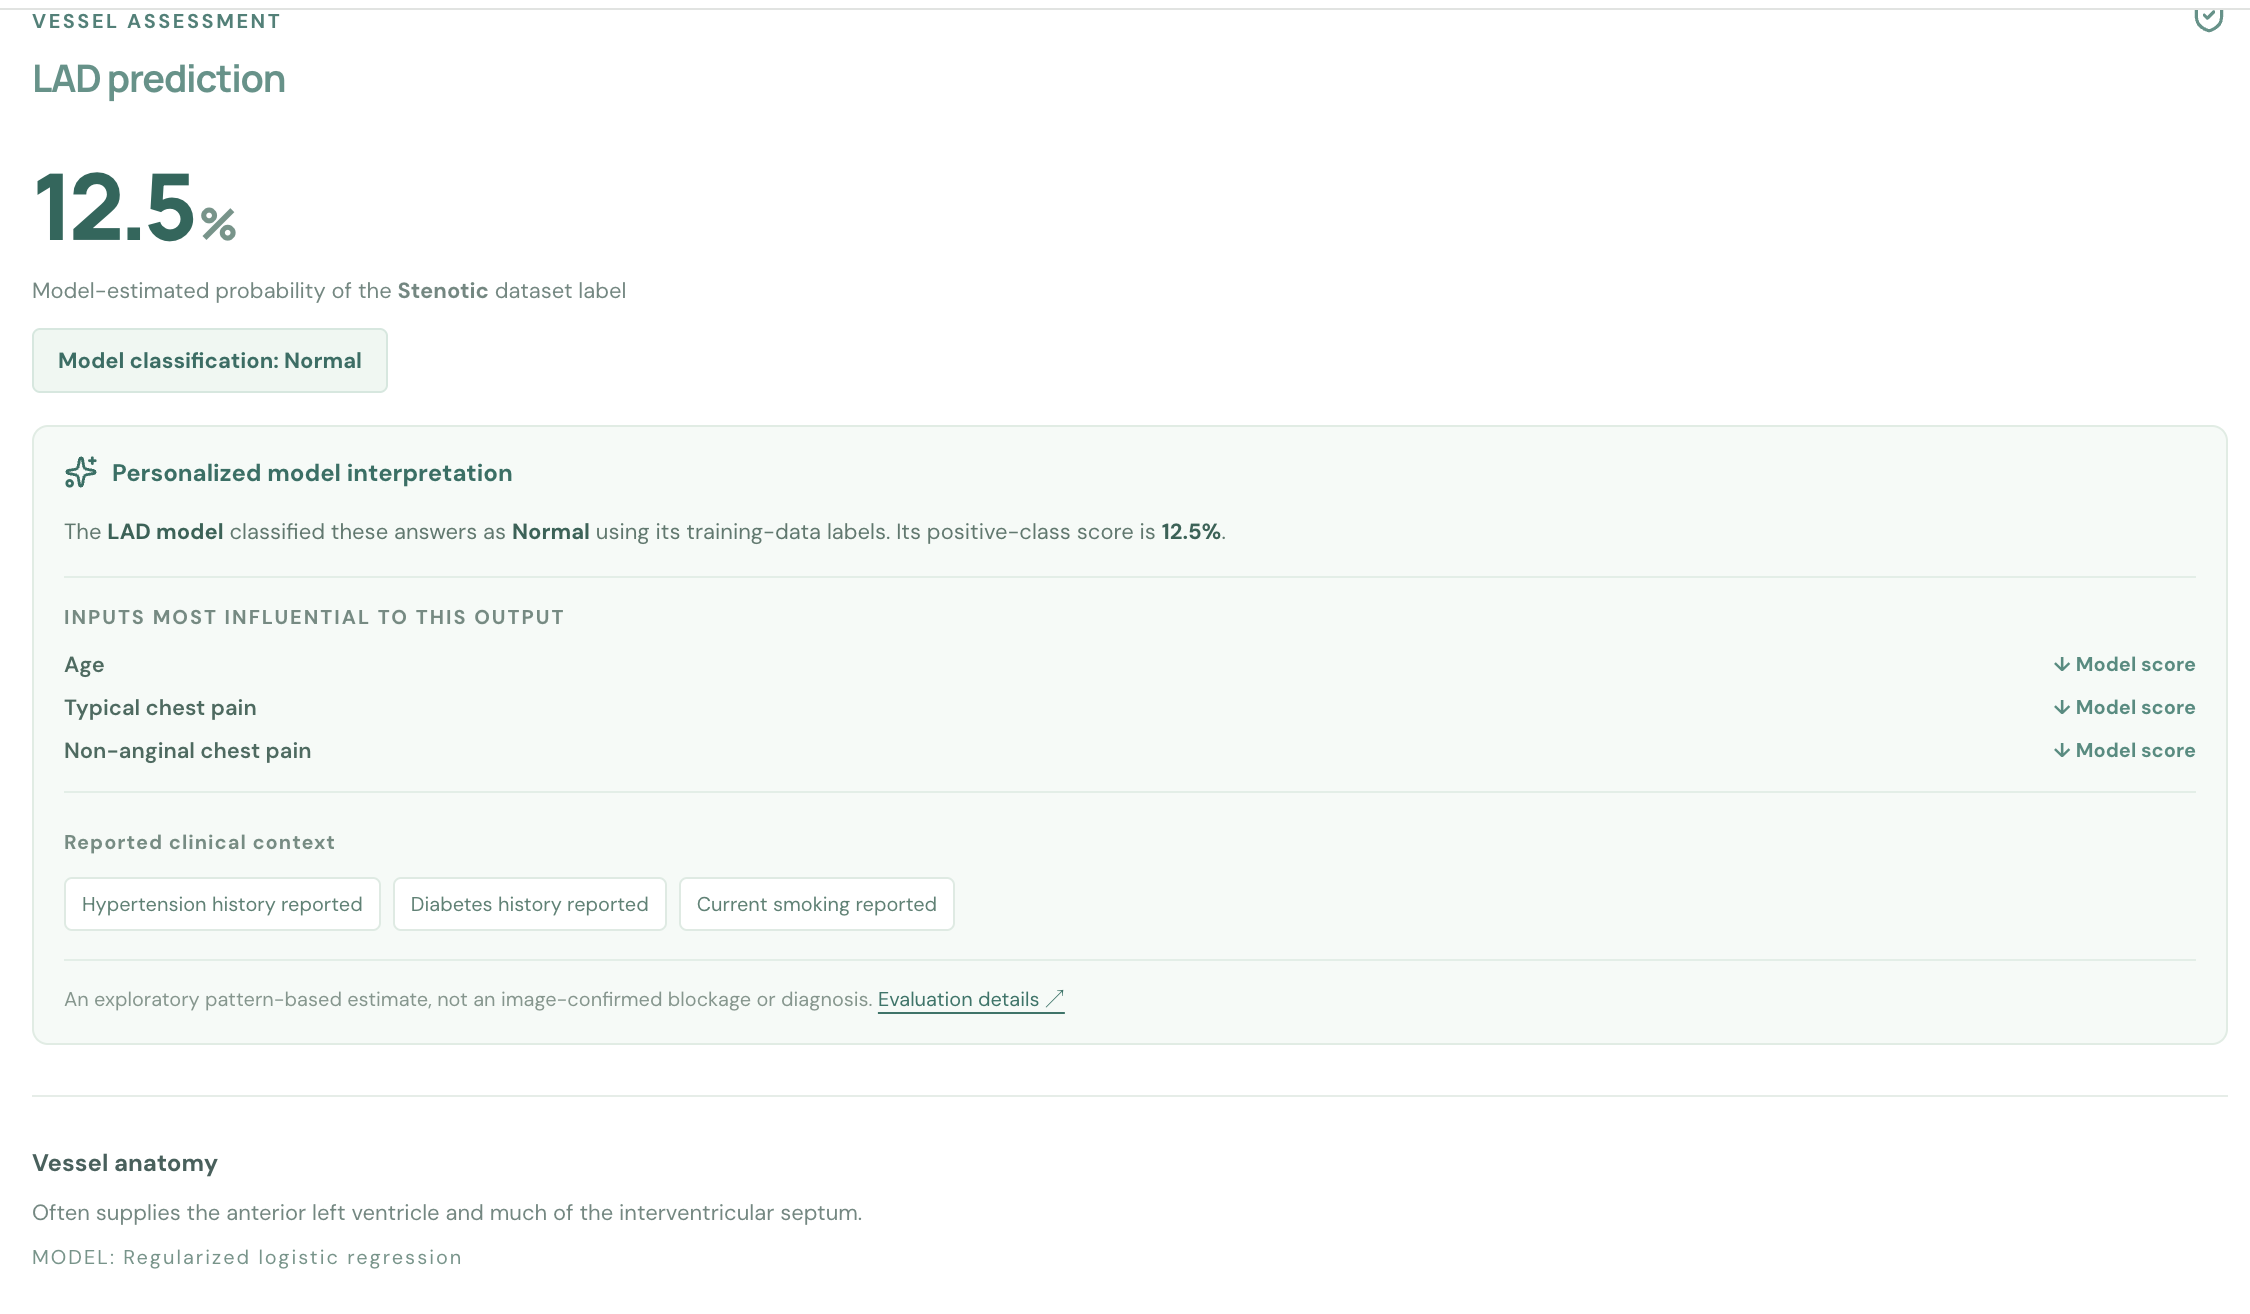
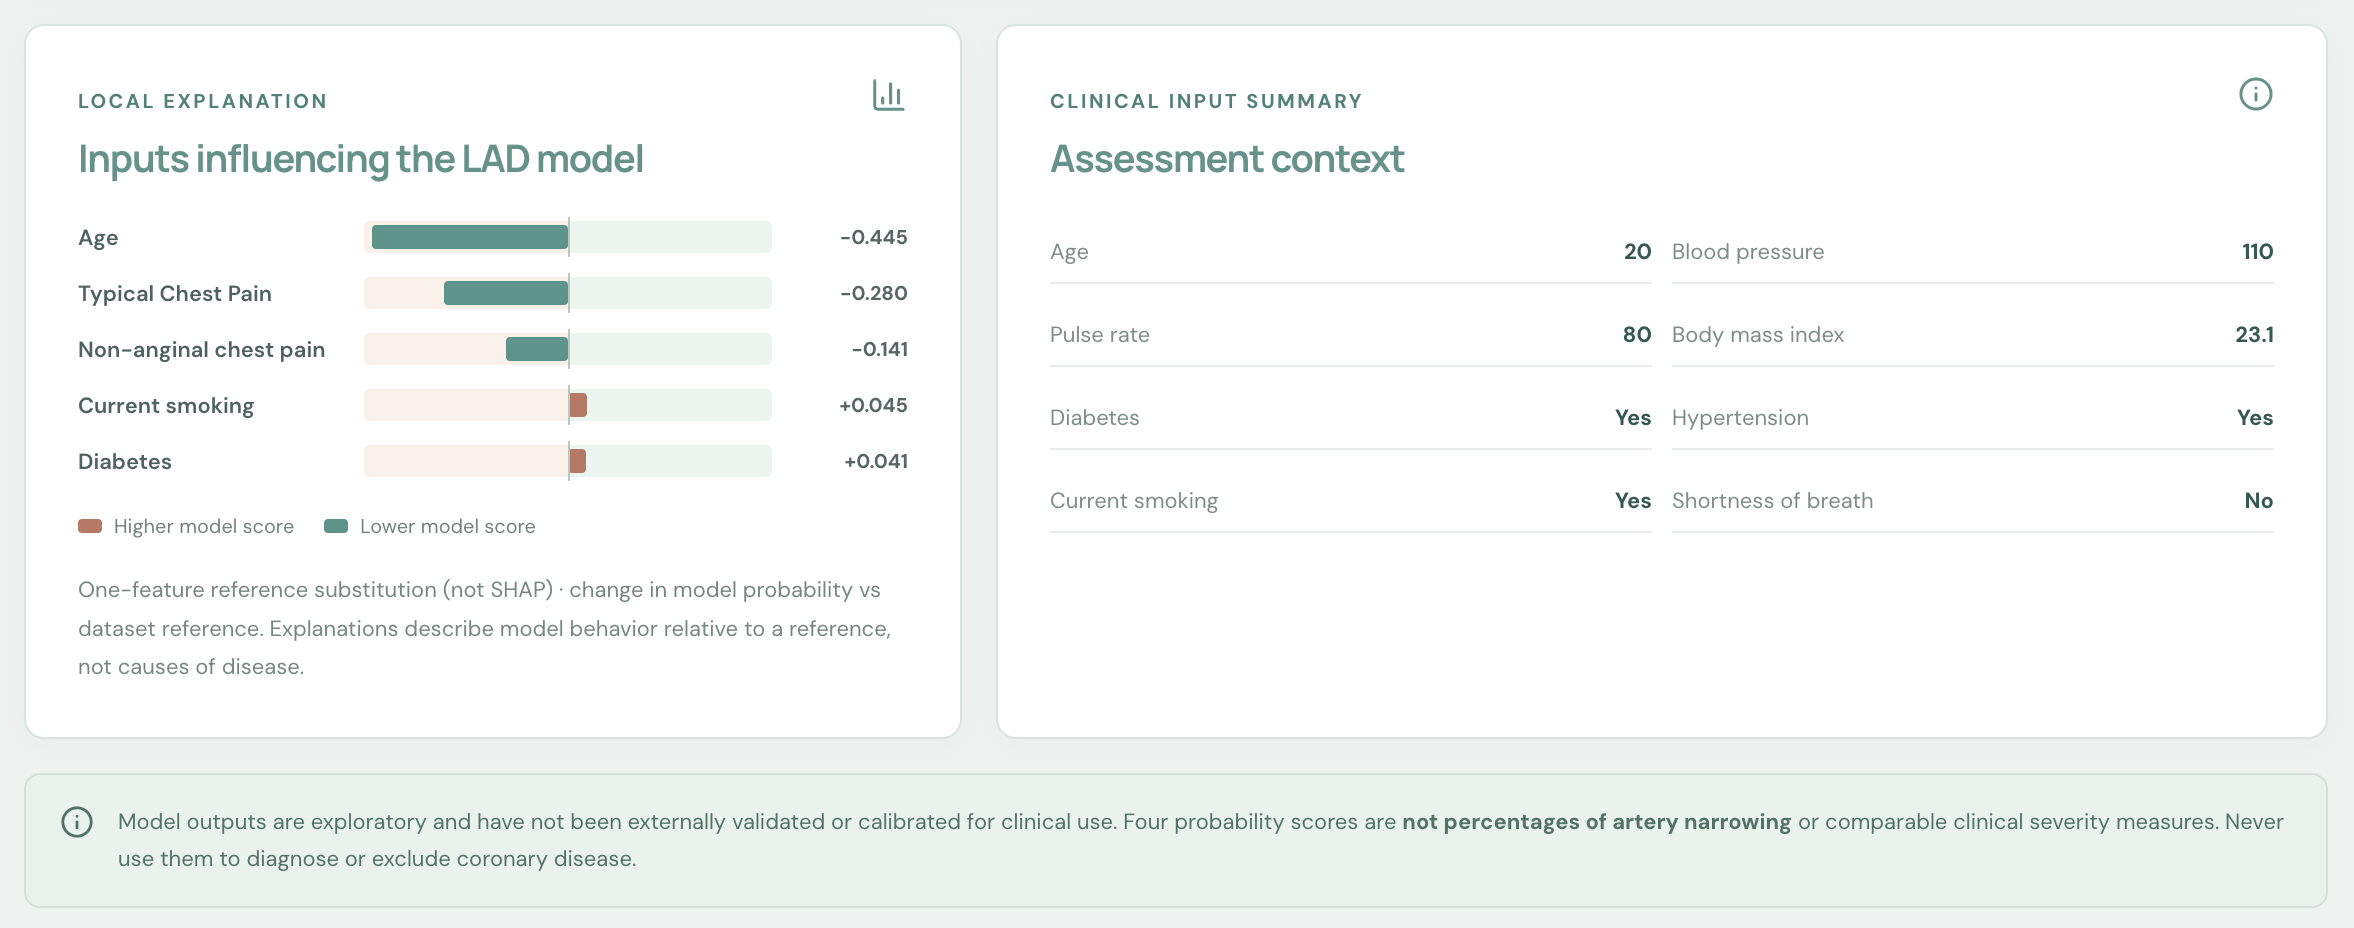
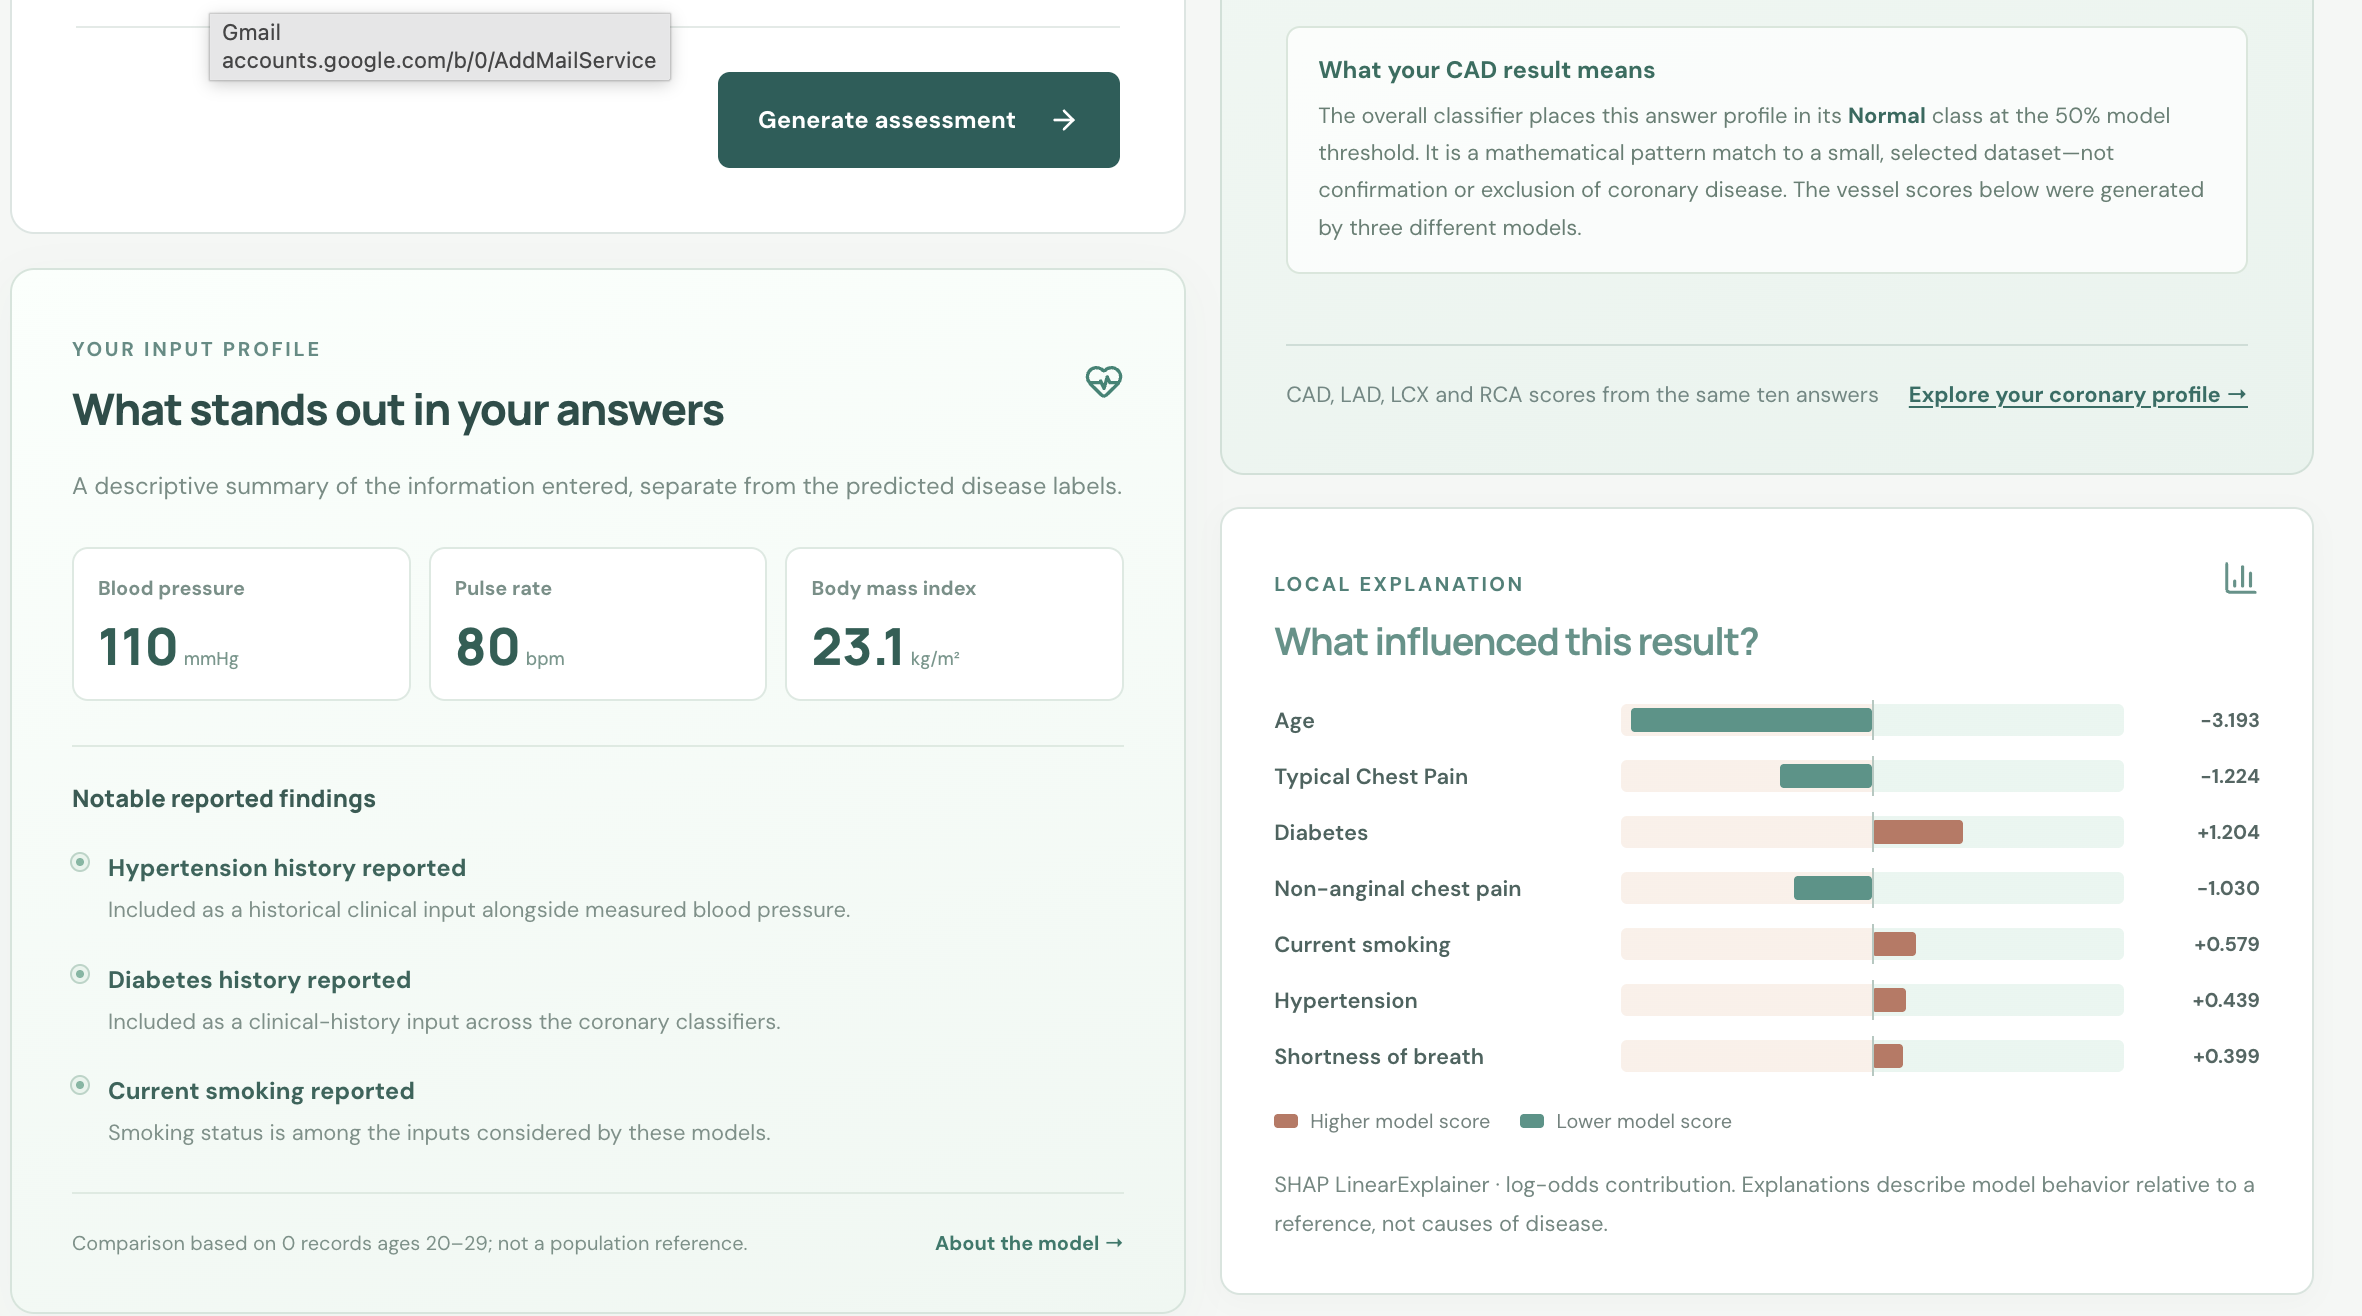
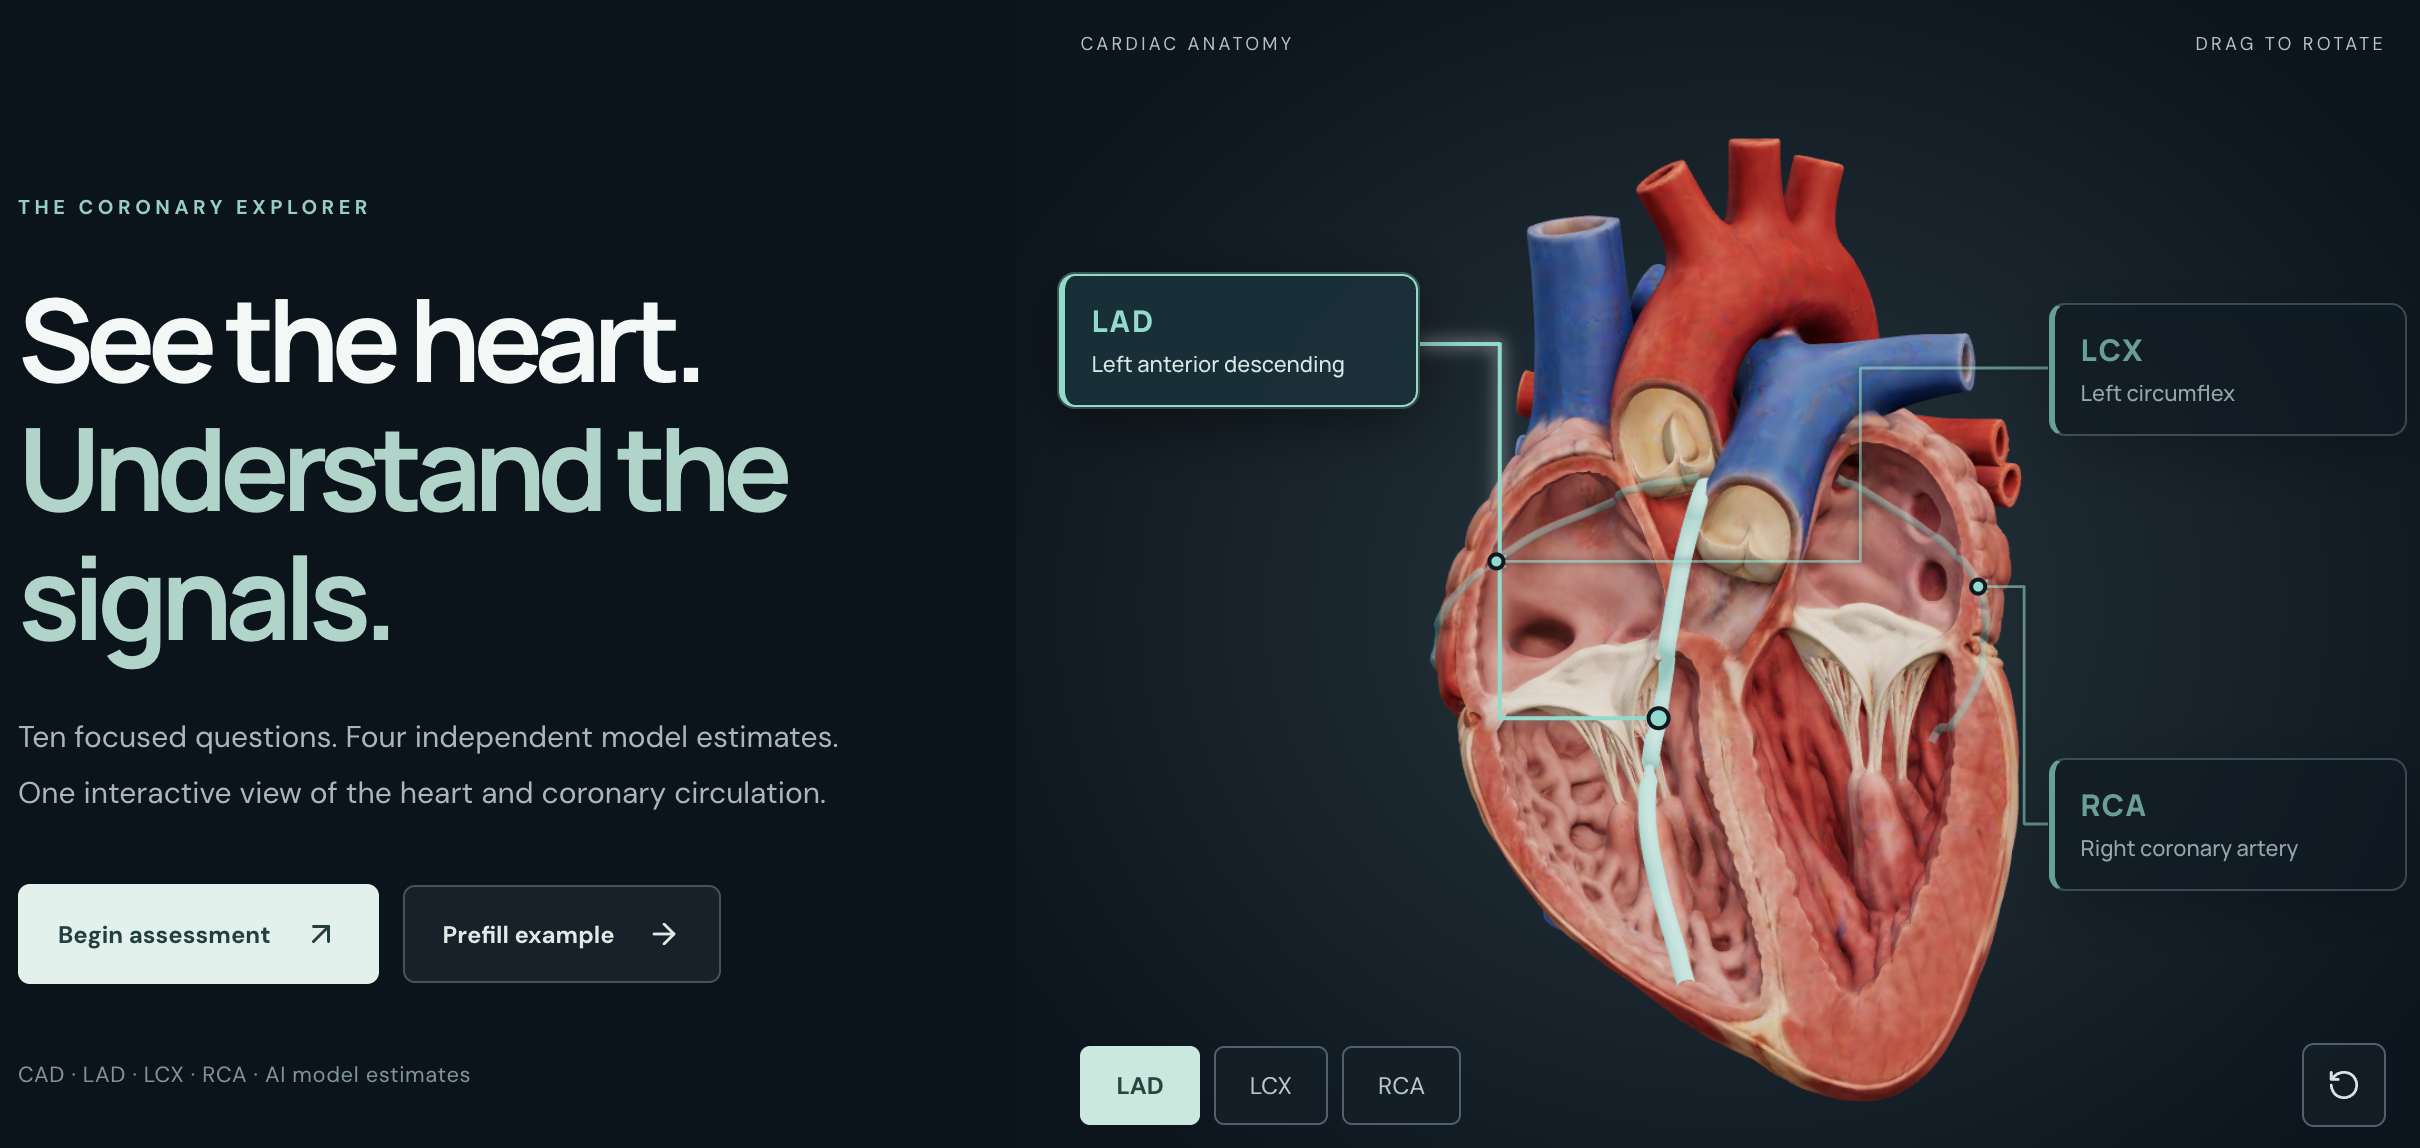
3. Clinical Explanation Dashboard and Interactive 3D Heart We wanted CardioVision to explain its predictions rather than simply display numerical results. Our clinical explanation dashboard brings together: CAD, LAD, LCX, and RCA prediction metrics. SHAP-based feature contributions for supported models. Reference-based feature-sensitivity explanations for other models. Patient physiological measurements and submitted inputs. Visual comparisons between coronary model outputs. Historical dataset comparisons and assessment context. We also integrated an interactive 3D anatomical heart, developed using Three.js and React Three Fiber. Users can rotate, zoom, and explore the heart while selecting the LAD, LCX, and RCA coronary arteries. The visualization connects each artery to the corresponding machine-learning prediction. The anatomical model provides an intuitive reference for understanding coronary structures. By combining connected records, independent predictions, explanations, and 3D anatomy, CardioVision aims to make cardiovascular information more accessible and understandable.
How we built it
Developing CardioVision required an end-to-end engineering workflow covering clinical data analysis, feature engineering, machine learning, explainability, frontend development, backend integration, and cloud deployment. 1. Dataset Selection and Preprocessing We used the UCI Extension of the Z-Alizadeh Sani Dataset, containing: 303 patient records, 59 columns , 55 eligible predictor columns 4 target variables: Cath, LAD, LCX, and RCA We began with exploratory data analysis and dataset-quality checks, including missing-value analysis, duplicate detection, categorical consistency, target distributions, and feature correlations. Our preprocessing and feature-engineering investigations included BMI relationships, redundant predictors, feature dependencies, and clinically relevant transformations. A critical design decision was preventing target leakage. All four target columns were excluded from the input feature matrix, including when training models for individual coronary arteries. This ensured that one target label could not inadvertently provide information about another prediction target. We also identified a target-label inconsistency and examined feature relationships that could introduce redundancy. 2. Model Training and Algorithm Comparison Rather than relying on a single algorithm, we experimented with multiple supervised machine-learning approaches: Logistic Regression; Random Forest Classifier; Gradient Boosting Classifier; Support Vector Machines (SVM/SVC); We compared their suitability for overall CAD classification and individual coronary artery predictions. Our experimentation included preprocessing variations, feature-engineering approaches, cross-validation, hyper parameter comparisons, and held-out evaluation. The full-feature research experiments produced the following recorded internal test ROC-AUC scores:
CAD Gradient Boosting 0.839 ; LAD Random Forest 0.830 ; LCX Random Forest 0.705 ; RCA Support Vector Classifier. 0.736 ; We evaluated models using Accuracy, Precision, Recall, F1 Score, and ROC-AUC, rather than relying exclusively on accuracy. 3. Reduced-Input Machine Learning An important challenge was making the prediction system accessible through a short assessment rather than requiring all 55 research features. We developed a separate reduced-input pipeline based on 10 user-facing clinical questions. Dedicated models were trained for the individual coronary targets, allowing the platform to generate CAD, LAD, LCX, and RCA outputs from the same assessment interface. The reduced-input vessel models achieved preliminary held-out ROC-AUC values of approximately: LAD: 0.760 ; LCX: 0.670 ; RCA: 0.707 ; ** These experiments showed that a simplified assessment interface was technically feasible, although model performance varied across the coronary targets. The full-feature and reduced-input models were evaluated separately because they use different predictor sets. *4. Explainable Artificial Intelligence * To make the model behavior more interpretable, **we developed feature-explanation components using SHAP where supported, alongside reference-based input sensitivity analysis. These methods help users understand which inputs influenced the model's output. We also designed physiological-information panels and dataset-comparison visualizations to provide additional context. 5. Frontend and 3D Development We built the frontend using React, TypeScript, Vite, HTML, and CSS. Our goal was to create a responsive healthcare interface that balances technical depth with usability. The interactive 3D cardiac visualization was developed using: Three.js React Three Fiber WebGL GLB anatomical assets We implemented camera controls, vessel selection, dynamically positioned annotations, interactive coronary labels, and responsive viewing behavior 6. Backend and Doctor–Patient Integration We used Python and FastAPI for backend development. The backend handles input validation, model inference, prediction responses, analytics, and the demonstration care-portal endpoints. We expanded the platform to include: Patient and doctor account interfaces; Authentication workflows.; Patient-controlled record-sharing mechanisms.; Medical document management.; Assessment-history tracking.; Clinician-authored consultation notes and care plans.; This allowed us to extend CardioVision beyond a standalone AI prediction tool into a connected healthcare application. ** 7. Cloud Deployment** We deployed the application using: Vercel for frontend hosting. Render for the Python/FastAPI backend. GitHub for version control and collaborative development. The architecture separates the user interface, application services, and trained machine-learning artifacts, making the system easier to maintain and extend.
Challenges we ran into
1. Working With a Limited Clinical Dataset Our dataset contained only 303 records, making overfitting, class imbalance, and unstable evaluation particularly important concerns. We addressed these challenges through exploratory analysis, algorithm comparisons, cross-validation, held-out testing, and careful target separation. We also learned that the predictive performance of individual coronary artery models can differ substantially.
** 2. Reducing 55 Features to a 10-Question Assessment** Balancing predictive performance with user accessibility was one of our most significant technical challenges. A 55-feature clinical assessment may contain more information, but is less convenient for a public-facing interface. We therefore trained dedicated reduced-input models instead of assuming missing measurements were available or using placeholder clinical values. This required additional feature selection, model experimentation, and validation. 3. Integrating Interactive 3D Anatomy Combining a detailed anatomical asset with a responsive prediction dashboard presented several frontend challenges. These included rendering performance, camera positioning, model scale, click interactions, and keeping artery annotations correctly aligned during rotation and resizing. We iteratively refined the rendering pipeline and vessel-label components to improve usability. ** 4. Deploying Machine-Learning Models to the Cloud ** Our system worked locally before we encountered deployment challenges involving Python dependencies, model artifacts, environment variables, CORS restrictions, frontend API configuration, and Render server behavior. Debugging these issues required testing individual API endpoints, examining browser network requests, inspecting deployment logs, and validating frontend–backend communication. 5. Building a Connected Doctor–Patient Workflow Introducing separate patient and doctor dashboards increased the complexity of the application. We had to address authentication, account-specific interfaces, record-sharing permissions, report organization, assessment history, and clinician-authored plans. We also recognized the additional responsibilities associated with handling sensitive medical information. Our current implementation is designed for demonstration and requires stronger persistent storage, verification, privacy, and security controls before real clinical deployment. 6. Making Predictions Understandable Presenting numerical predictions alone was not sufficient, we had to find ways to make model behavior understandable without implying that an AI-generated score represented an actual arterial blockage or medical diagnosis, this motivated the development of the explanation dashboard, physiological breakdowns, and interactive anatomical visualization.
Accomplishments that we're proud of
Our biggest accomplishment was bringing together multiple technically complex components into one integrated cardiovascular platform. 1. Developed four independent AI prediction workflows We built separate classifiers for CAD, LAD, LCX, and RCA rather than relying on a single generalized score. 2. Created a streamlined cardiovascular assessment We converted a complex clinical-data workflow into a practical ten-question interface supported by dedicated reduced-input models. 3. Integrated an interactive 3D heart We developed a browser-based anatomical viewer with rotation, zoom, selectable coronary vessels, and model-linked explanations. 4. Built explainable prediction dashboards We combined model scores, visual comparisons, feature contributions, and physiological measurements into an interpretable interface. 5. Developed connected doctor and patient workspaces We implemented demonstration dashboards supporting account access, shared medical records, assessment history, reports, and clinician-authored care plans. 6. Deployed a working full-stack application We integrated React, TypeScript, FastAPI, scikit-learn, and WebGL into a cloud-hosted system accessible through a public website. 7. Applied a structured machine-learning methodology We performed feature analysis, target-leakage prevention, algorithm comparisons, cross-validation, and held-out evaluation. 8. Combined biotechnology knowledge with software engineering As Biotechnology students, we are particularly proud of developing a project that brings together cardiovascular science, artificial intelligence, software development, and human-centered interface design.
What we learned
CardioVision taught us that developing meaningful healthcare technology requires much more than training a model and displaying its accuracy. Machine Learning and Data Science: We gained practical experience with preprocessing clinical datasets, feature engineering, model selection, cross-validation, overfitting, classification metrics, and explainability. Full-Stack Engineering: We learned how to connect a React and TypeScript frontend to a Python/FastAPI backend, manage API endpoints, handle cloud deployment, and debug production issues. Interactive Visualization: We developed hands-on experience with Three.js, React Three Fiber, WebGL, anatomical models, coordinate transformations, and interactive 3D interfaces. Healthcare Product Design: **We learned that clinical information must be presented carefully, with clear explanations, accessible workflows, and appropriate separation between algorithmic estimates and medical decisions. **Connected-Care Architecture: **Building doctor and patient dashboards helped us understand authentication, consent-based access, longitudinal health records, and the importance of secure information management. **Collaboration and Problem-Solving: **We learned how to divide responsibilities across frontend development, machine learning, and research while maintaining a coherent product architecture. **Our most important takeaway was that the value of healthcare AI depends not only on predictive performance, but also on interpretability, usability, reliability, and its ability to support real clinical workflows.
What's next for CardioVision AI
We envision CardioVision evolving from a full-stack hackathon prototype into a secure and clinically evaluated cardiovascular intelligence platform.
- Clinical Validation and Improved Models We plan to investigate larger, independent datasets, improve feature engineering, evaluate calibration, strengthen weaker vessel-specific classifiers, and collaborate with qualified medical professionals on validation.
- Advanced Doctor–Patient Care Management We want to expand the connected-care platform with longitudinal health monitoring, appointment management, secure clinician communication, structured follow-up plans, and improved patient-history visualization.
- Medical Report Intelligence We plan to explore OCR and document-processing workflows that can organize uploaded laboratory results, extract relevant measurements, and present information for clinician review.
- Enhanced Explainable AI Future versions could include richer SHAP visualizations, more intuitive feature explanations, model-comparison tools, and clearer communication of predictive uncertainty.
- Improved 3D Cardiovascular Visualization We aim to improve anatomical accuracy, rendering performance, vessel interaction, and visual integration with the prediction dashboard. Patient-specific imaging would require a separate, appropriately validated medical-imaging pipeline.
- Security, Interoperability, and Scalability Before handling real medical records, we would need durable encrypted storage, clinician identity verification, audit trails, robust access control, and applicable healthcare-data compliance. We also intend to investigate interoperability with electronic health records and relevant digital-health standards.
- Accessibility and Wider Adoption We want to develop multilingual interfaces, mobile-friendly workflows, and low-bandwidth support to improve accessibility across diverse healthcare settings. Ultimately, our goal is to make CardioVision a platform where patients can better organize and understand their cardiovascular information, doctors can review information more efficiently, and AI-powered tools can support evidence-informed healthcare workflows. CardioVision AI — Connecting Patients. Empowering Doctors. Advancing Cardiac Care.

Log in or sign up for Devpost to join the conversation.