-
-
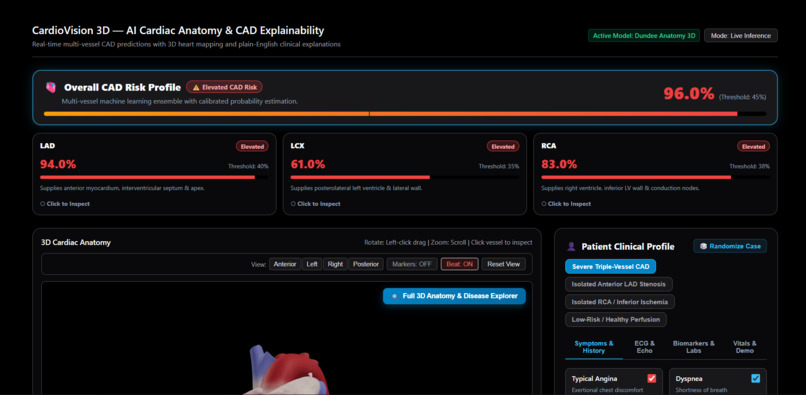
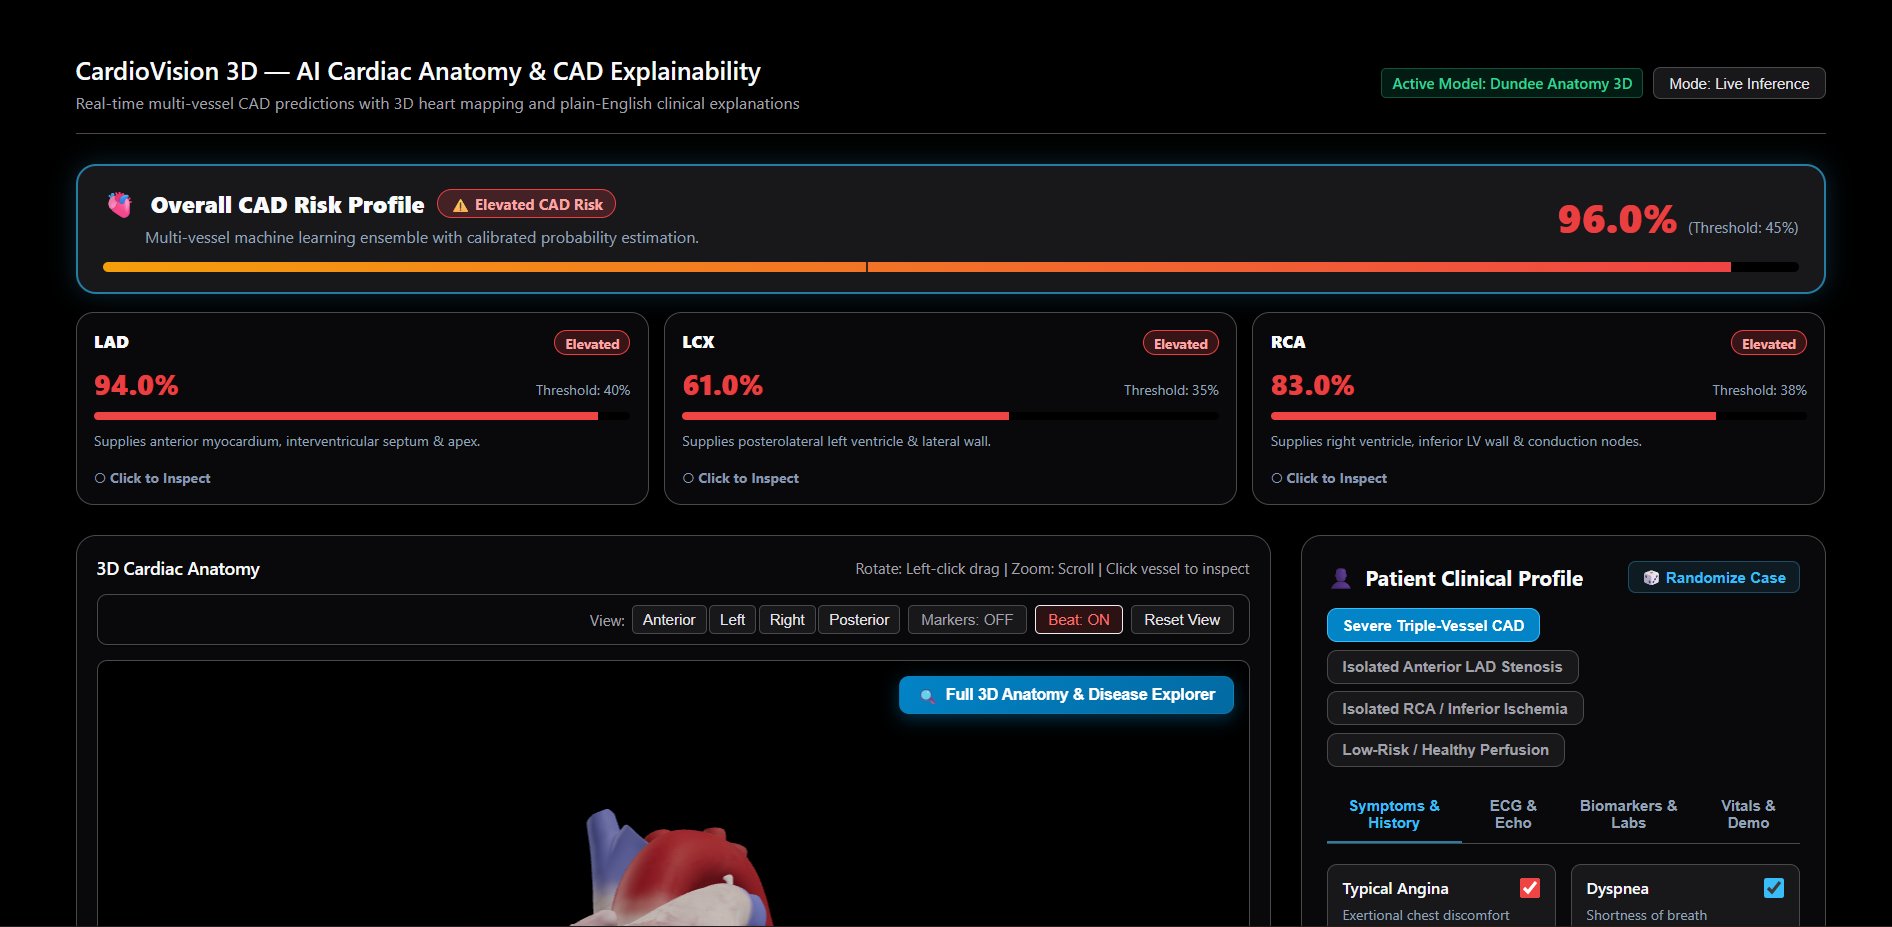
the home page of the webiste
-
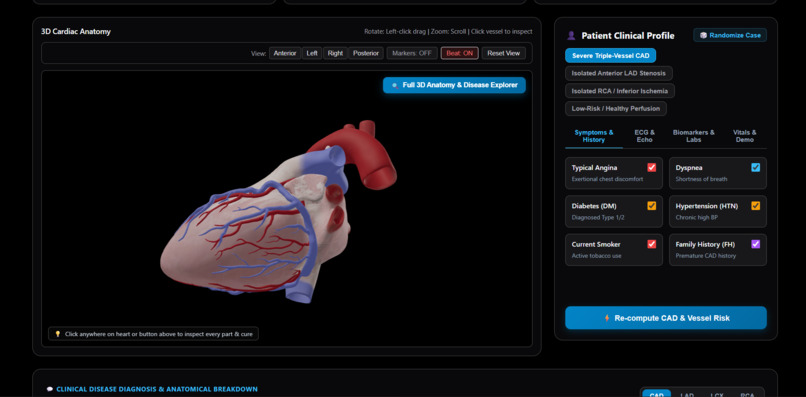
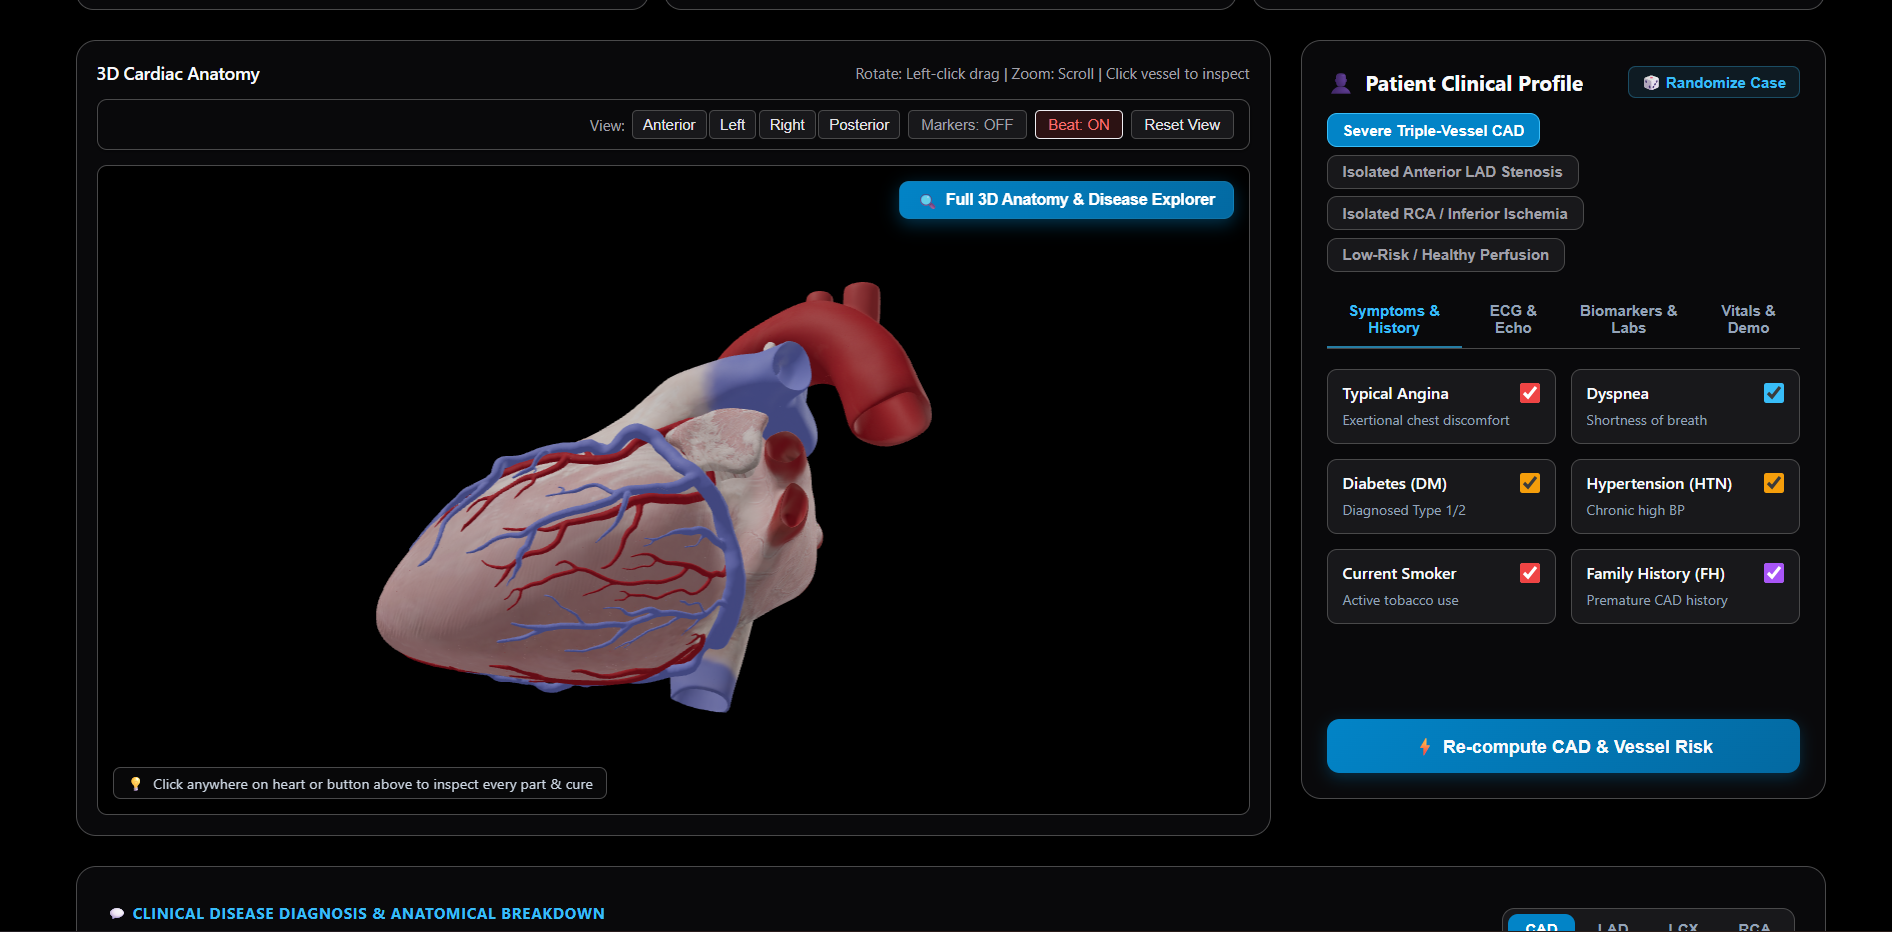
the heart model with the prediction input
-
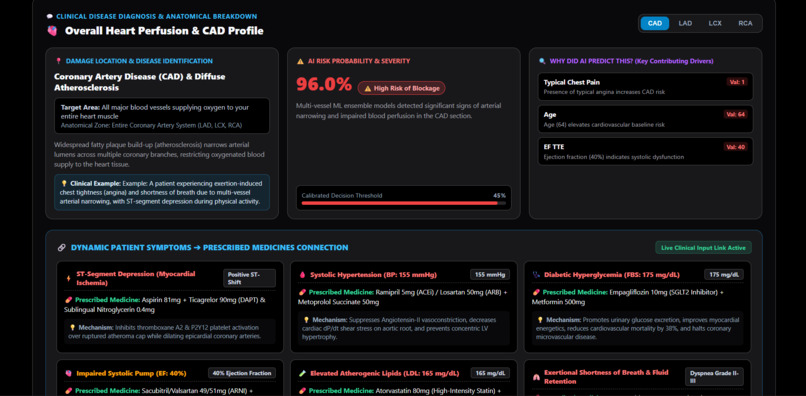
explaining the heart model
-
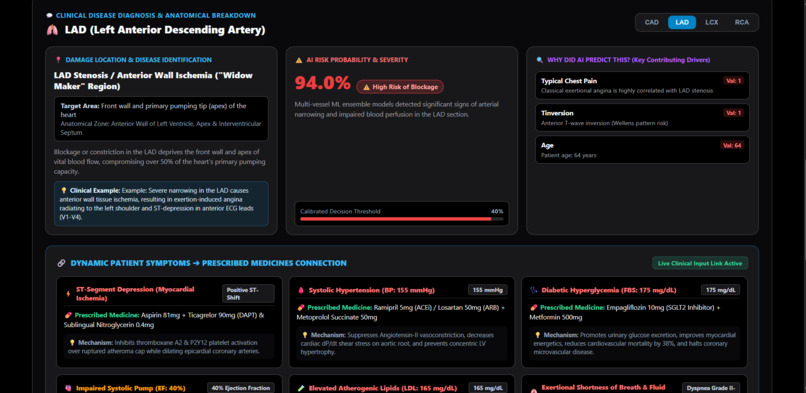
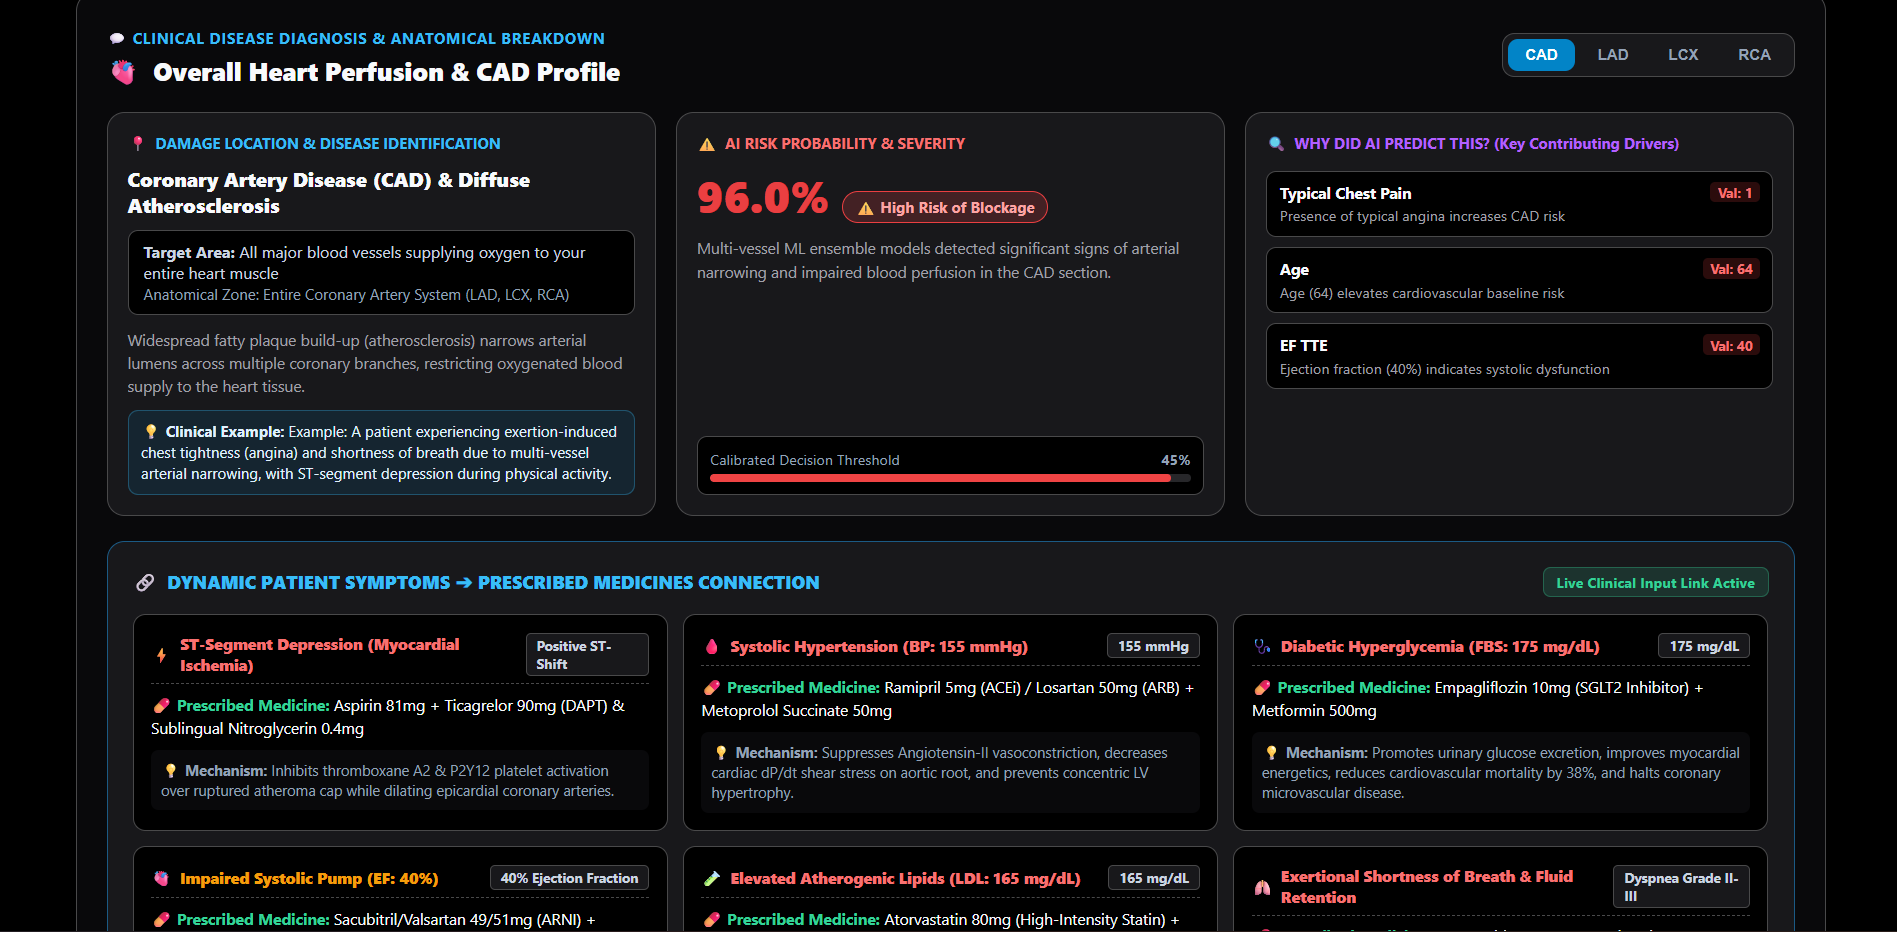
CAD profile heart
-
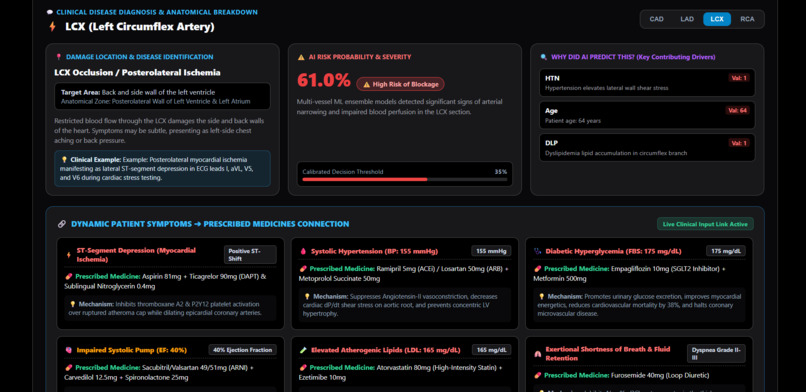
another part of the heart
-
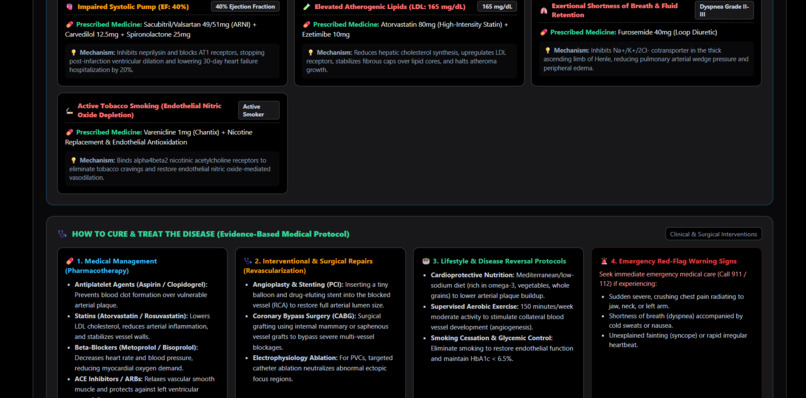
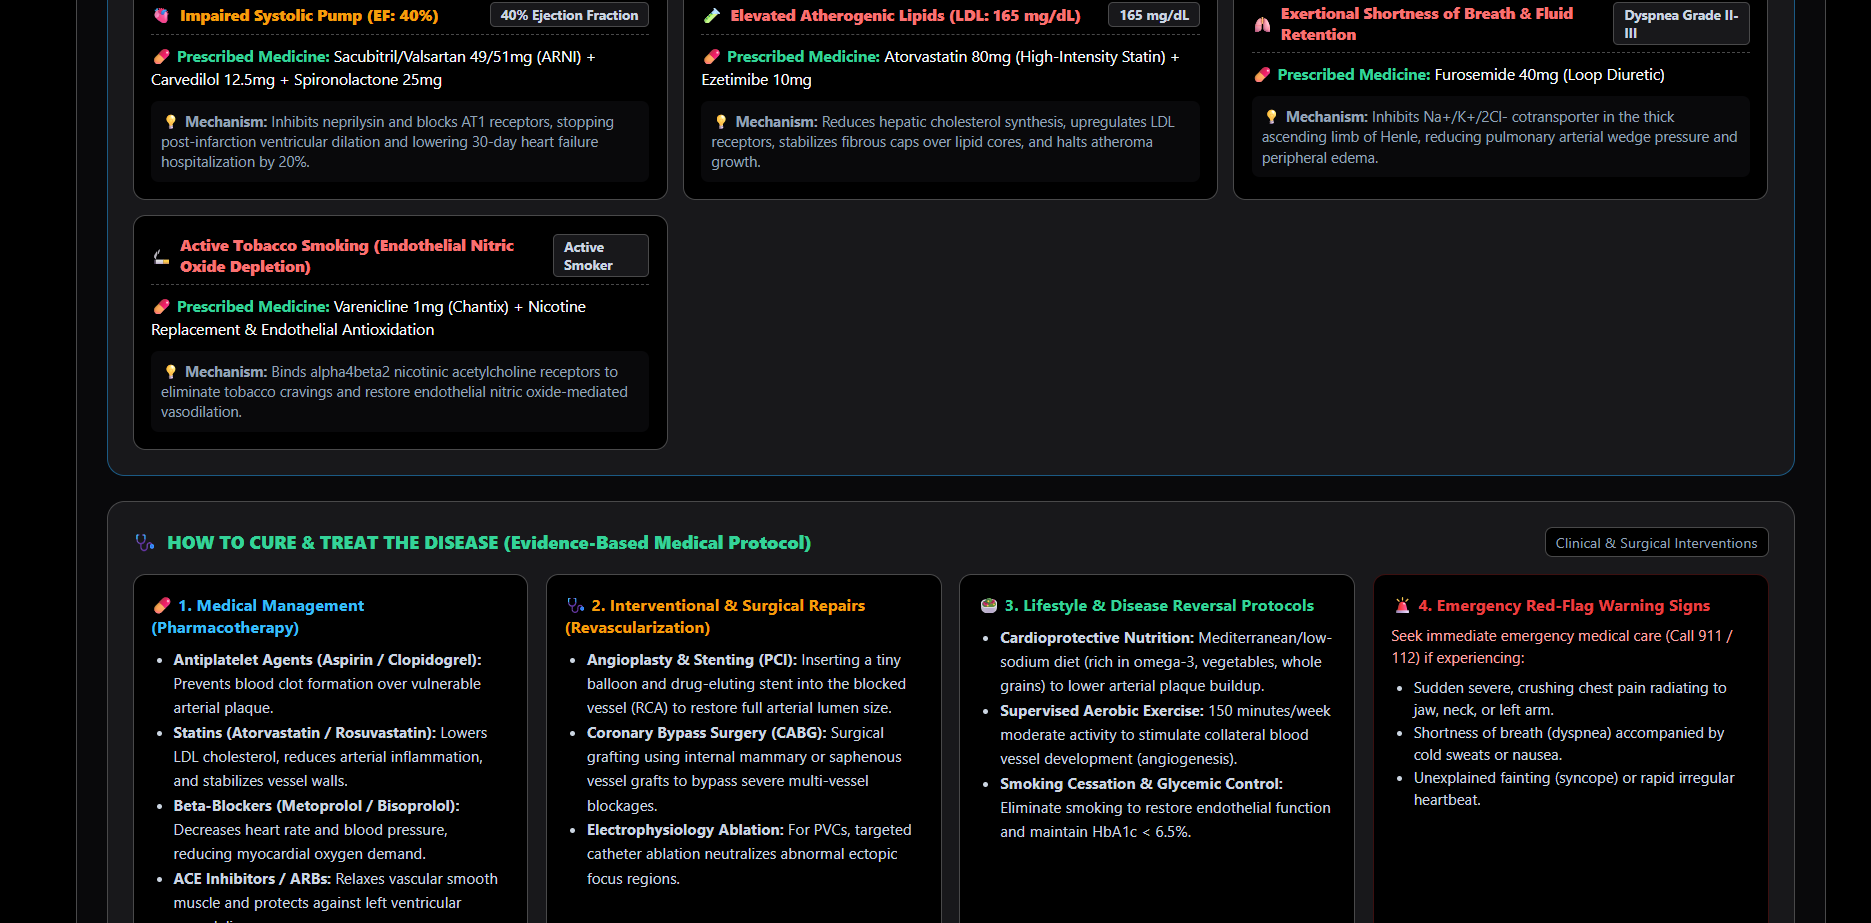
medicine and the symptoms
-
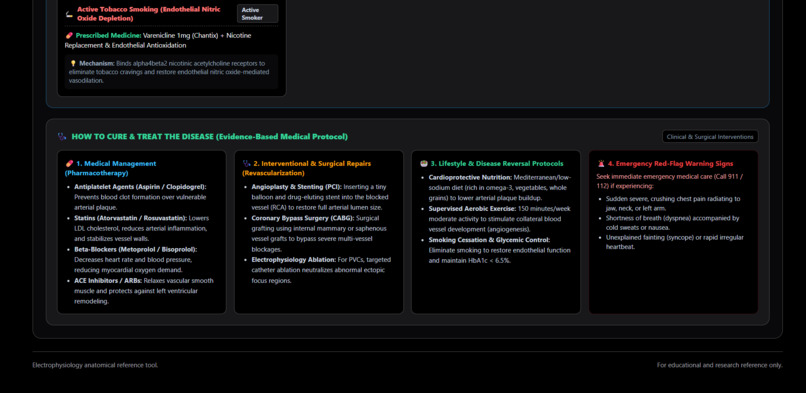
medicine
-
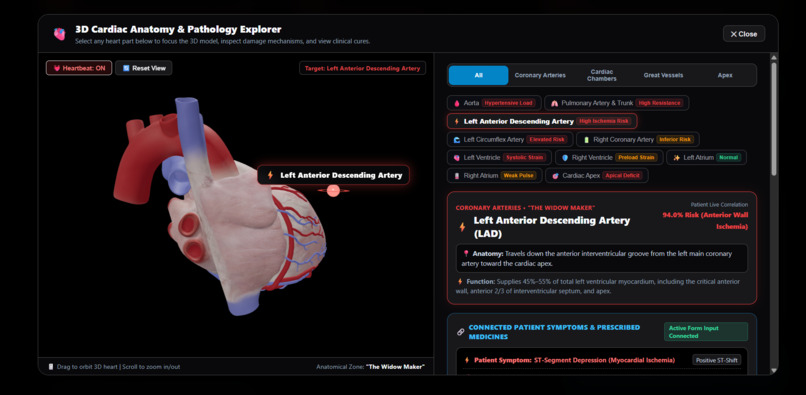
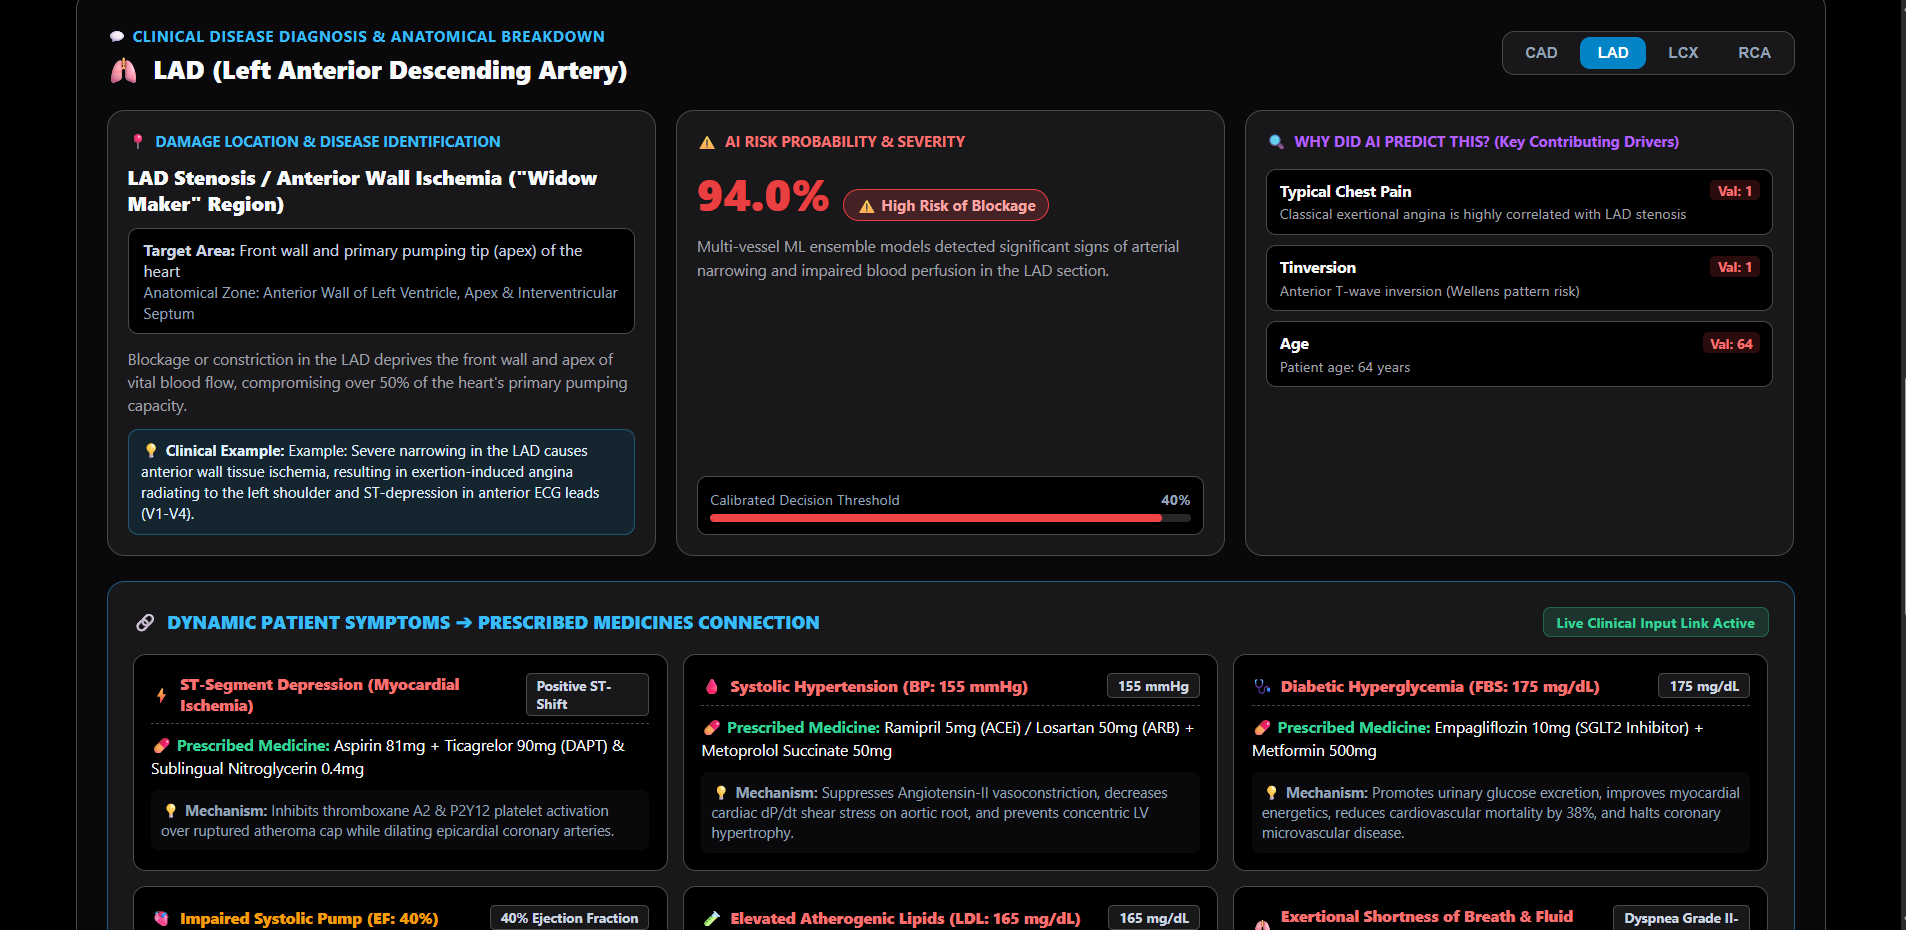
explaning the heart part
-
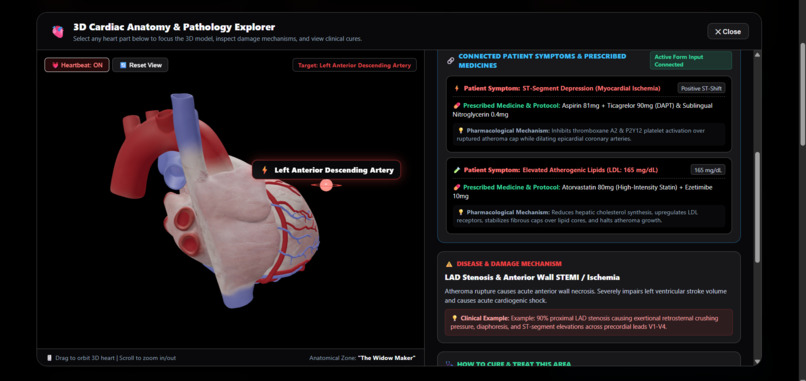
with the explaing of that particular part
-
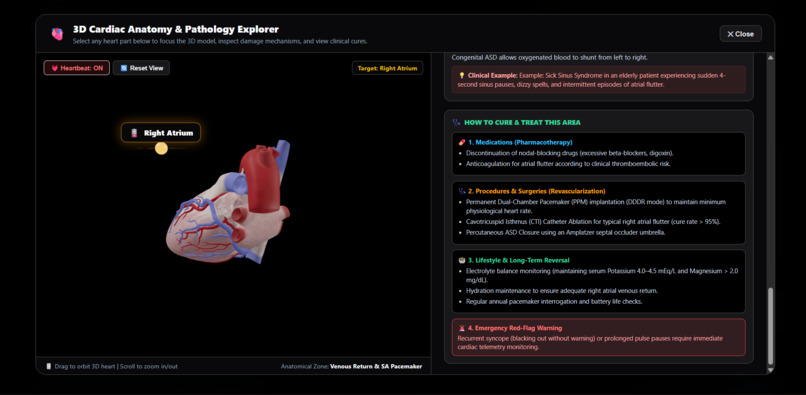
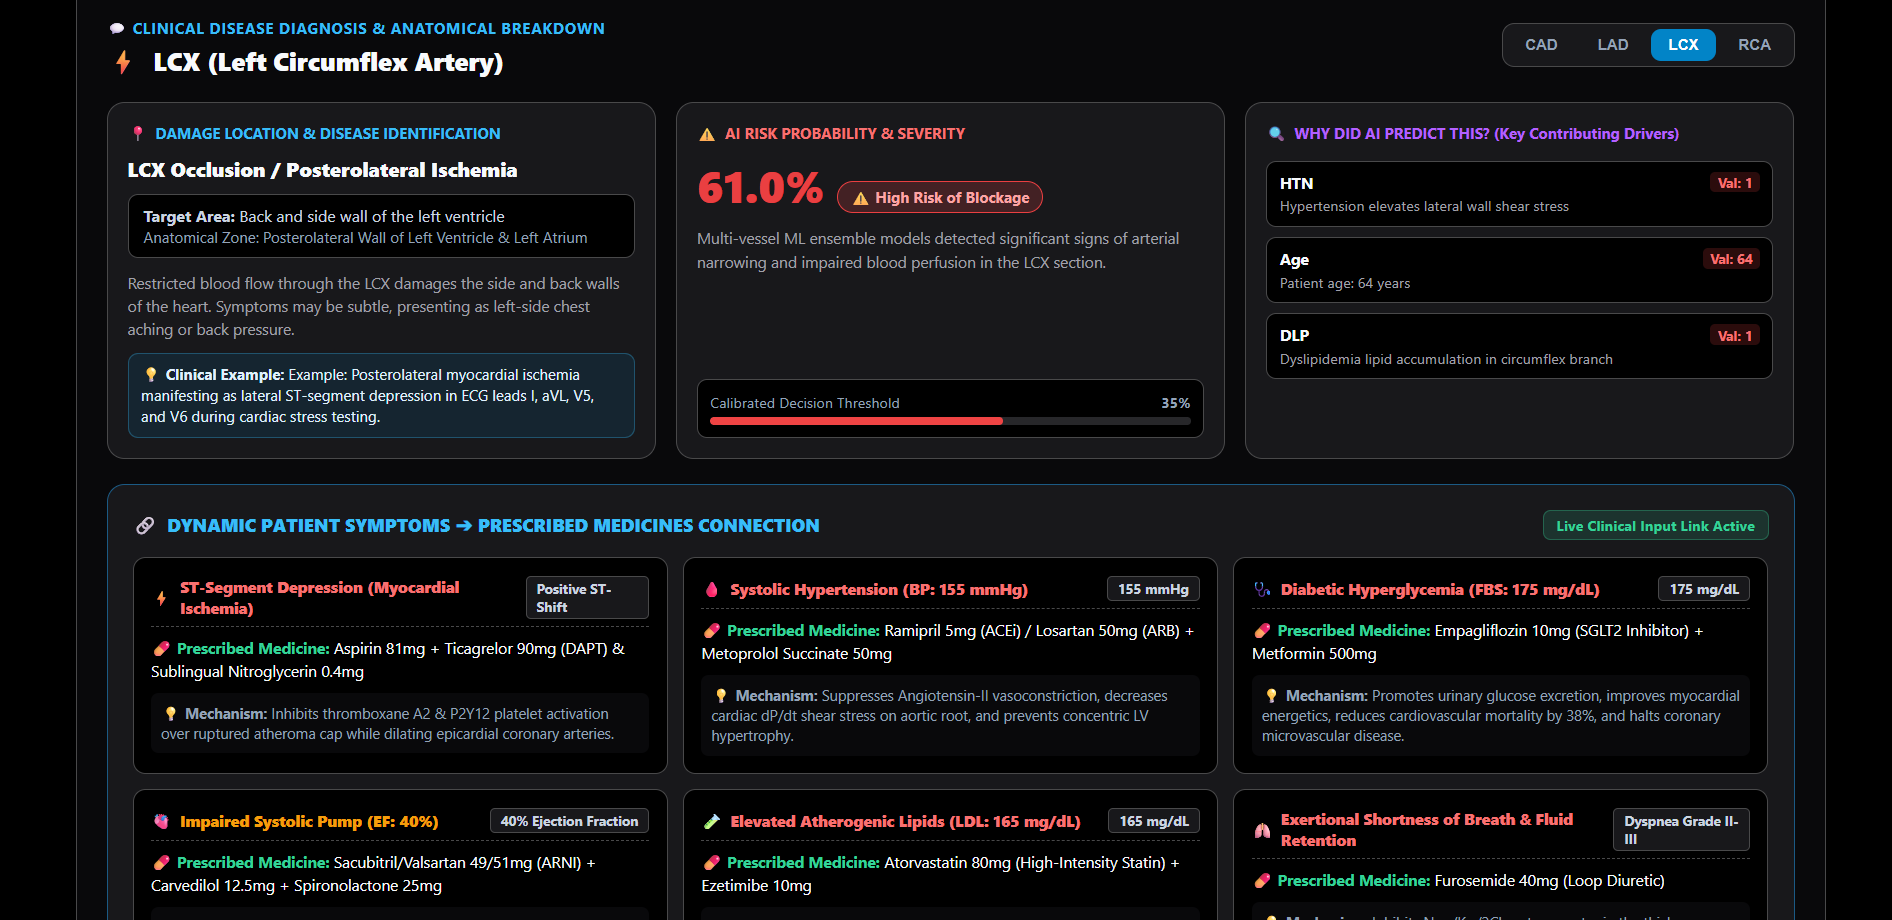
another part with some explanation
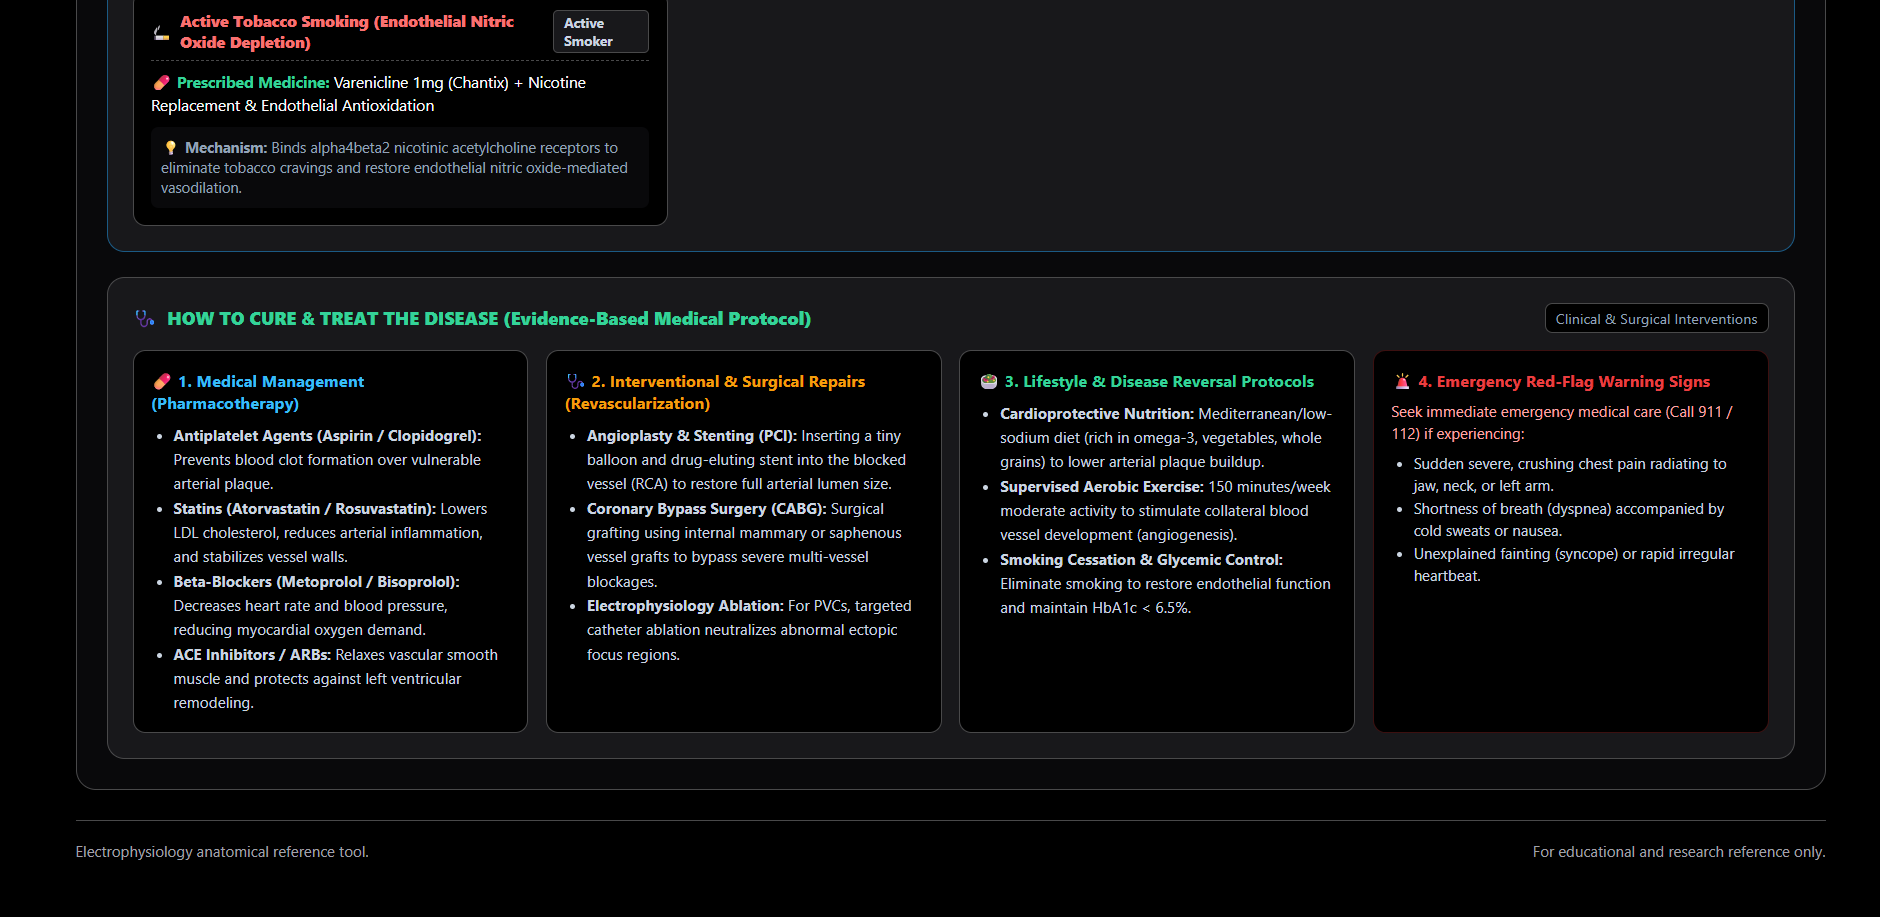
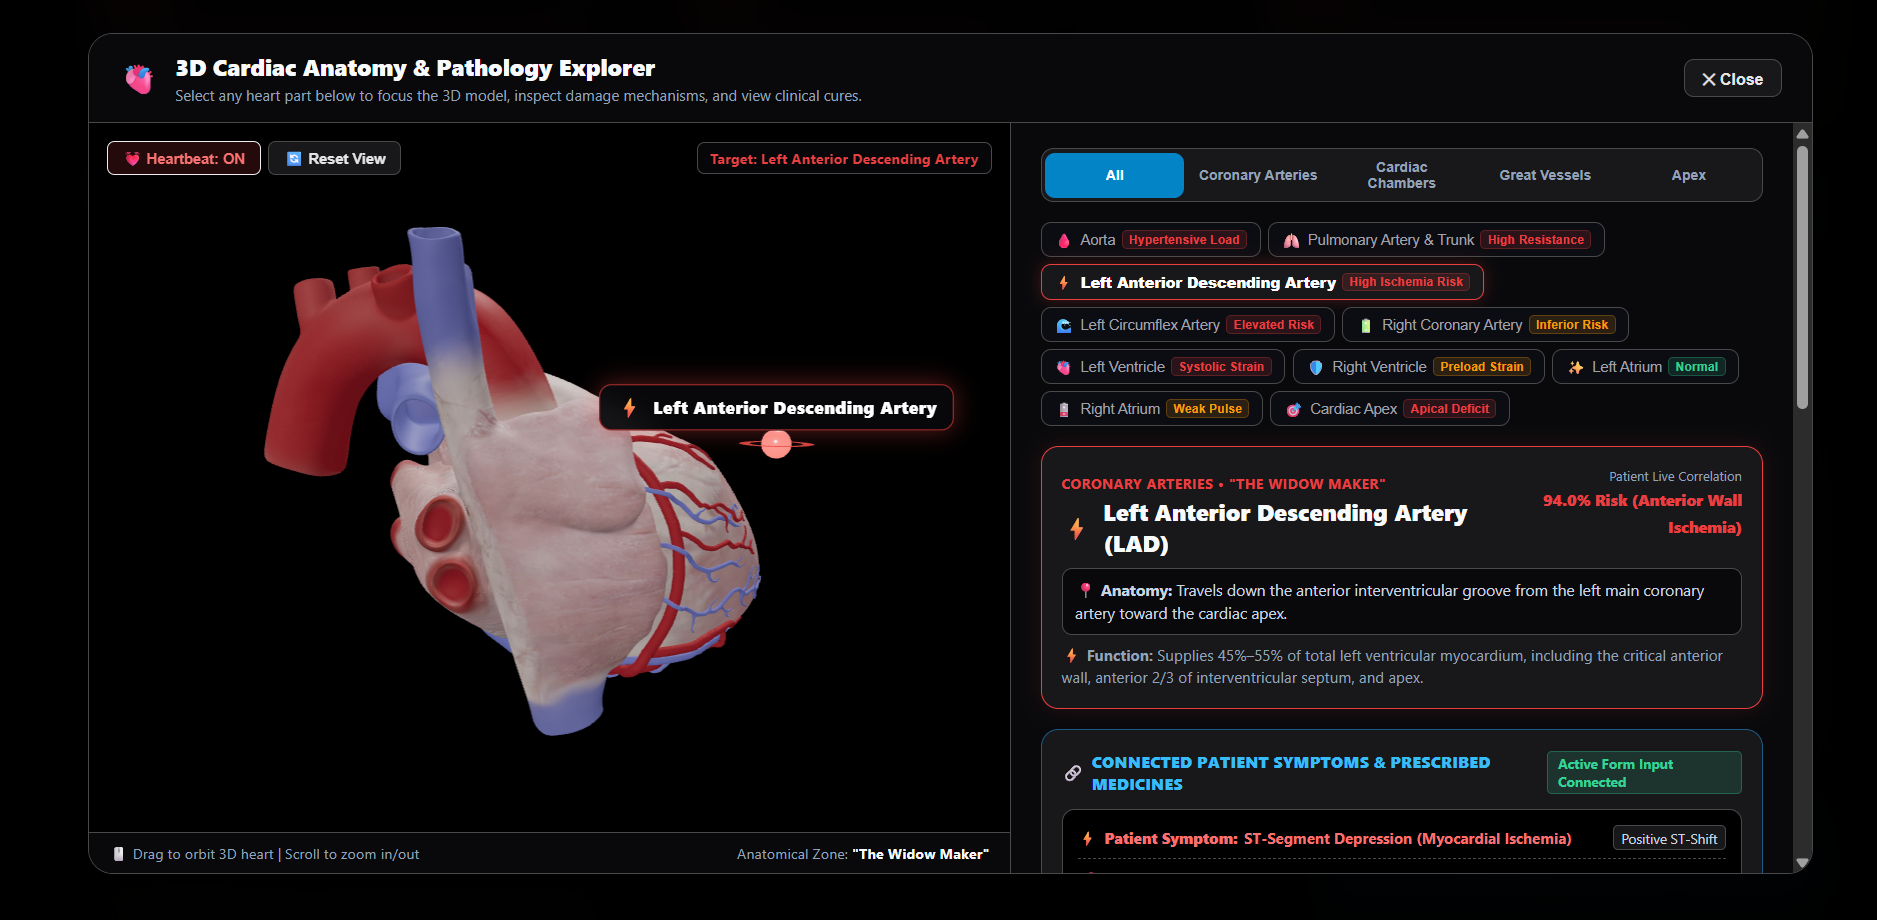
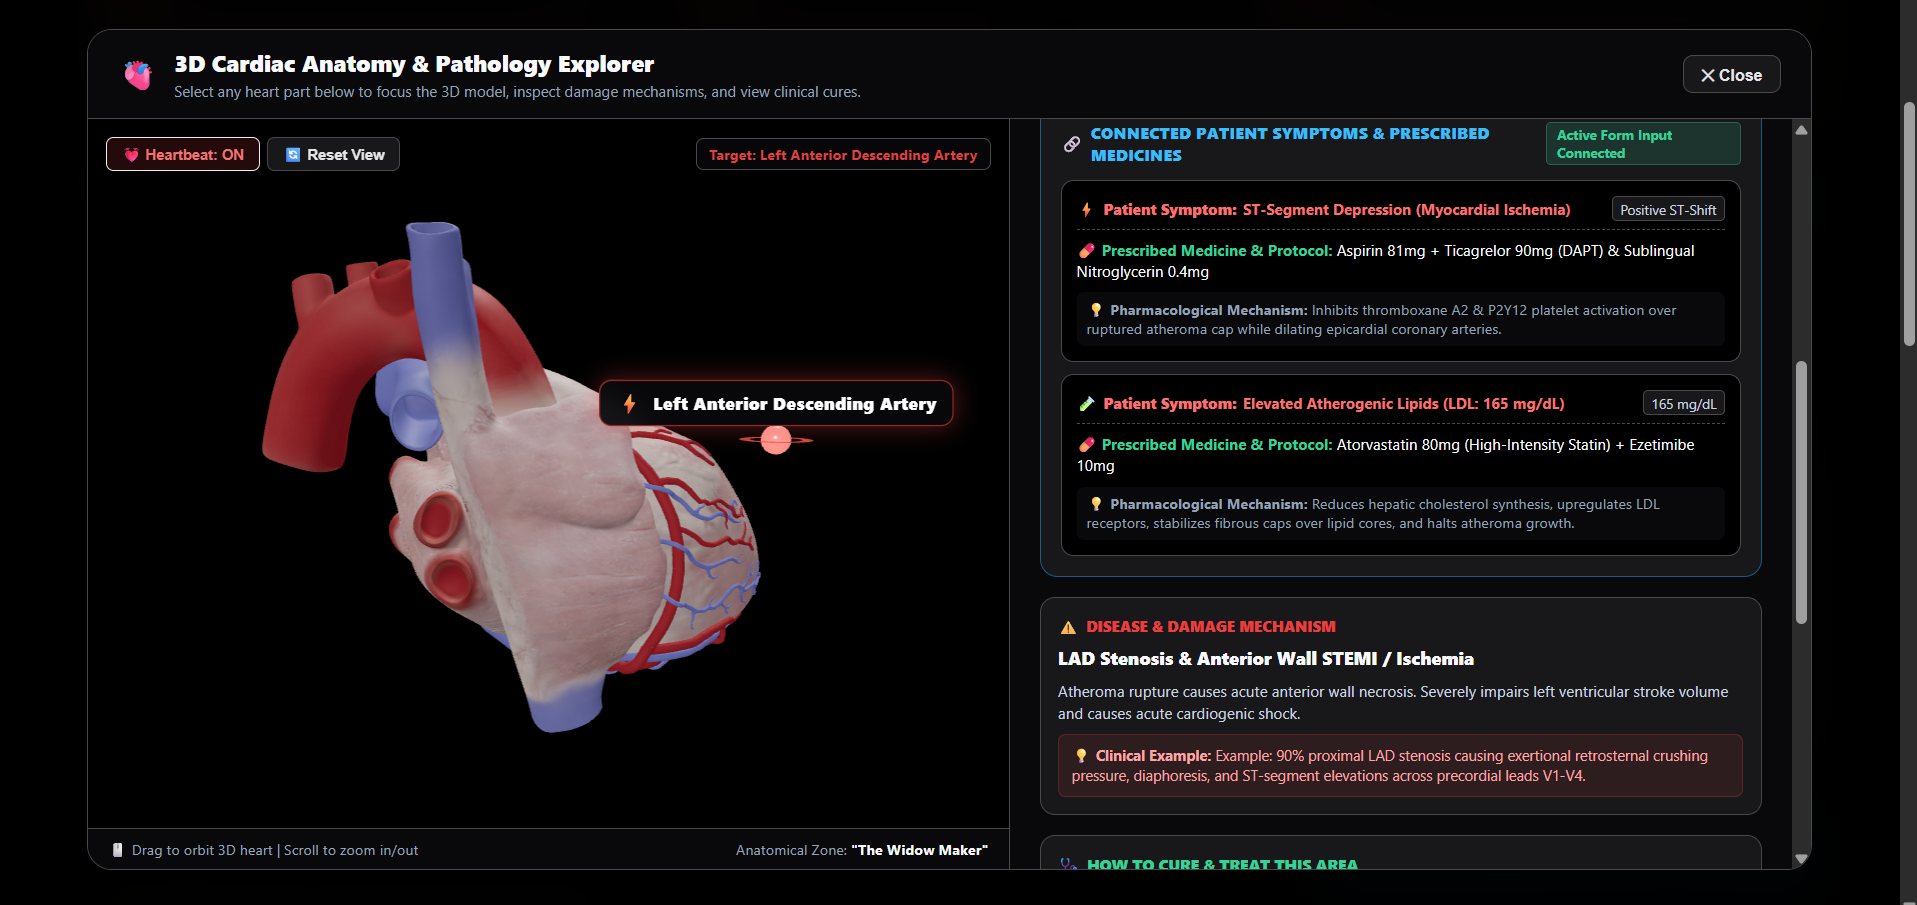
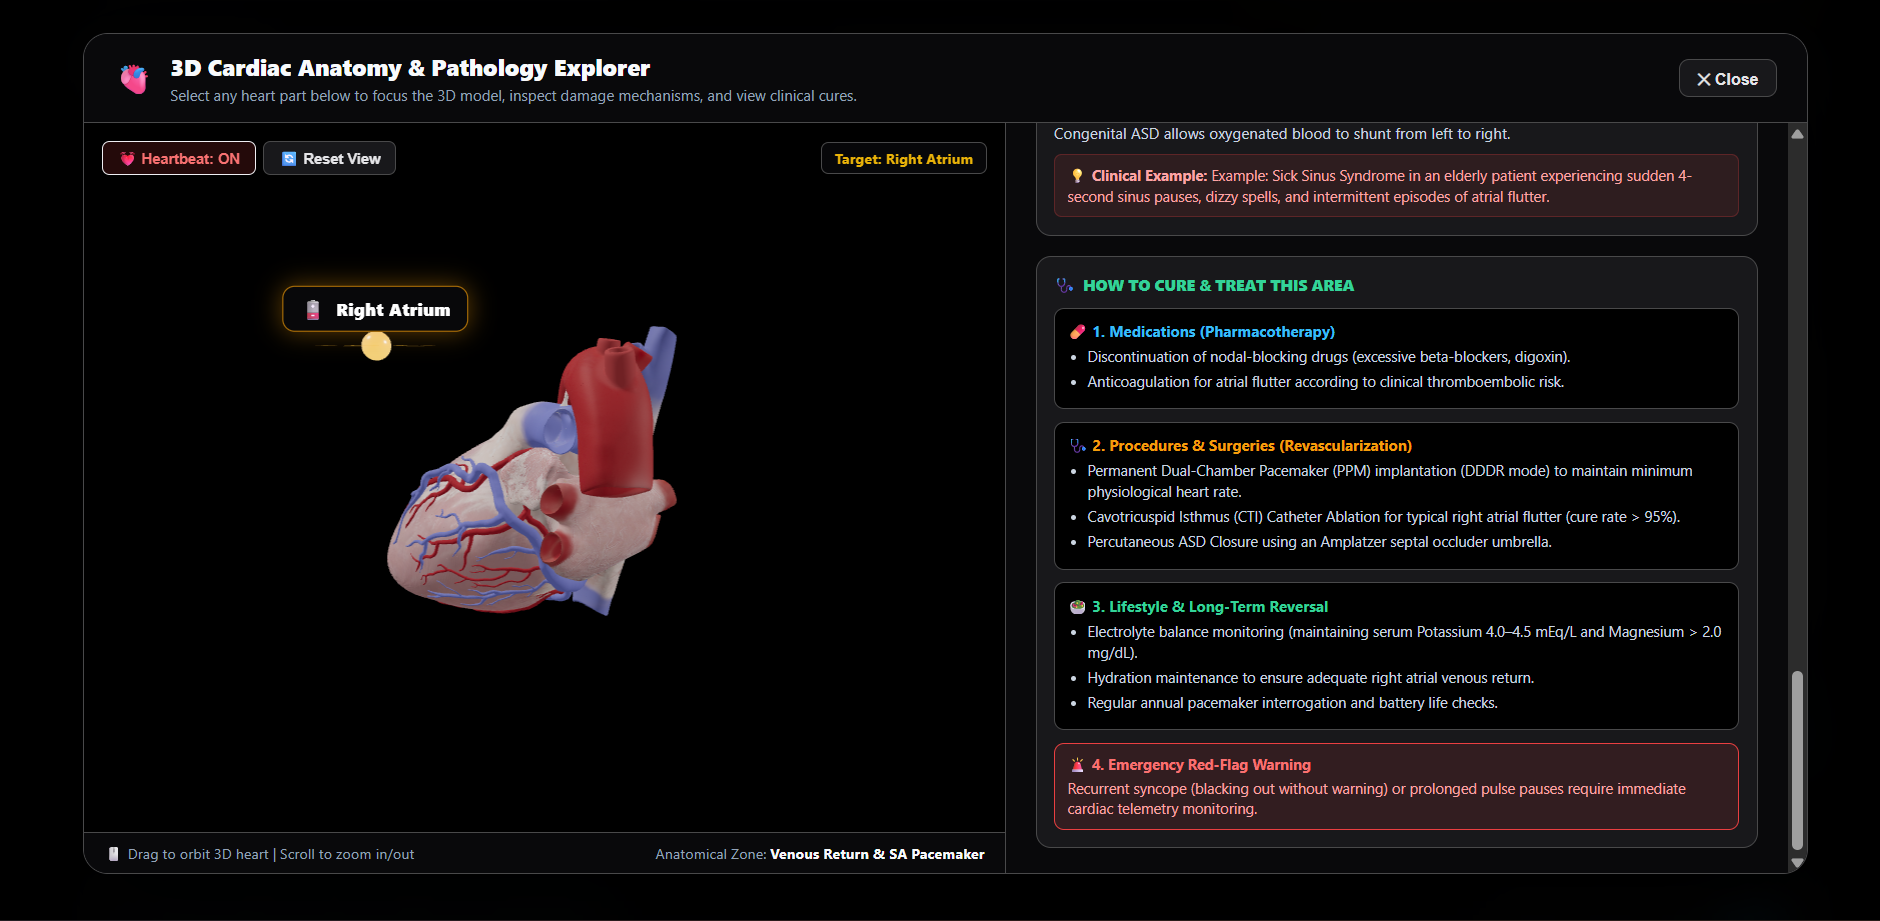
Inspiration Cardiovascular disease remains the leading cause of mortality worldwide, claiming nearly 18 million lives each year. Yet, inside clinical consult rooms, a silent crisis of communication exists:
The Abstract Risk Dilemma: Standard cardiovascular calculators (such as Framingham or ASCVD) output a single percentage (e.g., "24% 10-year risk"). This abstract number fails to inform cardiologists which specific coronary artery is vulnerable, and fails to convince patients why they must make urgent lifestyle changes. The "Black-Box" ML Problem: While modern Machine Learning models can detect Coronary Artery Disease (CAD) with high accuracy, they operate as uninterpretable black boxes. In high-stakes medicine, clinicians cannot trust a prediction they cannot explain, and patients cannot follow advice they cannot understand. We asked ourselves: What if an AI could not only predict coronary artery disease, but project that risk directly onto a real-time, interactive 3D model of the patient’s own heart, pinpoint the exact compromised vessel, and explain why in plain English?
That question inspired CardioVision 3D.
🫀 What It Does CardioVision 3D is a multi-vessel CAD risk assessment and explainability platform that unites predictive machine learning, game-engine-grade 3D graphics, and game-theoretic explainable AI (XAI).
Multi-Artery Stenosis Prediction: Instead of just predicting generic CAD, our pipeline predicts stenosis risk individually for each major coronary artery: LAD (Left Anterior Descending): The critical "Widow Maker" artery supplying the anterior wall and apex. LCX (Left Circumflex Artery): Supplying the posterolateral left ventricle. RCA (Right Coronary Artery): Supplying the inferior myocardium and conduction nodes. Interactive 3D Heart Perfusion Mapping: Built with React Three Fiber, the 3D heart dynamically colors each coronary vessel and corresponding myocardial territory based on predicted risk level (Green = Low, Amber = Moderate, Crimson = High). Premature Ventricular Contraction (PVC) Origin Localization: Interactive 3D hotspots allow clinicians to pinpoint ectopic arrhythmia foci across regions like the RVOT (Right Ventricular Outflow Tract) and LVOT. Plain-English Clinical Breakdown: Every prediction is decoded into three fundamental questions: 📍 Where is the problem? (Precise anatomical region & affected artery) ⚠️ What is the problem? (Calibrated probability & physiological hazard) 🔍 Why is this happening? (Top patient-specific clinical drivers)
Built With
- 3d-visualization
- cardiology
- catboost
- data-science
- explainable-ai
- fastapi
- gltf
- healthtech
- machine-learning
- next.js
- numpy
- pandas
- pydantic
- python
- react
- react-three-fiber
- scikit-learn
- shap
- tailwindcss
- three.js
- typescript
- uvicorn
- webgl
- xgboost


Log in or sign up for Devpost to join the conversation.