Devpost submission text: CardioVision
Paste each section into the matching Devpost field. Links to add: GitHub repository, YouTube demo
(unlisted), and the PDF docs/CardioVision-Technical-Documentation.pdf.
Tagline (≤ 200 characters): Predicts coronary artery disease and LAD/LCX/RCA stenosis from routine clinical data, maps each risk onto its artery on a 3D heart that beats like the patient's, and explains every estimate.
Inspiration
A risk score of "72%" does not tell a clinician where coronary disease is likely, or why the model thinks so. Track A asked for predictions that become spatial and inspectable. We also wanted the numbers to be trustworthy: this dataset has only 303 patients, and many published results on it are inflated by evaluation leakage. So we set ourselves two goals: make the risk visible on the anatomy, and make every number honest.
What it does
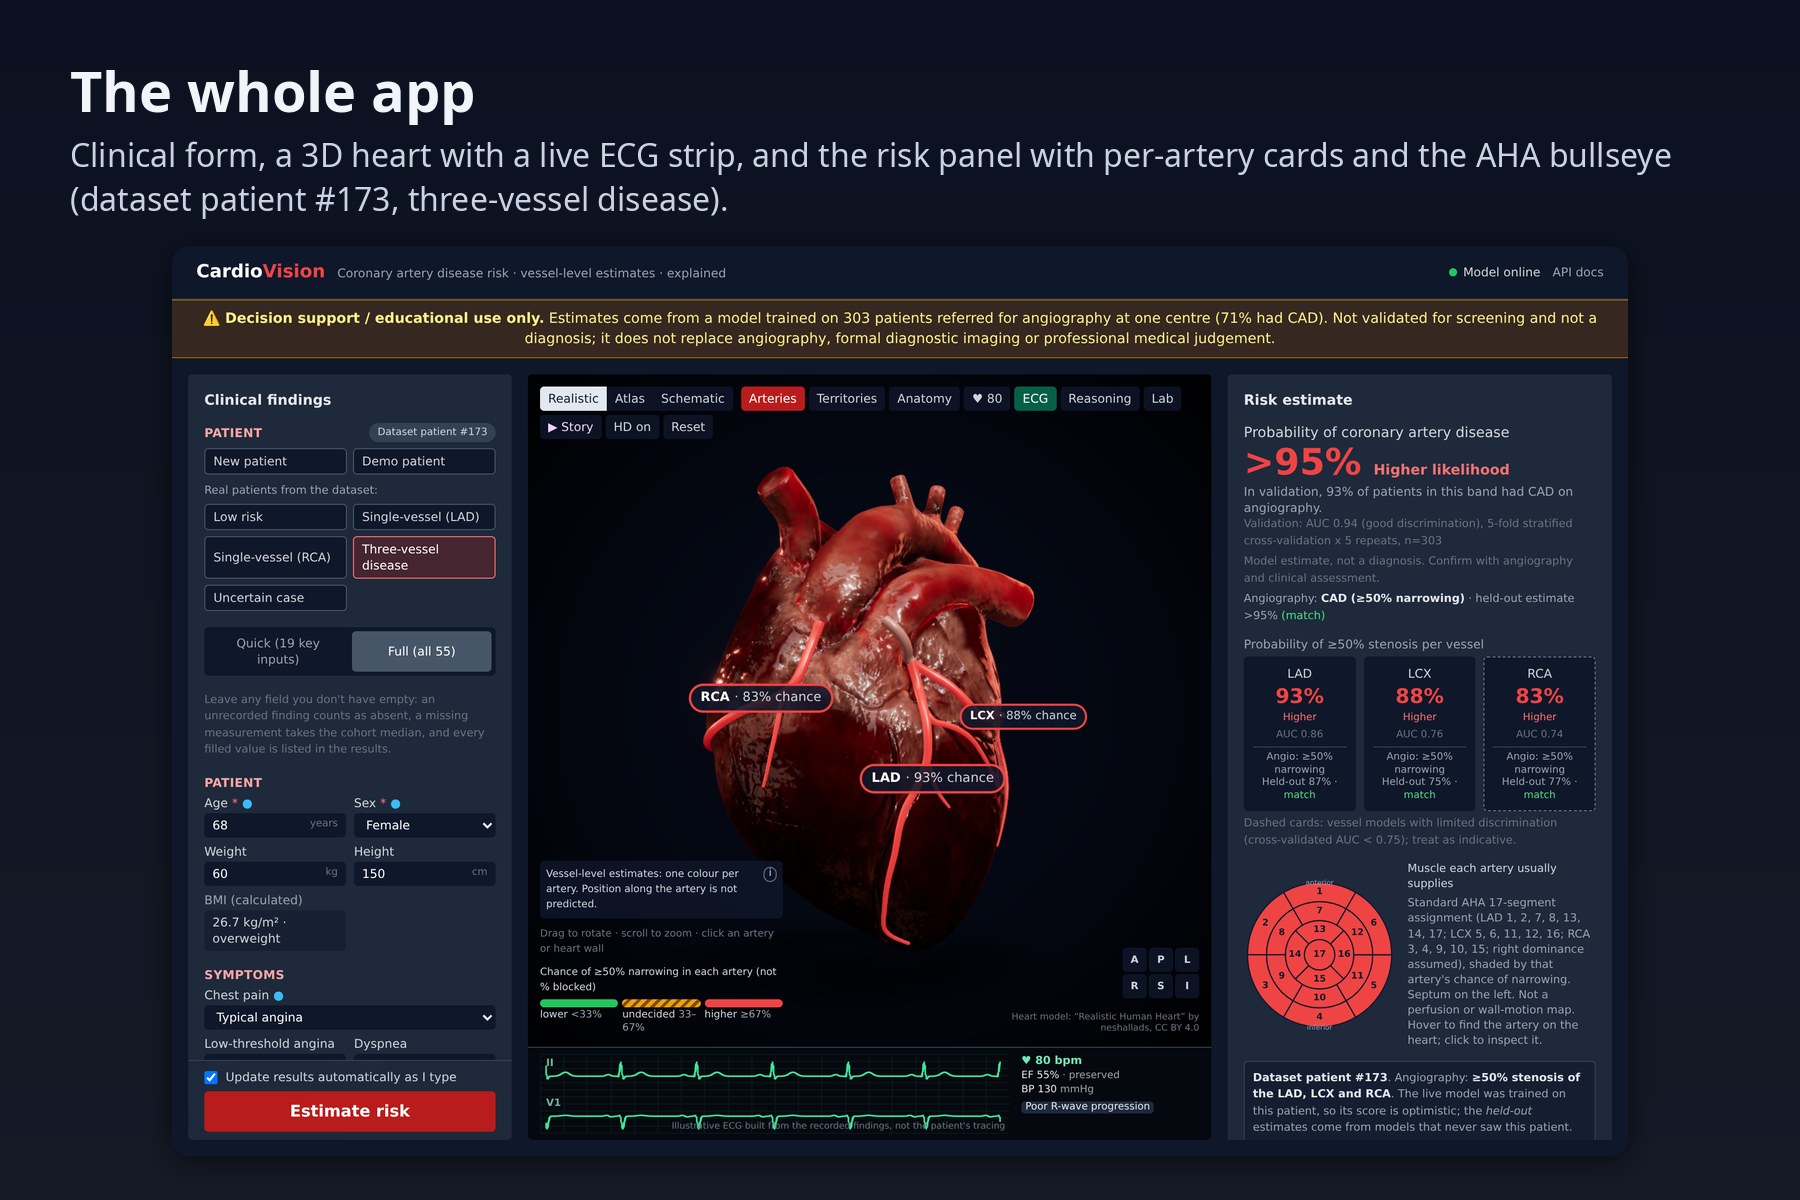
- Predicts four things from 55 clinical inputs (demographics, history, symptoms, examination, ECG, labs, echo): overall CAD, and ≥50% stenosis of the LAD, LCX and RCA.
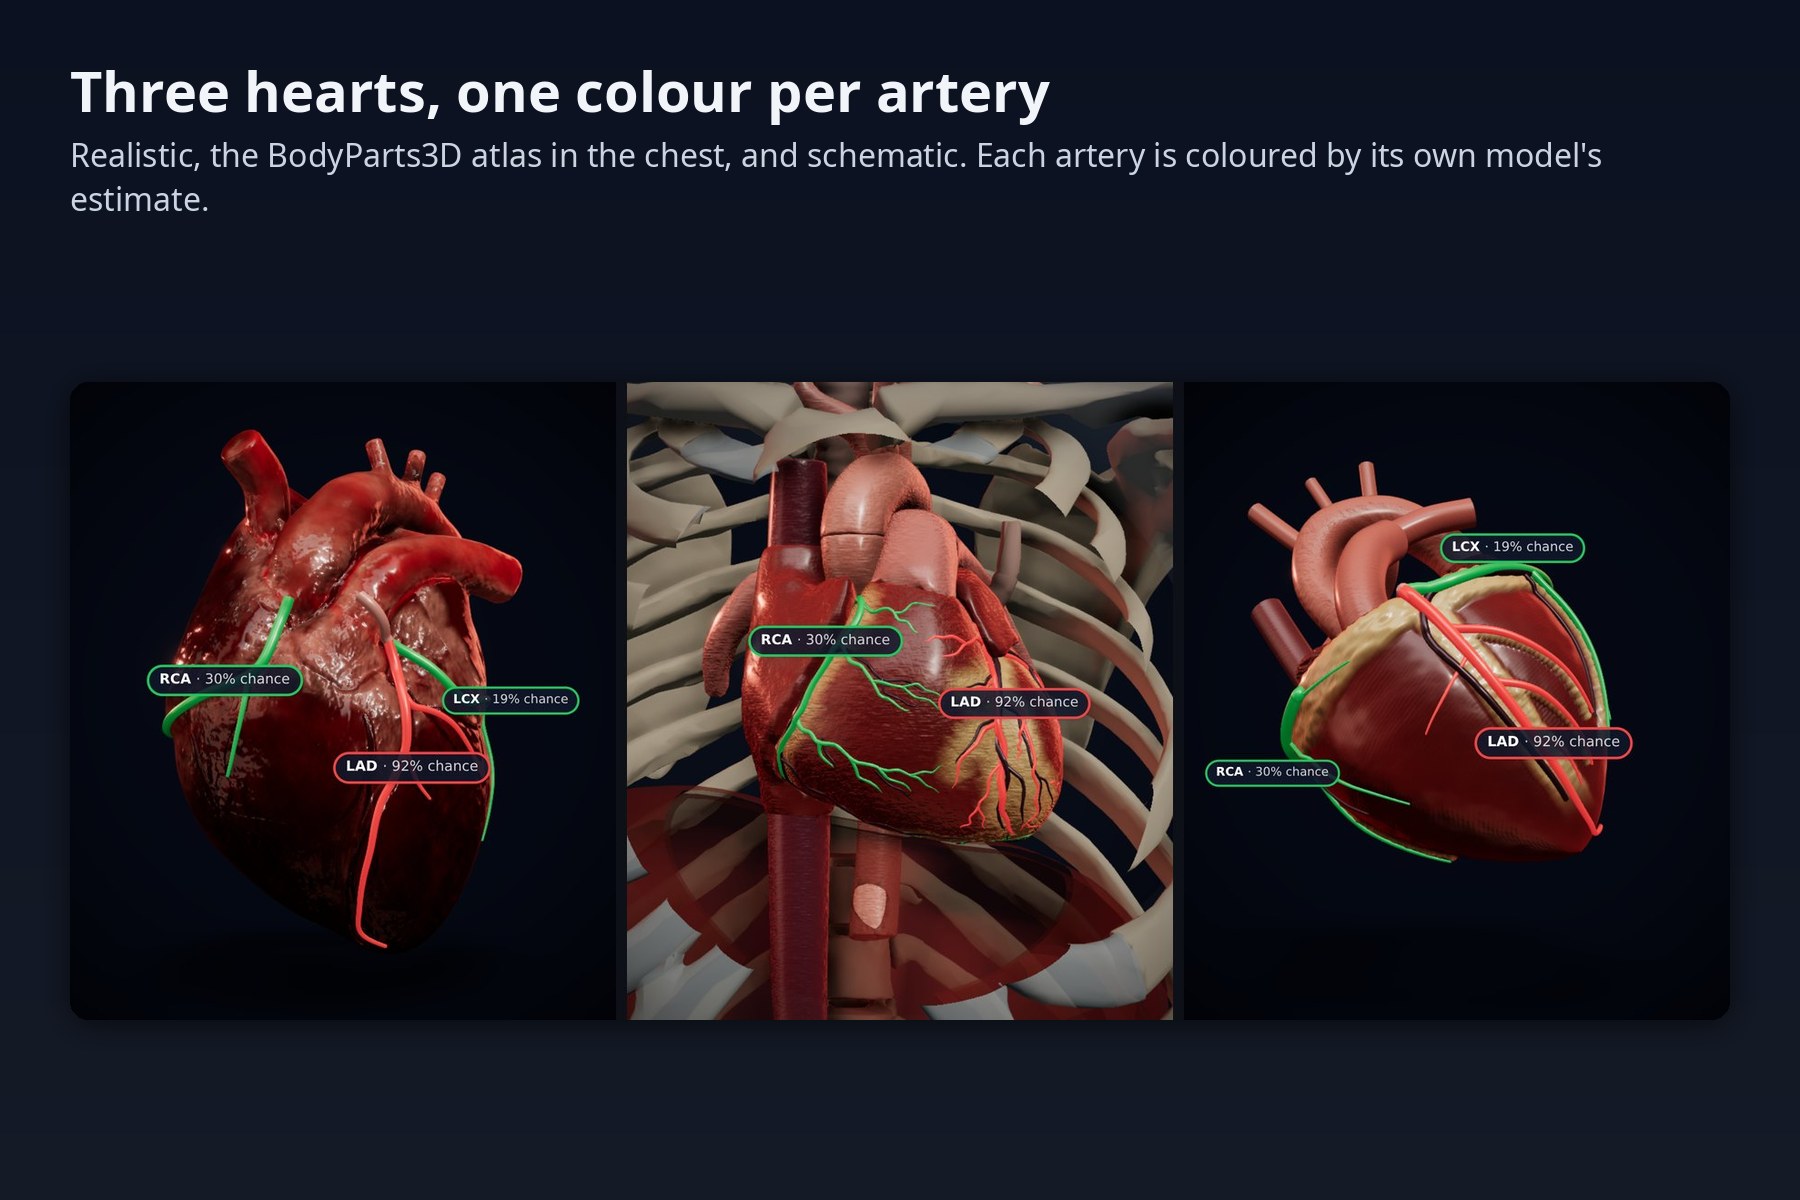
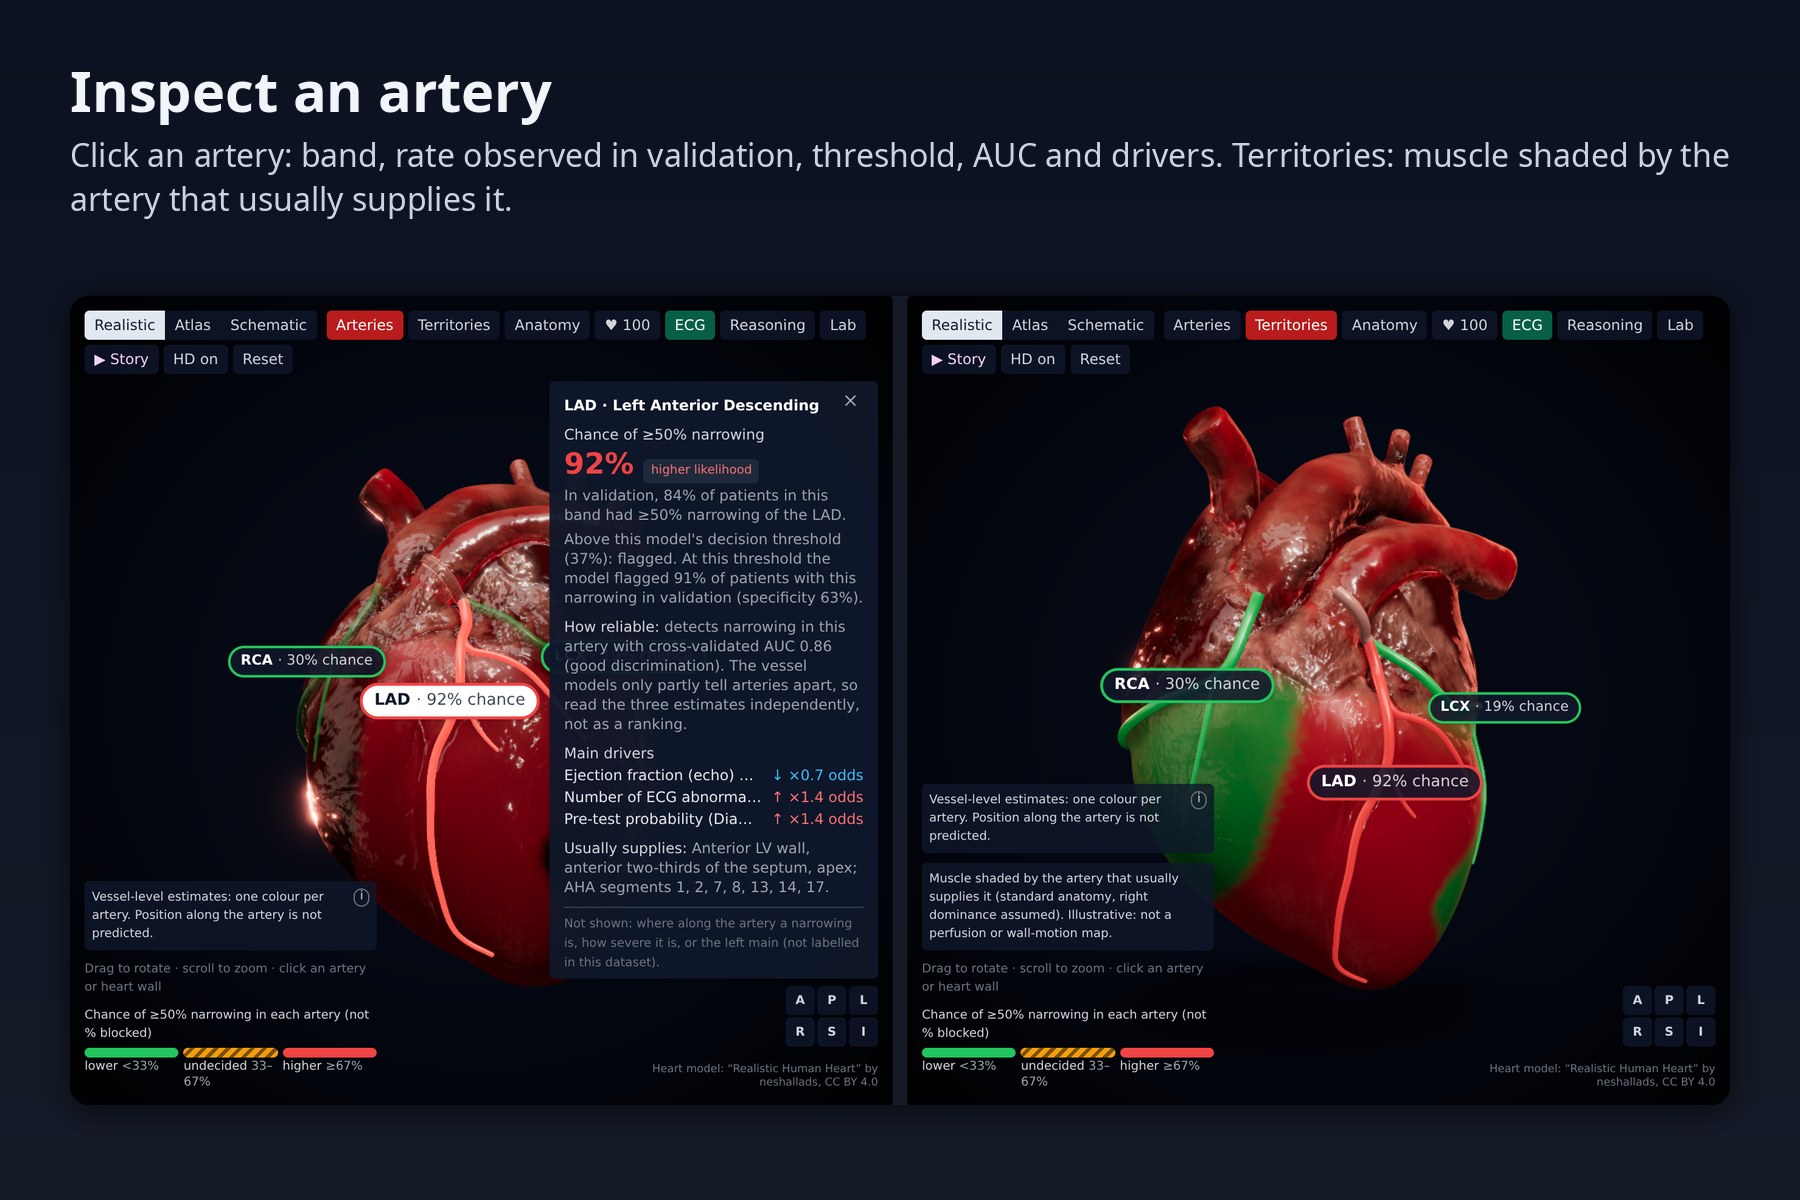
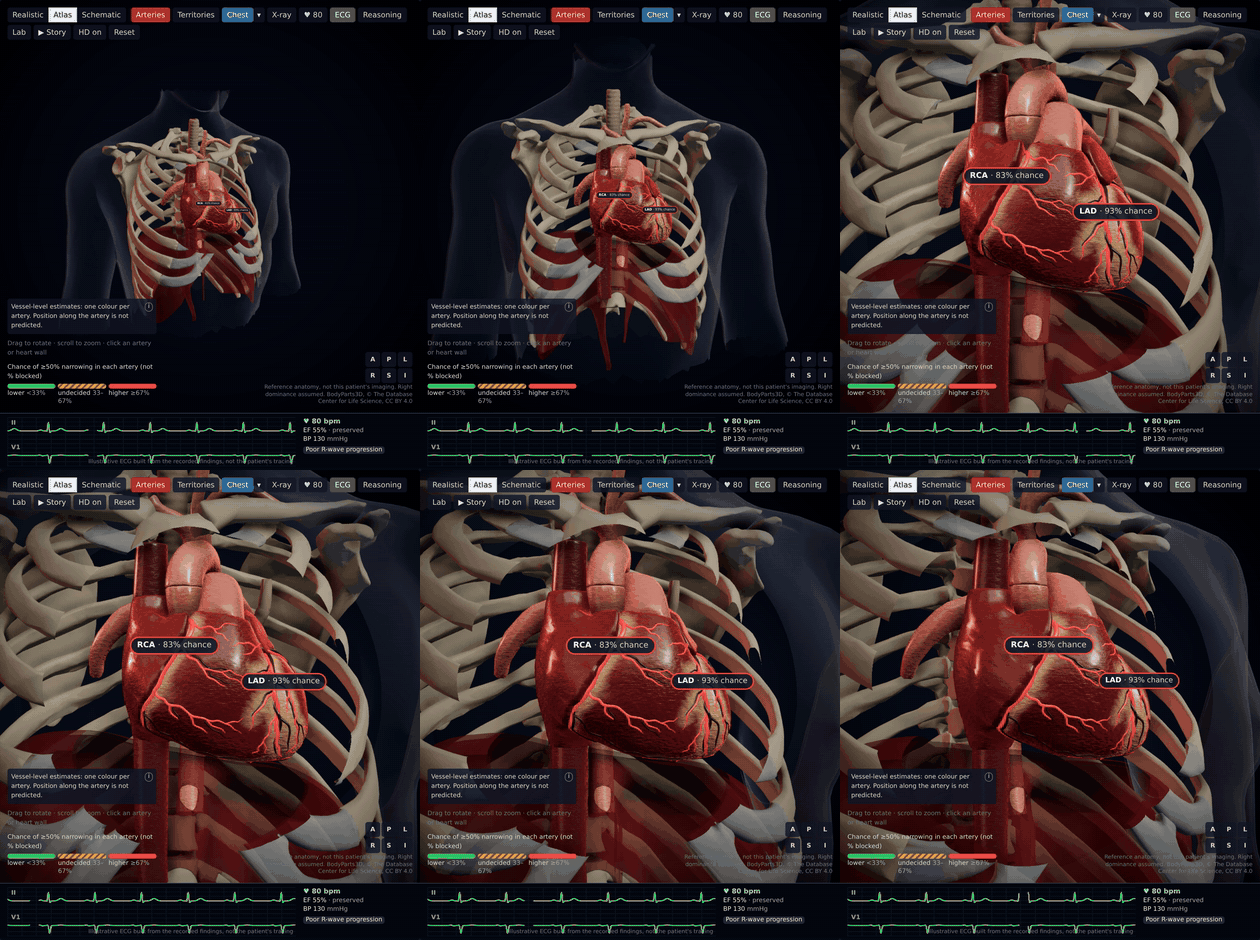
- Maps each prediction onto its own artery on three interactive 3D hearts: a sculpted open-licence heart with our coronary tree fitted into its grooves, a BodyParts3D atlas heart inside a ghosted chest (59 named coronary branches, each coloured by exactly one model) and a schematic heart. Territories, a vessel inspector and an AHA 17-segment bullseye linked to the 3D view.
- A heart that behaves like the patient's: their recorded pulse, ejection fraction, blood pressure and ECG findings drive the beat and a live, illustrative two-lead ECG (left bundle branch block even makes the lateral wall contract late).
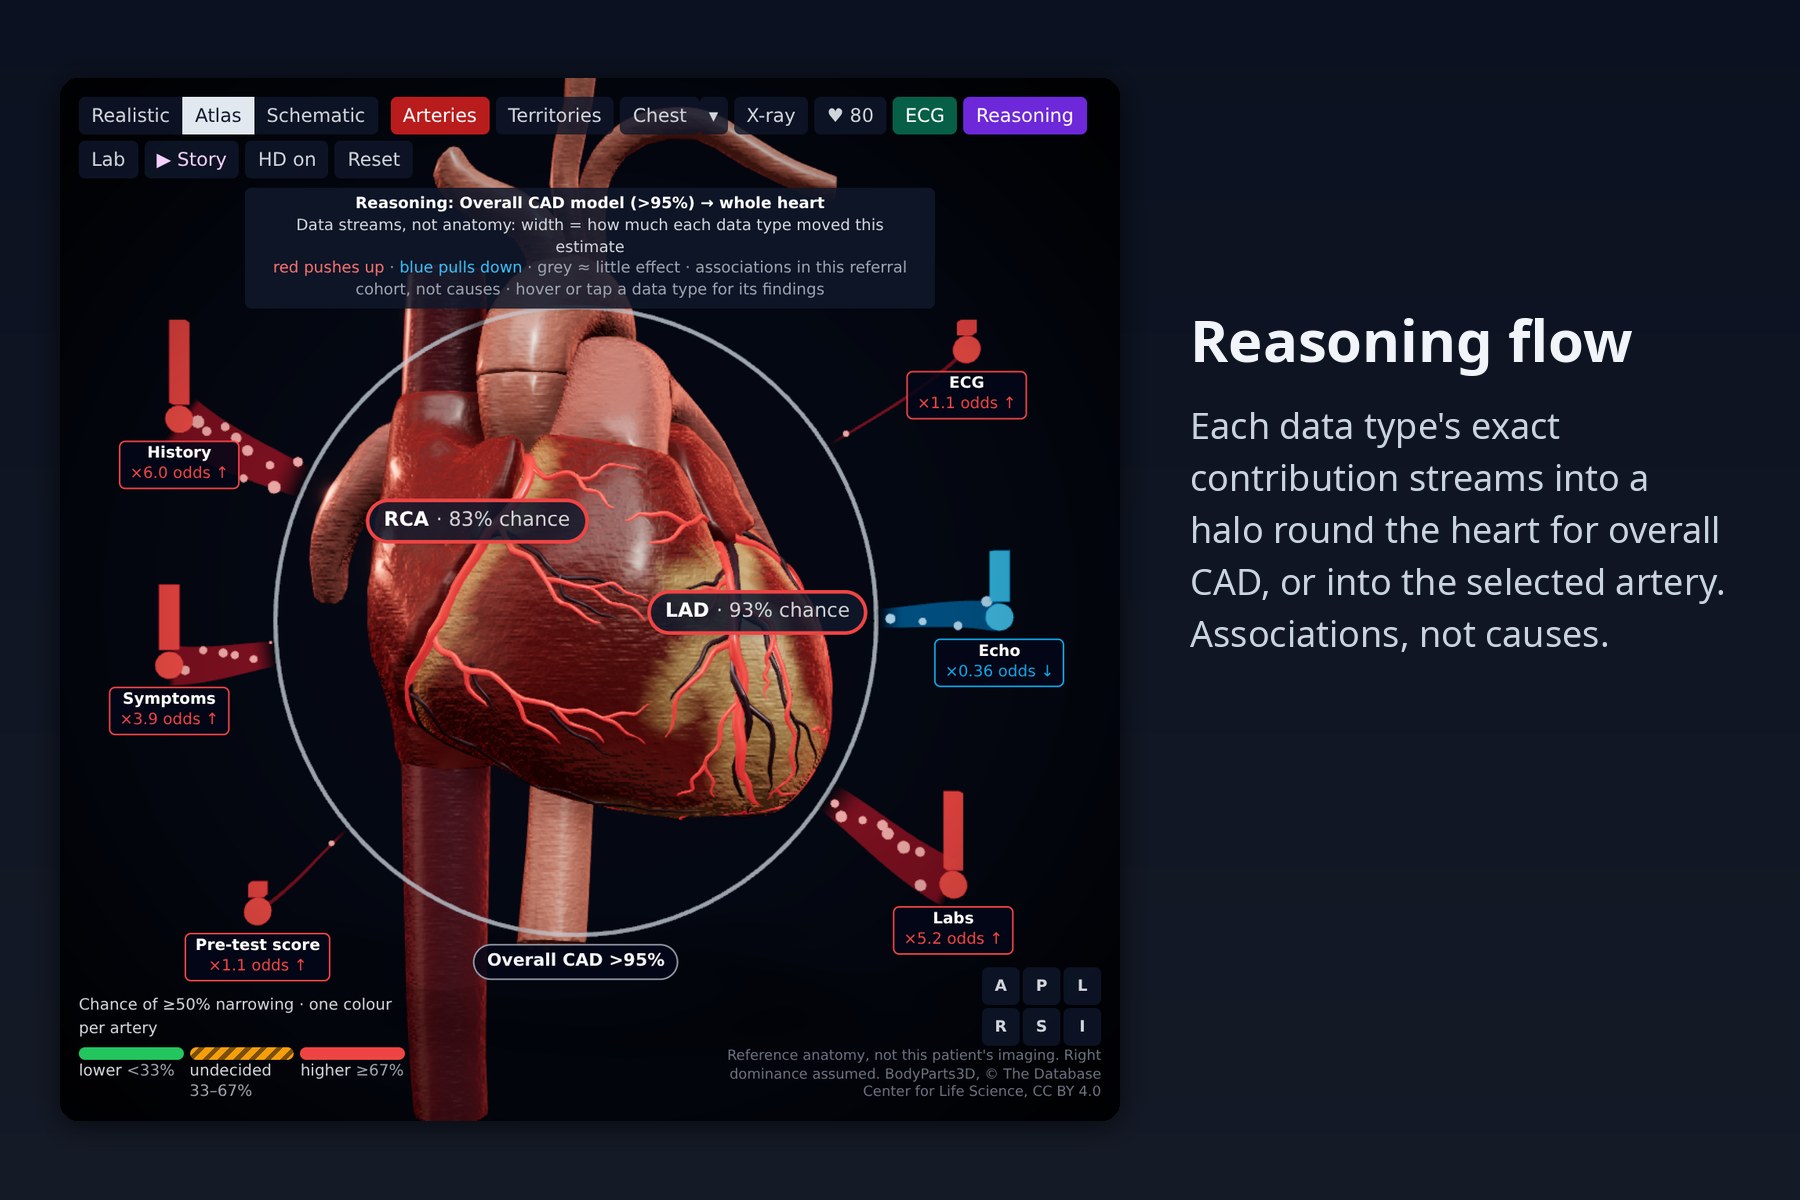
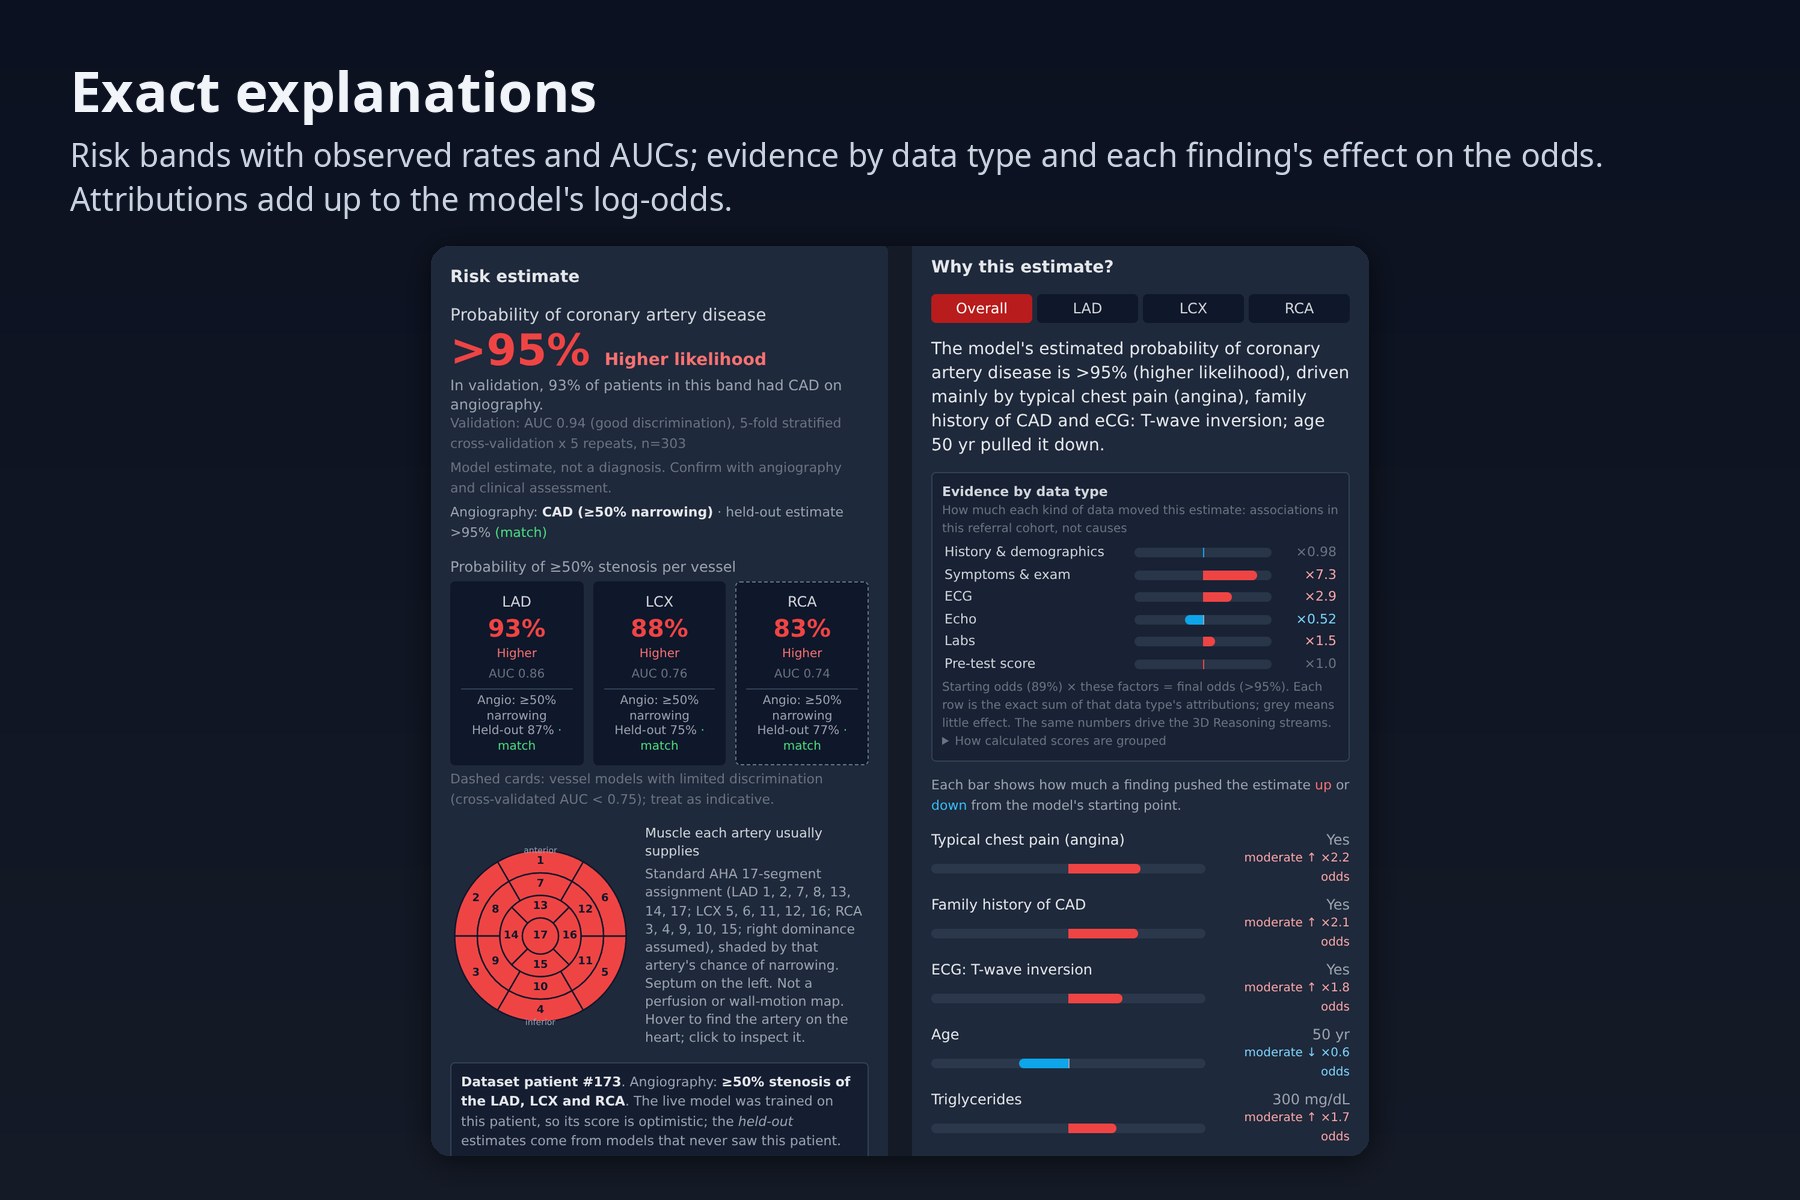
- Shows how the AI combined the data: each model's exact attributions, summed by data type (history, symptoms, ECG, echo, labs, pre-test score), flow as particle streams from towers around the heart into the artery, or into the whole heart for overall CAD.
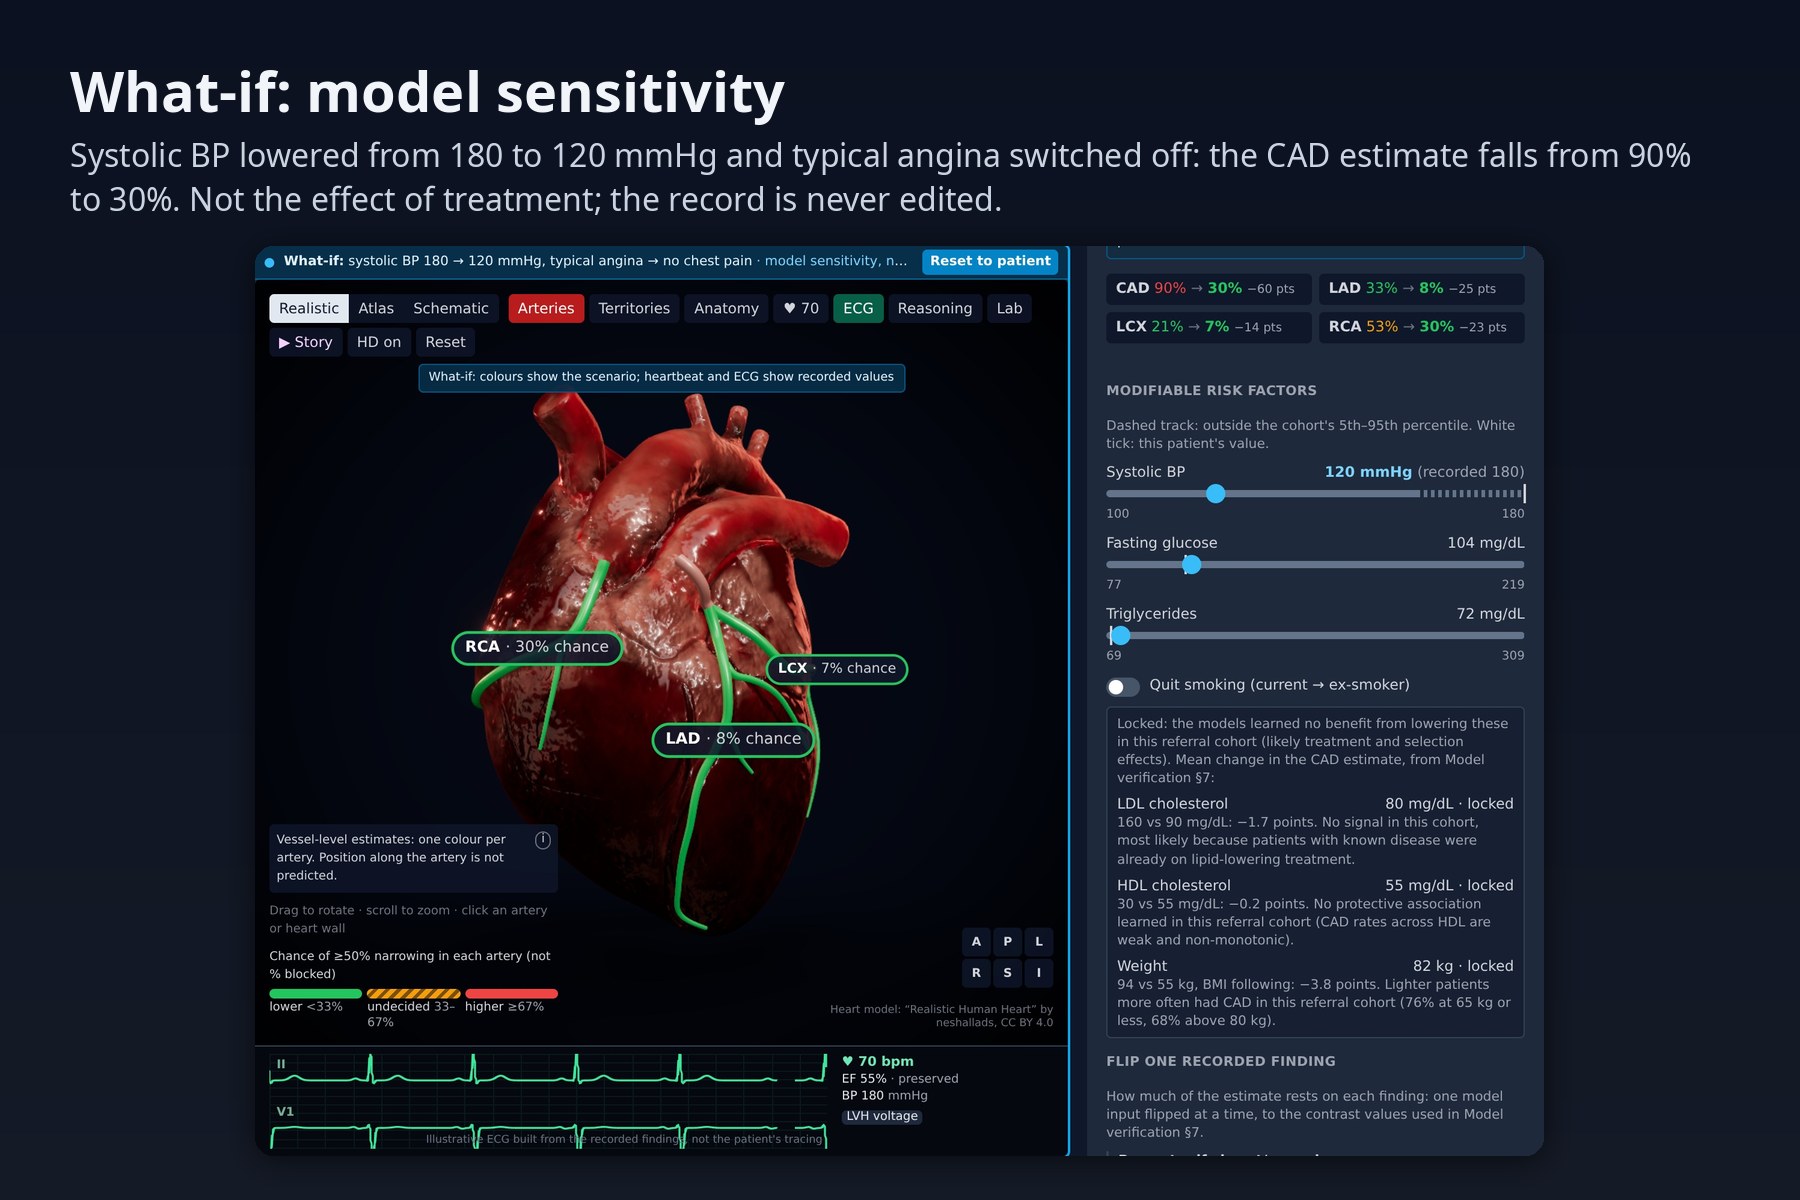
- What-if: sliders and "flip one recorded finding" switches re-run the models live and show how each estimate responds; labelled as model sensitivity, not the effect of treatment. LDL, HDL and weight are locked because the models learned no benefit from lowering them in this cohort.
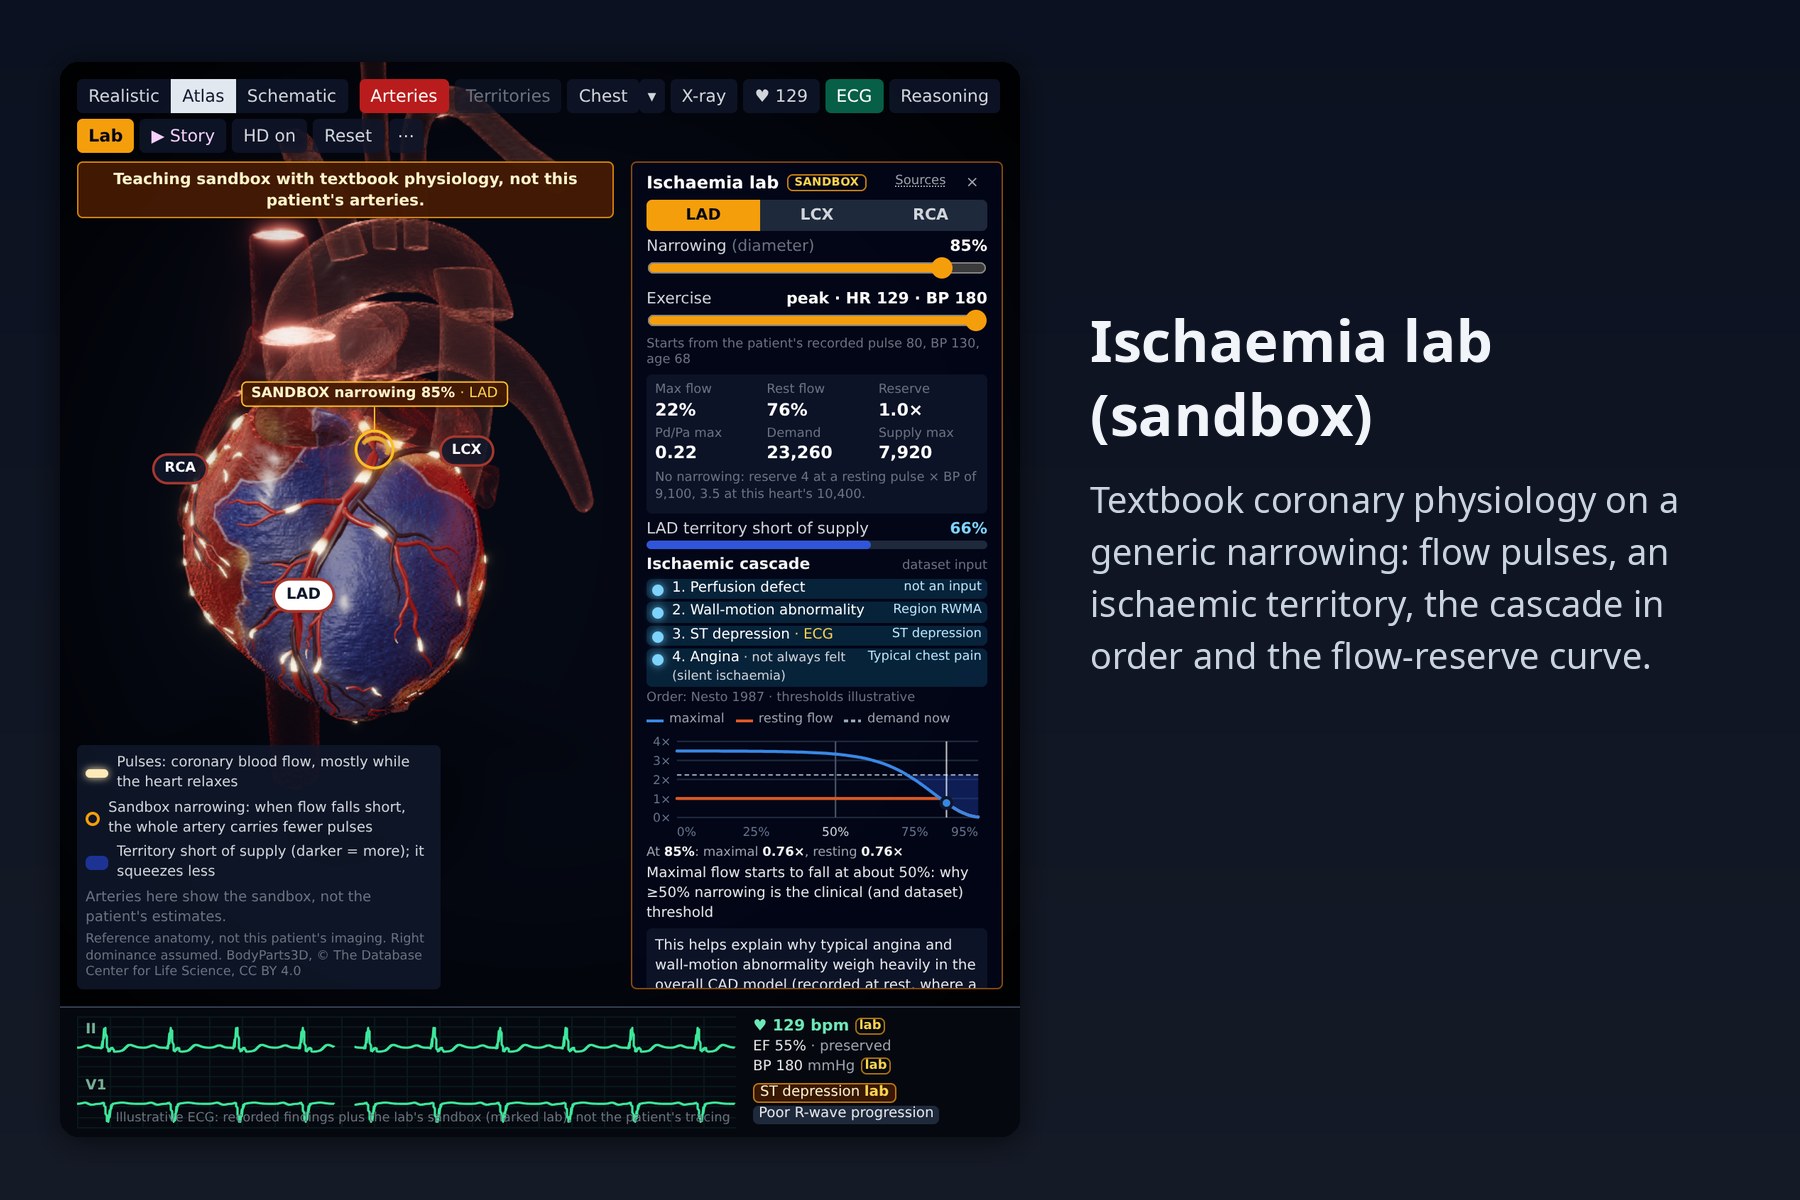
- Ischaemia lab: a labelled teaching sandbox with textbook coronary physiology. Drag a narrowing and an exercise level and watch flow pulses thin, the territory turn ischaemic and contract less, and the ischaemic cascade light up next to the dataset inputs it corresponds to; a flow-reserve curve shows why ≥50% is the threshold.
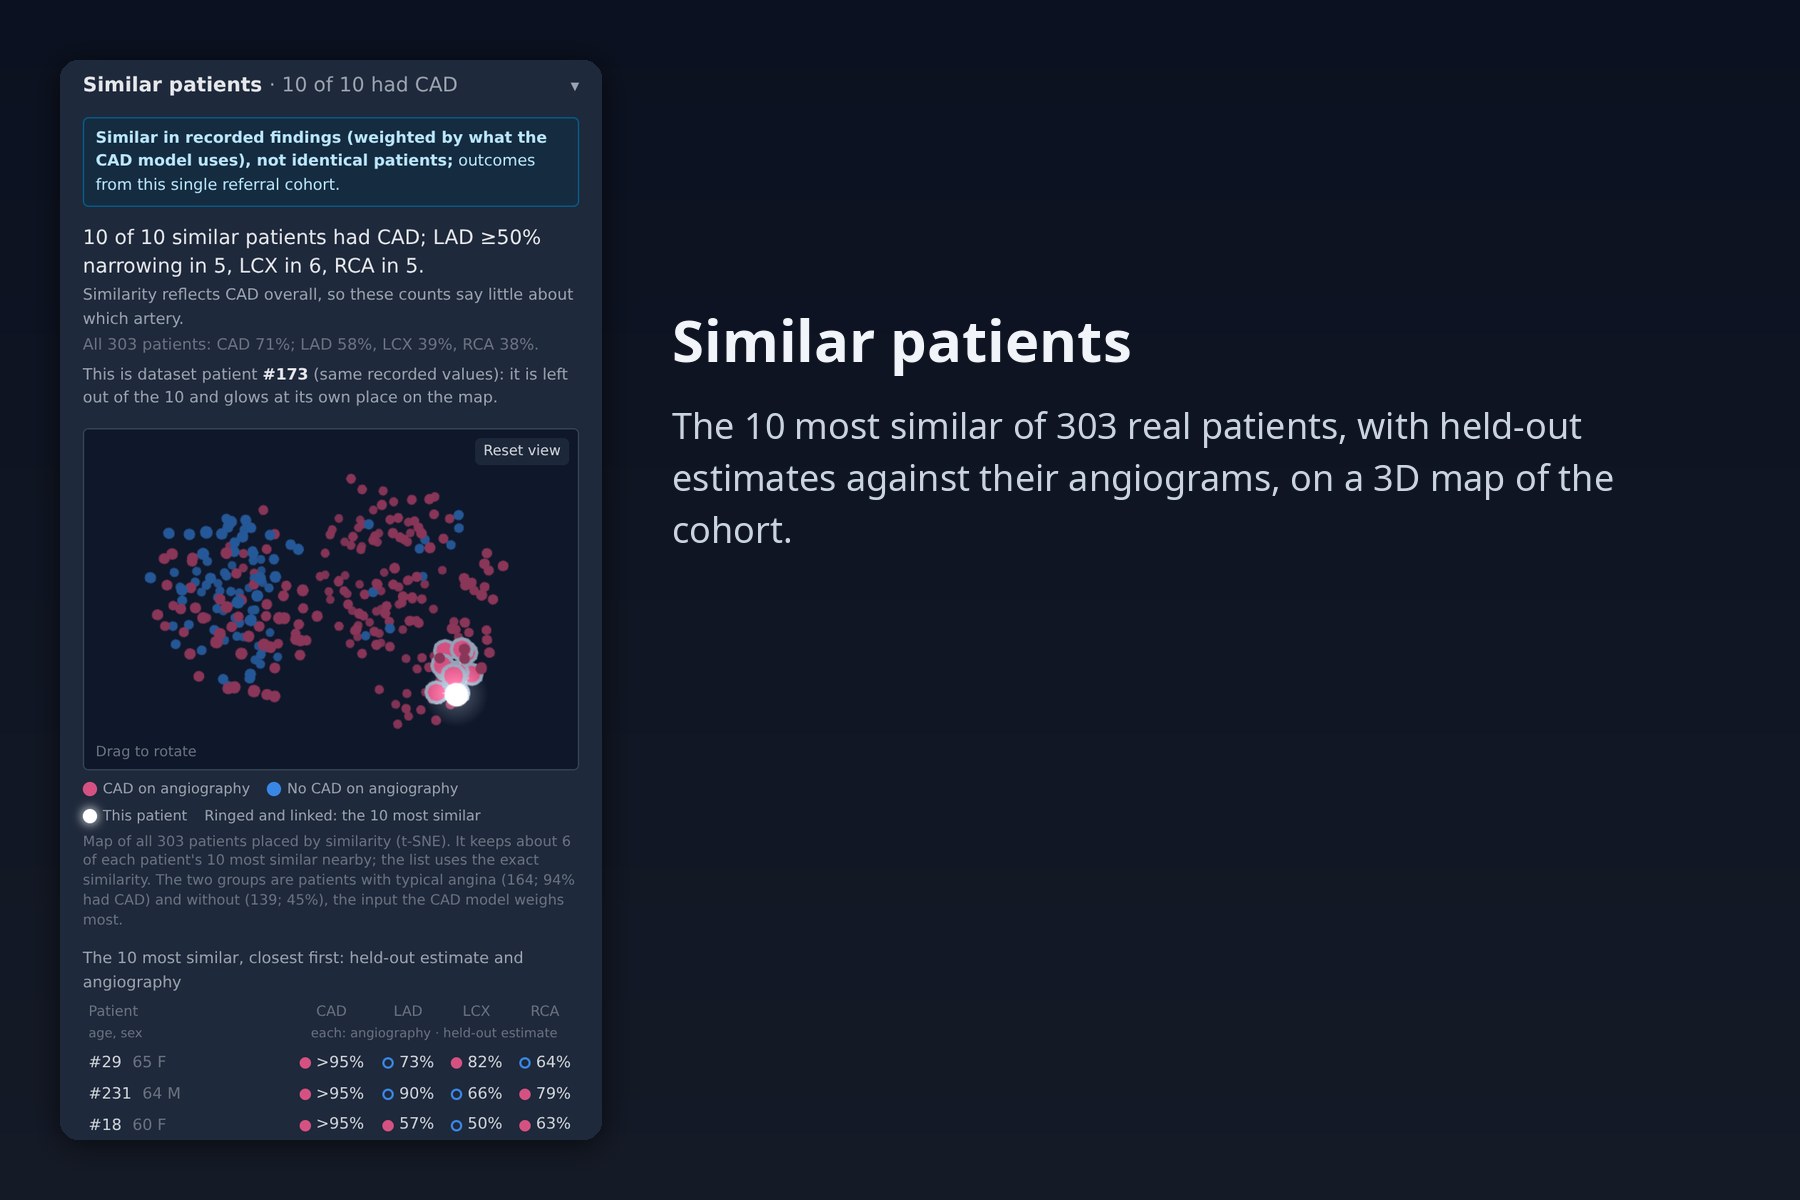
- Similar patients: the 10 most similar of the 303 real patients, with their held-out estimates against their angiograms, and a 3D map of the whole cohort.
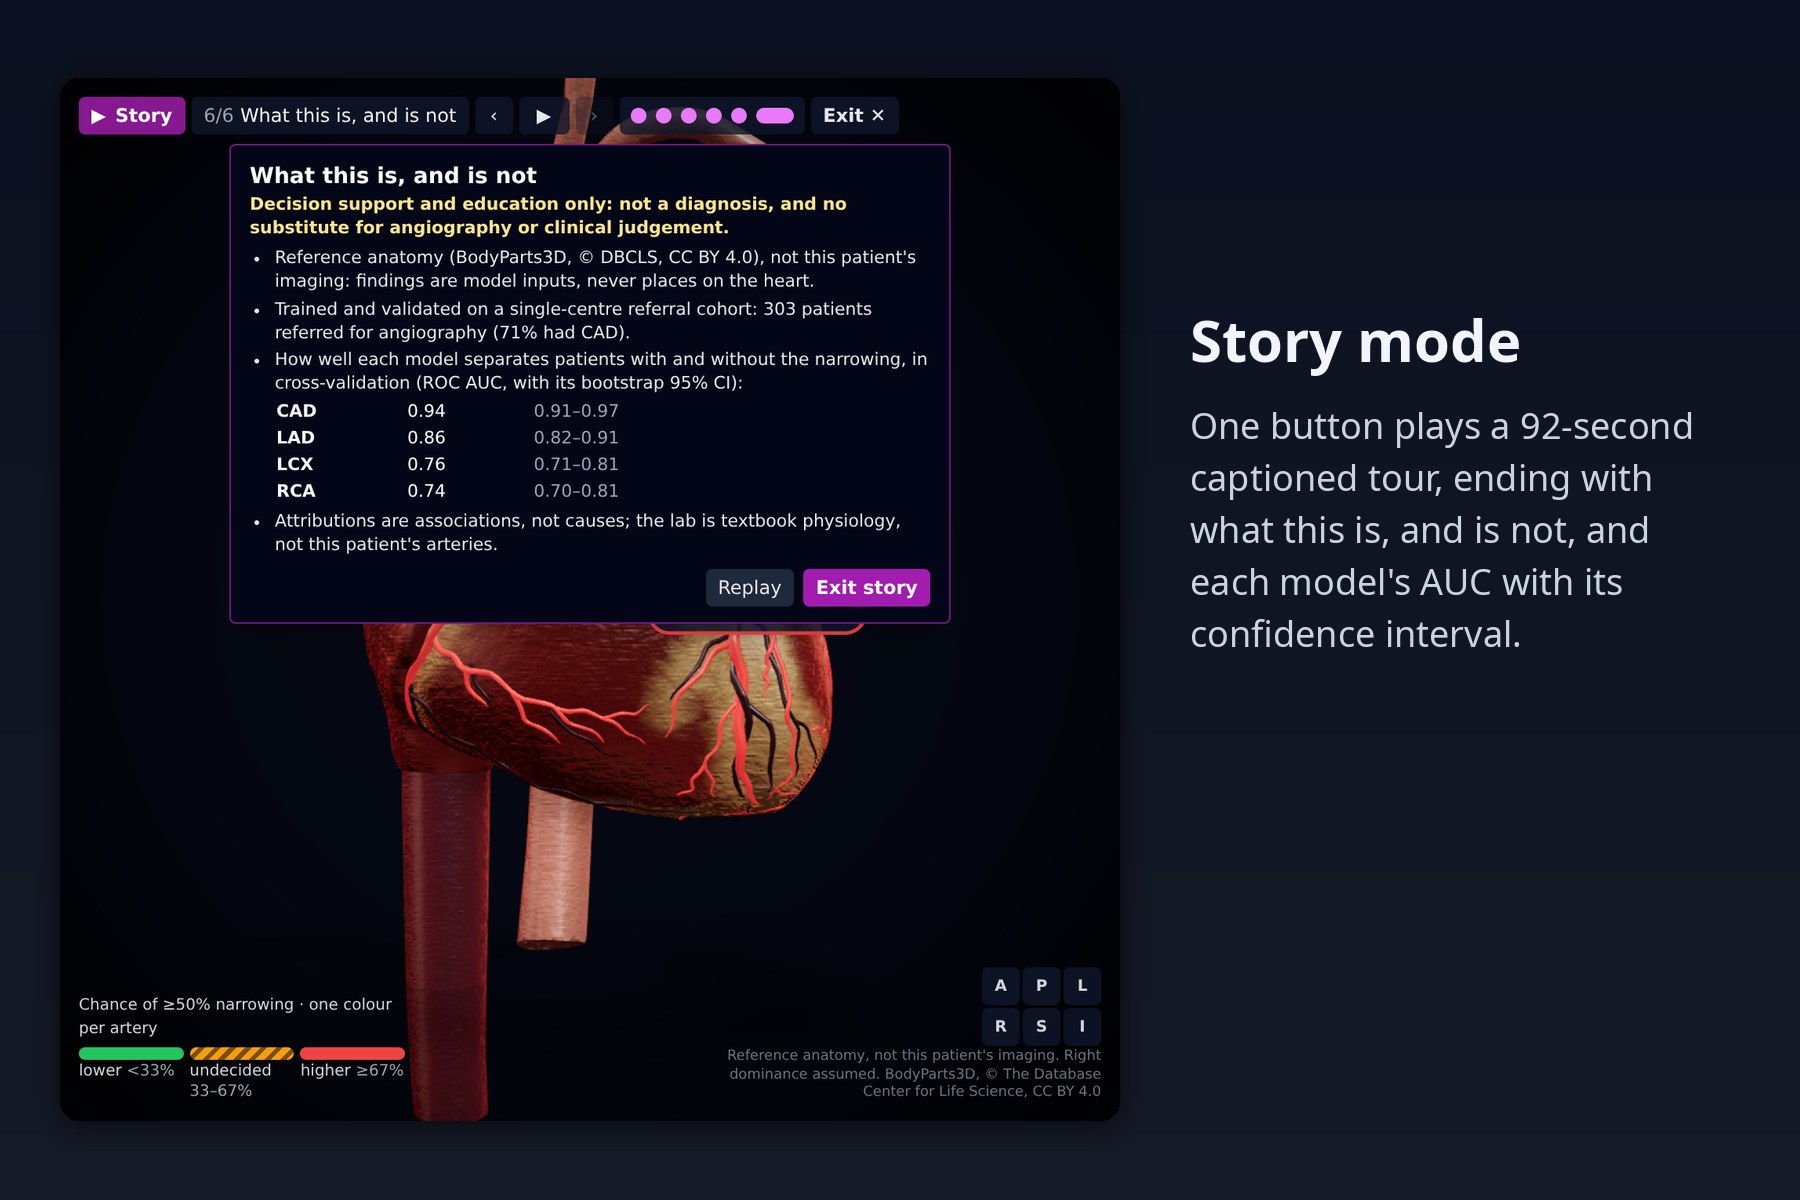
- Tells the story in one click: a captioned 90-second tour of all of the above on the current patient, ending with an honesty card (reference anatomy, referral cohort, cross-validated AUCs with confidence intervals); Esc gives back the user's exact view.
- Explains every estimate exactly: a one-sentence summary, the top drivers with odds multipliers, a waterfall from the model's starting point to the patient, and a physiological breakdown of all 55 measurements by body system.
- Is honest about uncertainty: likelihood bands with the event rate observed in validation, each model's AUC (weaker vessel models marked), held-out estimates against the real angiography for example patients, including false alarms, and a permanent safety disclaimer.
- Is usable: quick (19 inputs) or full (55) entry, validation as you type, live updates, clear errors.
How we built it
- Models (Python, scikit-learn, XGBoost, LightGBM). We built a leakage-safe evaluation harness first (5×5 repeated stratified CV, everything learned refitted inside each fold, paired comparisons on identical folds). Six modelling strategies were explored, each claim independently re-run on unseen splits with a leakage audit, and the final design was chosen on fresh splits with a rule fixed in advance. Each target is a log-odds blend of a regularised logistic regression on clinical composite features (Diamond-Forrester pre-test probability, risk-factor and ECG-abnormality counts, lipid ratios, eGFR, …) and a shallow boosted tree model. Decision thresholds and calibration are learned inside training folds.
- Independent verification. A separate script re-checks the shipped models: a label-permutation test, cross-validation on split seeds never used in development with bootstrap confidence intervals, baselines on the same folds, vessel specificity, clinical direction of single-finding changes, and that the API returns exactly the saved models' predictions.
- Explanations. Exact additive attributions (linear terms plus native TreeSHAP, averaged across the blend) that sum to the model output, checked on every request.
- API (FastAPI). Validation, imputation contract, four models, thresholds, calibration bands, out-of-range warnings and attributions in about 140 ms per request (measured median; /predict, used while dragging what-if sliders, about 40 ms).
- Front end (React, TypeScript, Tailwind). One field specification drives the form; live, debounced re-estimation with stale-result detection. The what-if calls a fast endpoint at most every 120 ms while a slider moves (one request in flight) and fetches attributions once on release.
- 3D (three.js / React Three Fiber, drei, three-mesh-bvh, postprocessing). Coronary paths traced on the realistic heart and snapped into its grooves with a BVH; a BodyParts3D pipeline that fetches only the 181 meshes it needs and compresses heart and chest to under 0.8 MB. The twin runs on one heart clock that keeps P wave, atrial kick, QRS, ejection and T wave in order. The lab uses Gould's pressure-flow model (ΔP = F·Q + S·Q²) with autoregulation and demand from heart rate × blood pressure, unit-tested against published values; flow pulses are a shader stripe along each artery's distance from its ostium, and reduced contraction is a wall-shader effect. Reasoning streams are instanced particles laid out around measured screen overlays.
- Similar patients. An offline script weights the 55 inputs by what the CAD model uses, builds a 3D t-SNE map and writes a static file; the browser finds neighbours with the script's exact arithmetic, leaves out inputs that were not entered and recognises a patient who is in the dataset.
- Tests. An in-process pipeline test and vitest unit tests for the browser logic (twin timing, physiology curves, data-type sums, what-if logic, nearest neighbours, the story script).
- Reproducible. The dataset and the four trained models ship with the repository, so it runs without
training;
train.py,make_presets.pyandmake_cohort.pyregenerate everything deterministically.
Results
| CAD | LAD | LCX | RCA | |
|---|---|---|---|---|
| ROC-AUC (5×5 CV) | 0.943 | 0.856 | 0.761 | 0.739 |
| ROC-AUC, independent re-run on fresh splits | 0.939 | 0.859 | 0.745 | 0.754 |
| 95% CI (bootstrap) | 0.91–0.97 | 0.82–0.91 | 0.71–0.81 | 0.70–0.81 |
| Accuracy at 0.5 | 0.883 | 0.799 | 0.700 | 0.682 |
| F1 at learned threshold (nested) | 0.915 | 0.839 | 0.660 | 0.613 |
No leakage: the full recipe on shuffled labels scores AUC 0.48–0.52. On the same folds the models beat the Diamond-Forrester score alone, plain logistic regression and default XGBoost; calibration slopes are 0.85–1.11. On splits never used for selection, the final models beat our first model in every repeat (AUC +0.040 / +0.034 / +0.014 / +0.068). One honest limit: within patients who have CAD, the vessel models' AUC falls to 0.62–0.69, so they mostly measure how much disease there is rather than which artery. The app therefore shows three independent per-artery estimates and never a "culprit" vessel.
Challenges we ran into
- Small data, optimistic literature. With 303 patients, split noise alone moves RCA AUC by about 0.02. Hyper-parameter searches inside folds, stacking and resampling all looked good on one split and failed on fresh ones; only paired, repeated, pre-registered comparisons separated real gains from noise.
- Silent data bugs. Platelets are stored in thousands, so a 250,000 entry was wildly out of distribution, and one input was never reaching the model because of a name mismatch. Both are now caught by validation and a test that the API schema and the model features match one-to-one.
- Imputation that lies. Filling missing yes/no findings with the cohort's most common value would have assumed typical angina and hypertension (majority-positive in this referral cohort). Unrecorded findings now count as absent, and every filled value is shown.
- Fitting arteries onto a real mesh. The model's coronaries are sculpted grooves, not objects. We traced them on the surface and snapped tubes into the grooves with a BVH, then derived territories from the result.
- Simulations that could be mistaken for the patient. Every layer says what it is (reference anatomy, recorded values, sandbox, sensitivity not treatment). The what-if never edits the record, and the heartbeat and ECG keep the recorded values while a scenario recolours the arteries.
- When the data contradicted our script. We planned to say ST depression is one of the model's strongest inputs; it ranks 24th of 63 in the CAD model, so the lab's closing line changed. LDL, HDL and weight show no protective direction in this referral cohort, so the what-if locks them instead of offering advice-like sliders.
- "Similar" patients that were the patient. In quick mode, defaults for inputs not entered made 292 of 303 dataset patients list their own record among their 10 neighbours. Comparing only entered inputs, plus a strict identity check, brought that to zero.
Accomplishments that we're proud of
- An evaluation we can defend line by line, re-verified independently: no leakage, fresh splits, confidence intervals, baselines.
- Explanations that are mathematically exact, and data-type streams that add up to the model's log-odds.
- A heart that beats like the patient's, with an ECG built from their findings, on all three hearts.
- A physiology lab whose model reproduces the published curve (maximal flow first falls below 95% at about 50% narrowing; at a typical resting pulse × pressure, resting flow holds to about 84%).
- Showing the model's own false alarms and limits in the product instead of hiding them.
What we learned
Honest validation is most of the work on small clinical data. Calibration matters as much as AUC once probabilities are shown to people. Clinically motivated features (the Diamond-Forrester pre-test table, for example) beat model tuning. Visual storytelling needs the same discipline as metrics: every animation needs a caption saying what it is, and the data can overrule the story. Vessel labels from a single referral cohort mostly encode how much disease there is, not where it is.
What's next
External validation on a second cohort; vessel-specific modelling; a printable patient report; driving the twin from real ECG tracings and echo measurements where available; and segment-level lesion display only if imaging-derived labels become available.
Built with
python · fastapi · pydantic · scikit-learn · xgboost · lightgbm · pandas · numpy · react · typescript · tailwindcss · vite · vitest · three.js · react-three-fiber · drei · three-mesh-bvh · postprocessing · meshoptimizer · gltf-transform · bodyparts3d
Credits
Dataset: Extension of Z-Alizadeh Sani dataset, UCI Machine Learning Repository. 3D heart model: "Realistic Human Heart" by neshallads (Sketchfab), CC BY 4.0. Atlas heart and chest: BodyParts3D, © The Database Center for Life Science, CC BY 4.0. Lab physiology: published sources cited in the code (Gould 1974 and 1980, Pijls 1993, Nesto & Kowalchuk 1987, among others).
Safety: decision support / educational use only; not a diagnosis and not a substitute for angiography or professional medical judgement.
Built With
- drei
- fastapi
- gltf-transform
- lightgbm
- meshoptimizer
- numpy
- pandas
- postprocessing
- pydantic
- python
- react
- react-three-fiber
- scikit-learn
- tailwindcss
- three-mesh-bvh
- three.js
- typescript
- vite
- vitest
- xgboost


Log in or sign up for Devpost to join the conversation.