-
-
Response
-
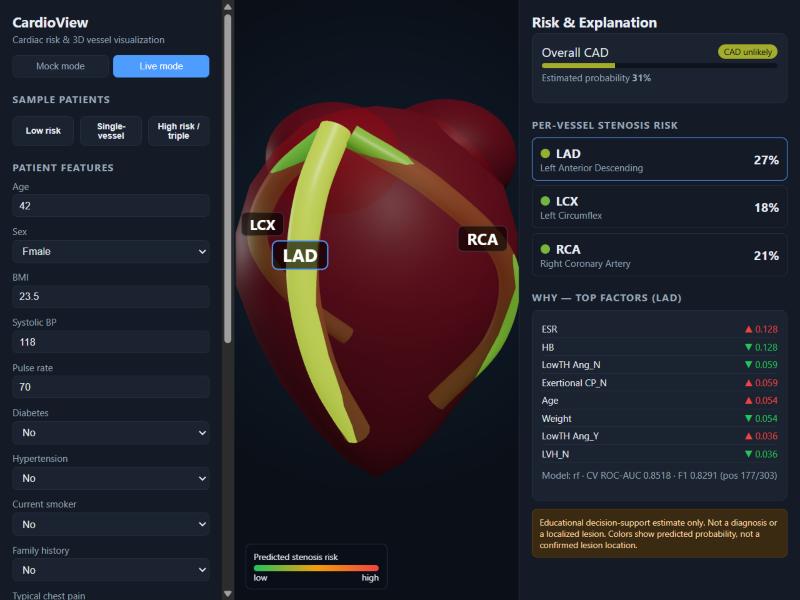
Low risk patient analysis
-
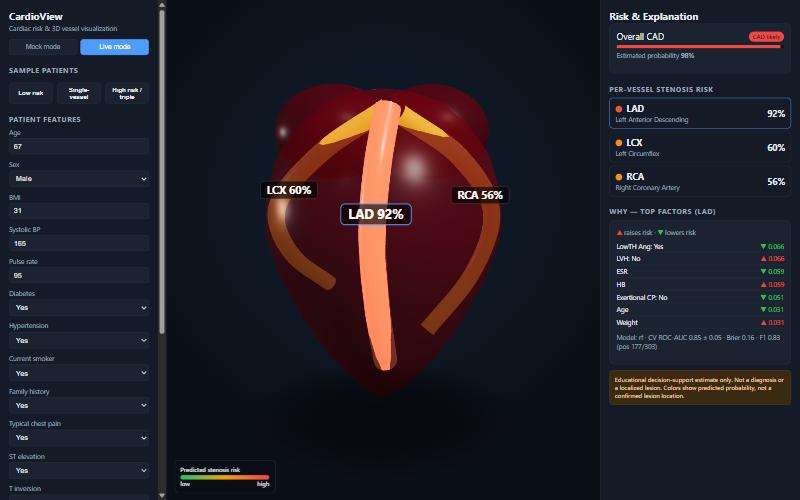
Specific artery selected
-
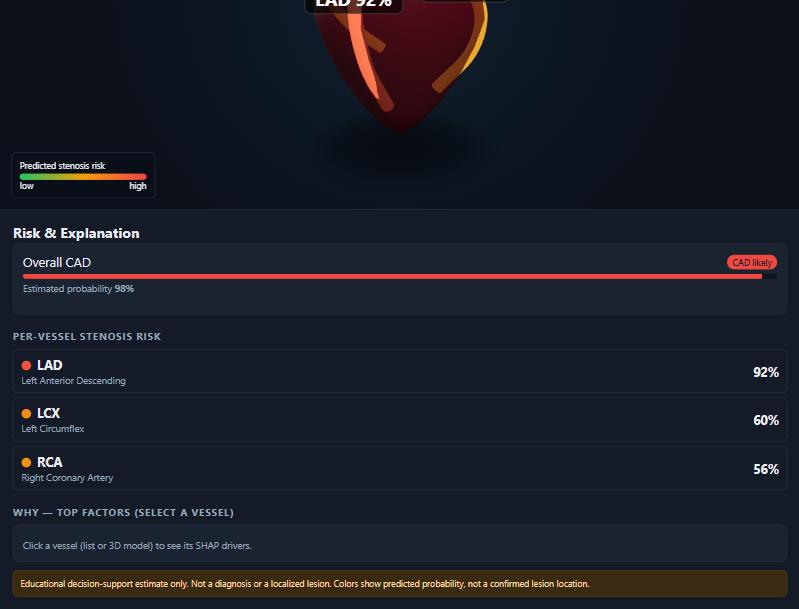
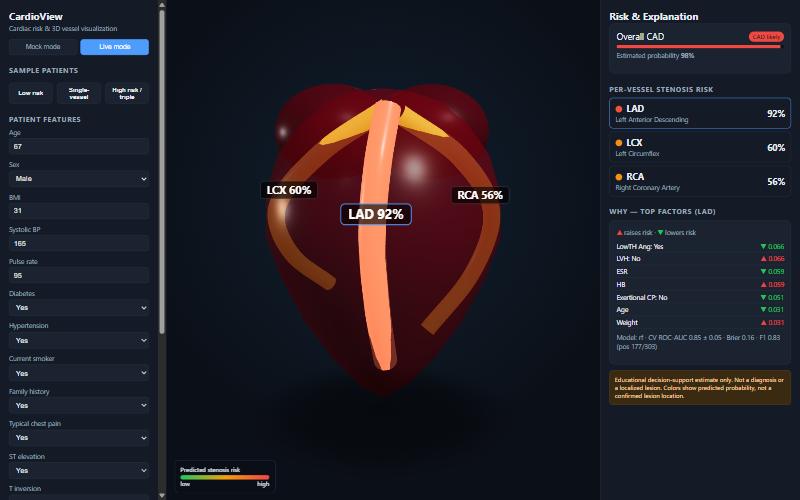
High risk patient analysis
Inspiration
Cardiovascular disease is the major cause of death in the world. A risk calculator provides you with a number, but can provide no information of where the risk is actually developing inside the heart to the clinician or patient. Well, we wanted to convert a cardiac risk model into something visible, movable and understandable, but not going so far as to say more than can be factually presented.
What it does
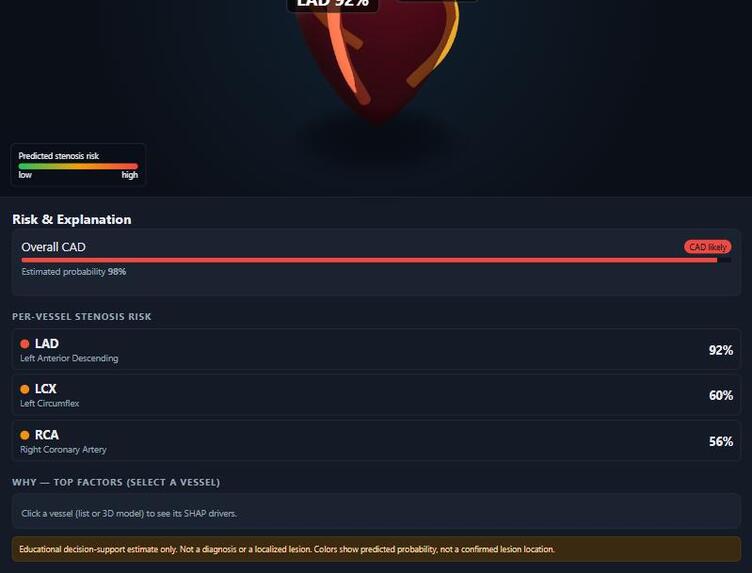
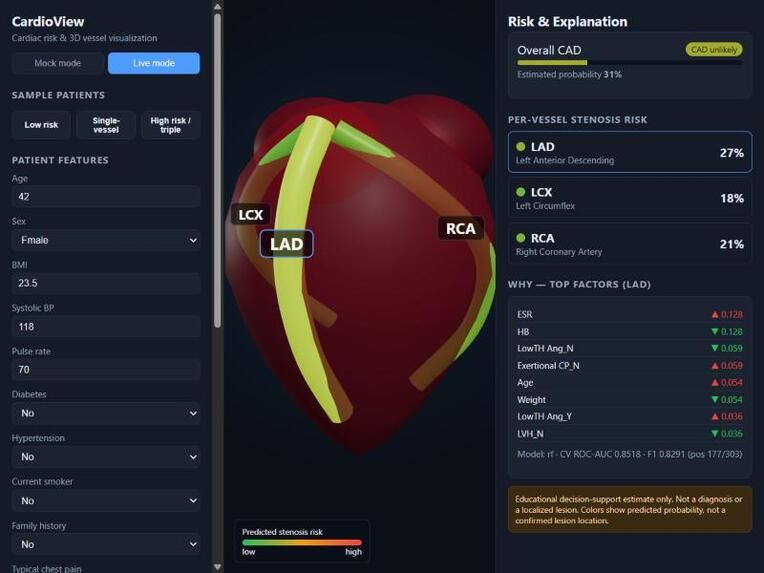
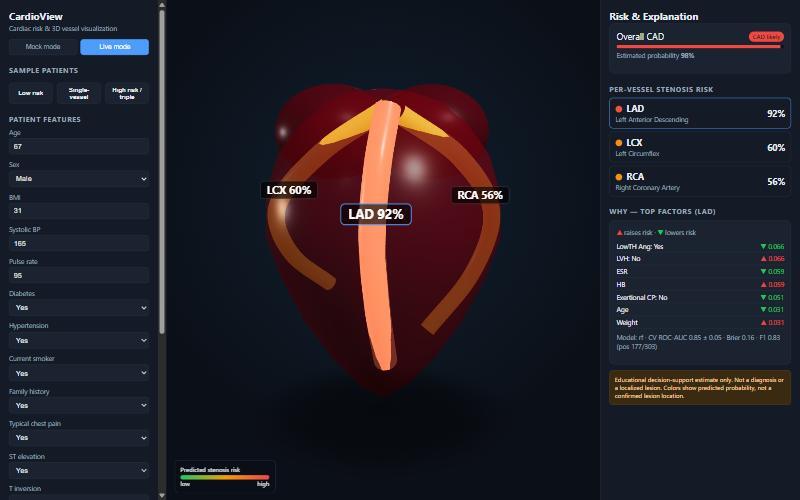
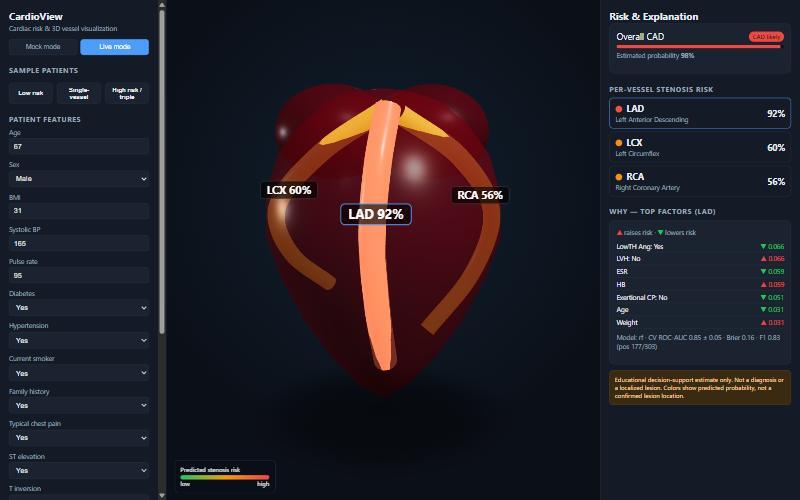
CardioView estimates the overall CAD status and the per-vessel stenosis risk of three main coronary arteries (LAD, LCX, RCA) based on the routine clinical, ECG, lab and echo parameters. An interactive 3D heart illuminates each artery on a green-to-red scale you can rotate, zoom and click, highlighting the artery's brightness on a green-to-red scale. Clicking on a vein reveals the causes of a vein's score and the panel displays calibrated probabilities with honest cross-validated measurements and maintains a clinical disclaimer displayed throughout.
How we built it
Model: Scikit-learn pipeline applied and trained on Z-Alizadeh Sani Extension dataset, which comprises 55 features before the diagnostic ones are excluded but 303 patients. We collect the logistic regression and random forest for each target and retain the best model based on repeated stratified cross-validation. Explanations are available from SHAP. The predictions and SHAP values are given by a FastAPI backend, the front end is React + React Three Fiber and the three arteries are rendered as three separate 3D tubes that change colour directly from the model's output.
Results
Not inflated held-out scores are repeated stratified five-fold cross validation means:
- Overall CAD: ROC-AUC > 0.92
- LAD: around 0.85 The levels of LCX and RCA were 0.72 and 0.71, respectively, which are lower because fewer patients are affected in these two arteries. We reveal it, not keep it secret.
Challenges we ran into
The largest is to block target leakage: The Cath, LAD, LCX and RCA result columns are diagnostic outputs so we remove all four of these from the inputs. If any of them are left in, a bogus near-perfect score is created. We also ensured that we correctly labelled anatomy, a coloured vessel does not indicate a lesion – it indicates risk of one being present. We repeated cross validating, with only 303 patients for stable estimates.
What we learned
If it's on a small, well-studied dataset, rigour and clear explanation is more important than trying to achieve a larger dotted number (accuracy), and good probability calibration is what makes a visualisation credible.
What's next
There is a real anatomical heart mesh, more data to validate externally, and feedback from the clinicians.
Disclaimer
This is an educational decision support prototype. It is not a diagnosis, do not use it as a replacement for medical imaging – it is a prediction of probability NOT a prediction of a lesion.
Built With
- fastapi
- javascript
- pandas
- python
- react
- react-three-fiber
- scikit-learn
- shap
- three.js
- uvicorn
- vite
- webgl

Log in or sign up for Devpost to join the conversation.