-
-
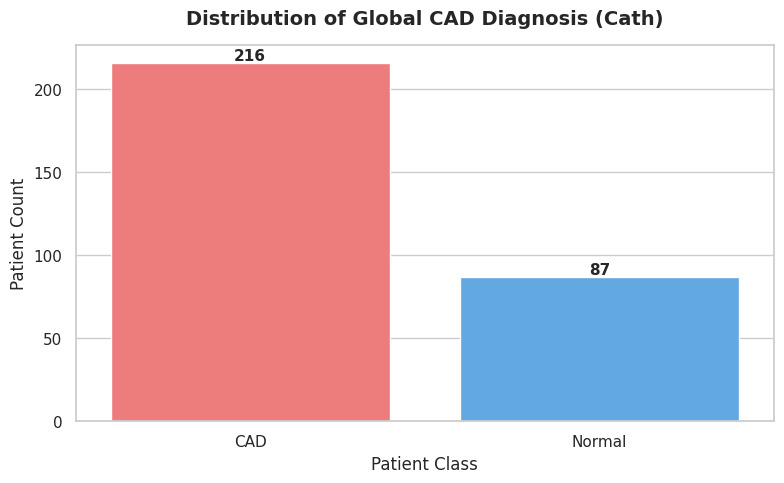
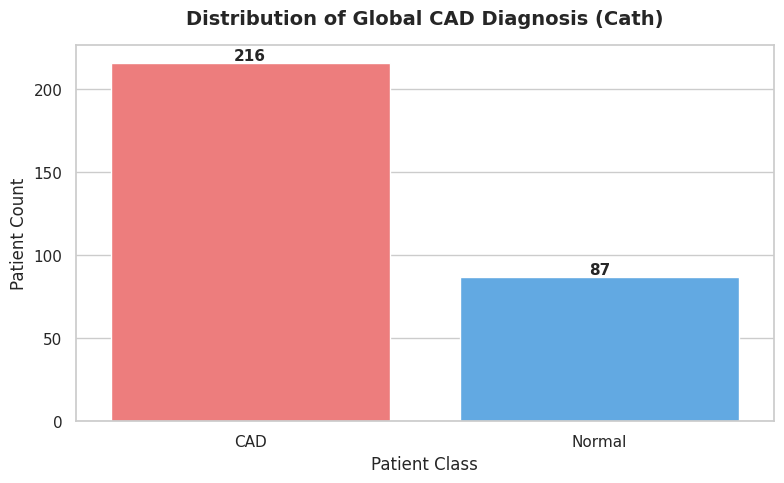
clean data
-
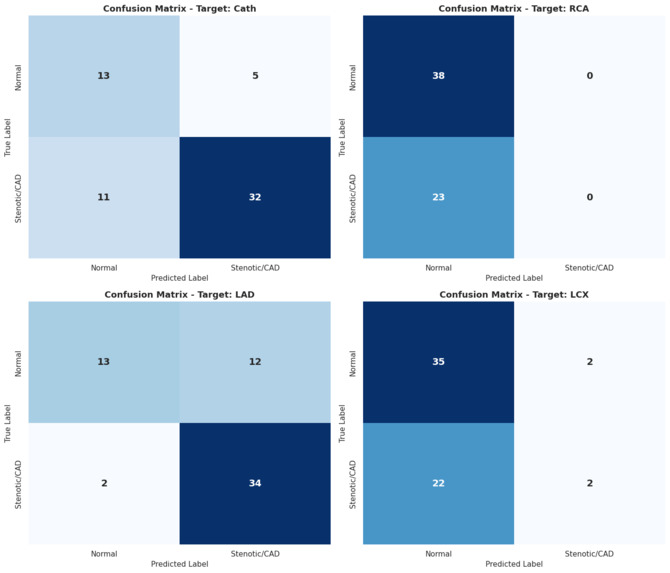
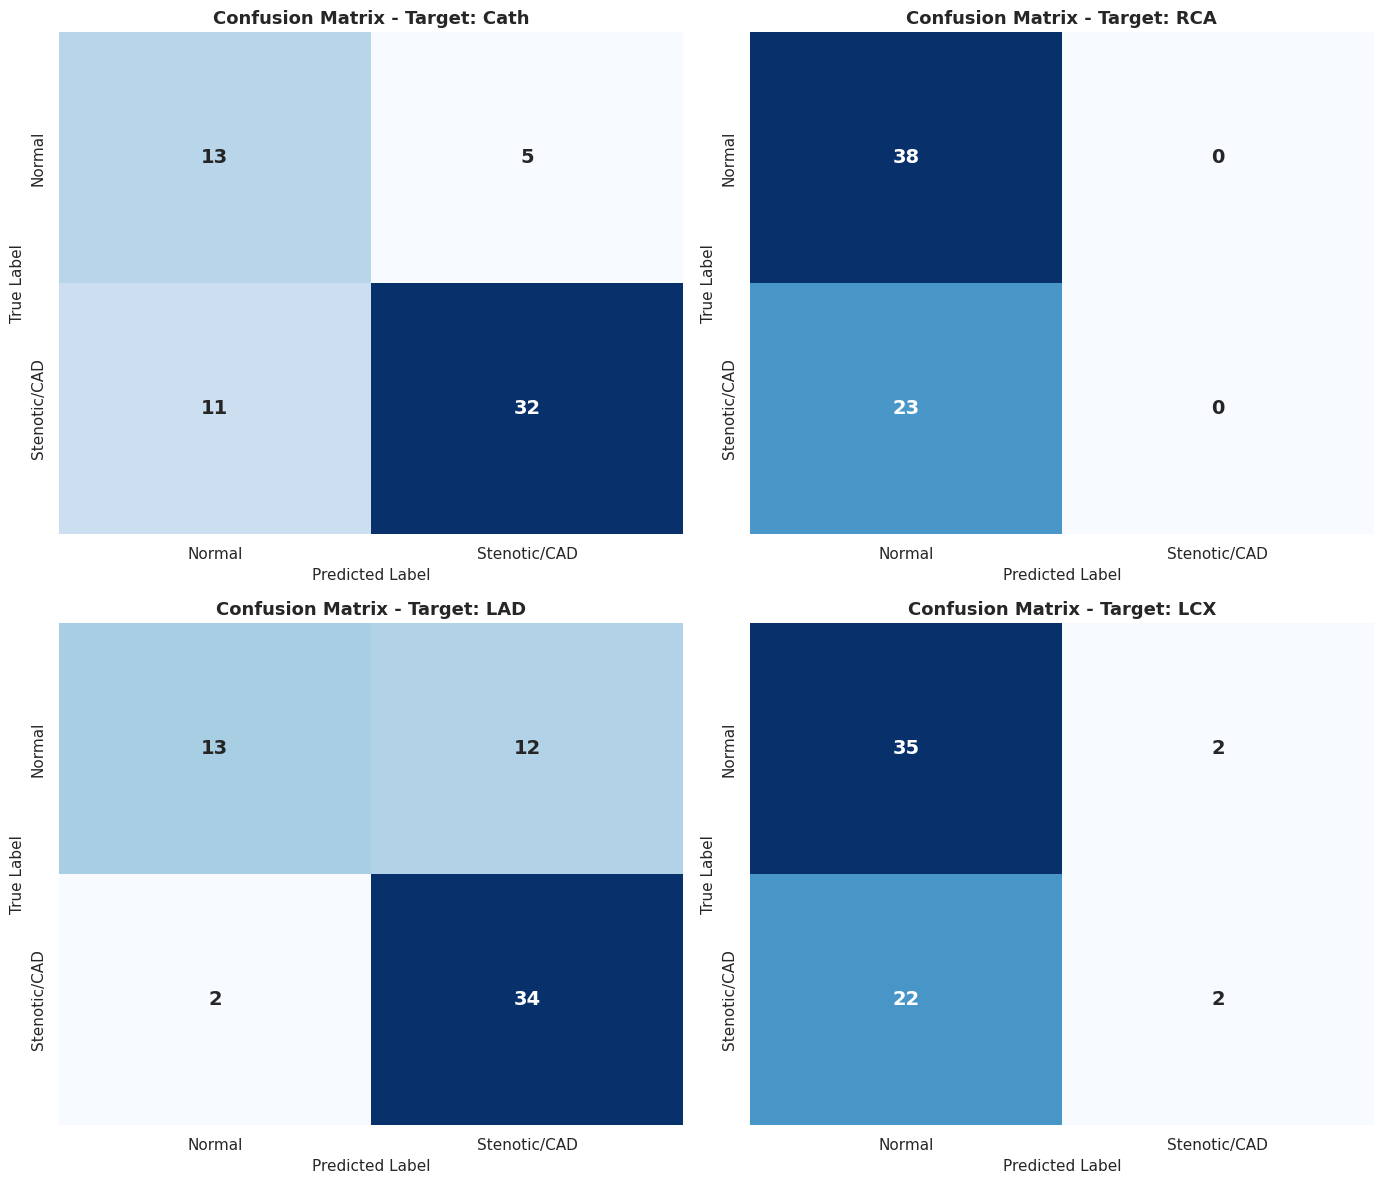
conf_matrix
-
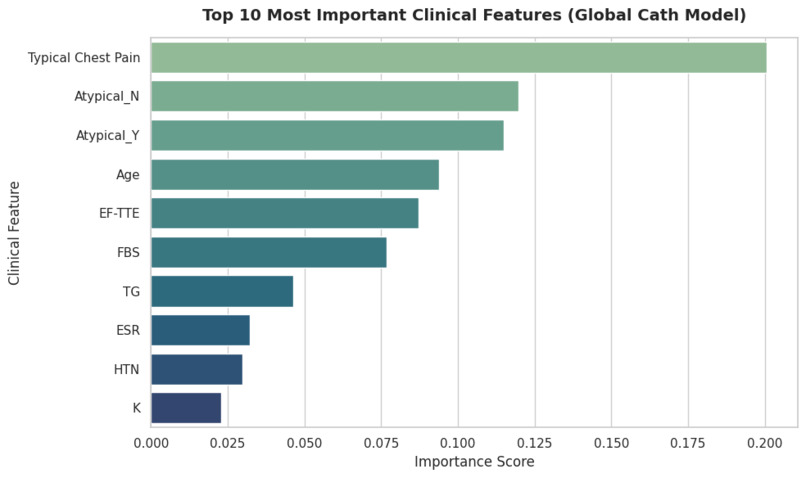
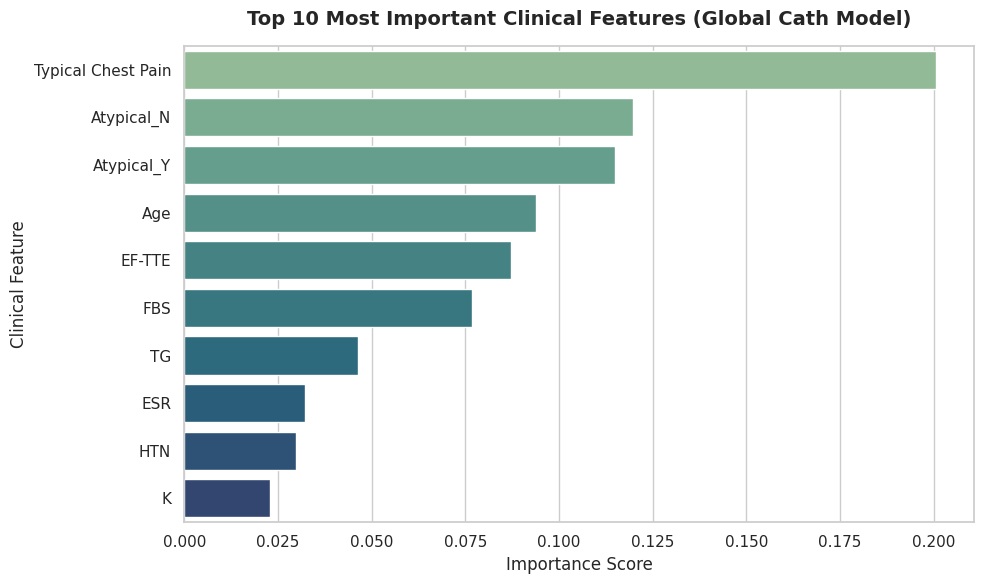
important features
-
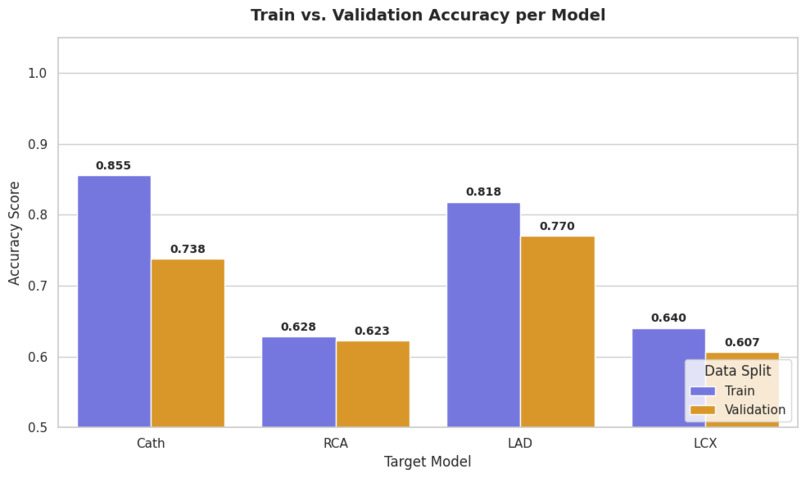
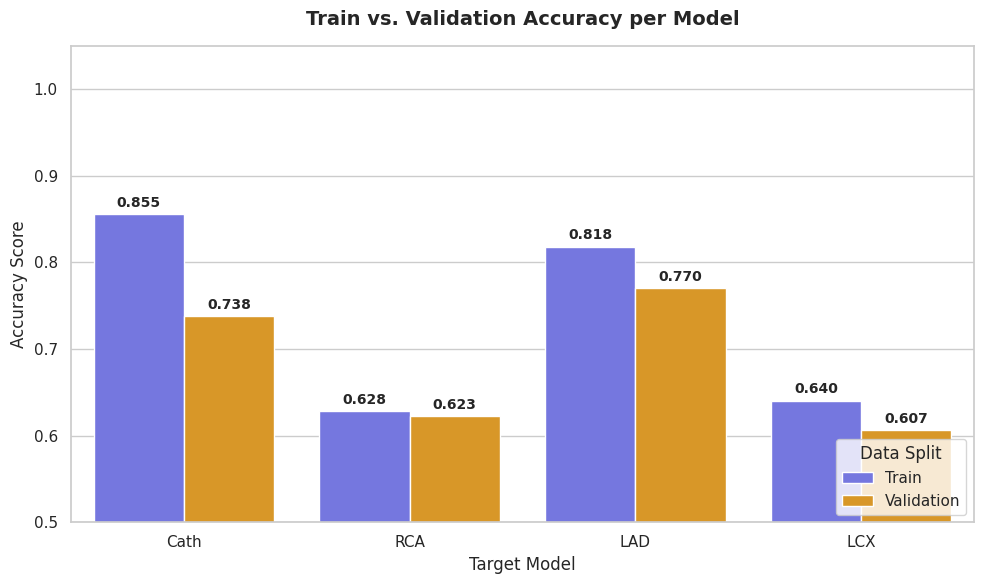
train vs val accuracy
-
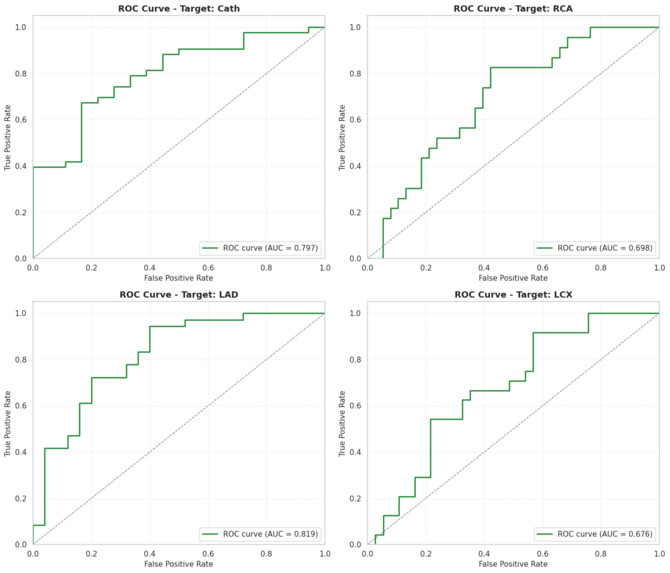
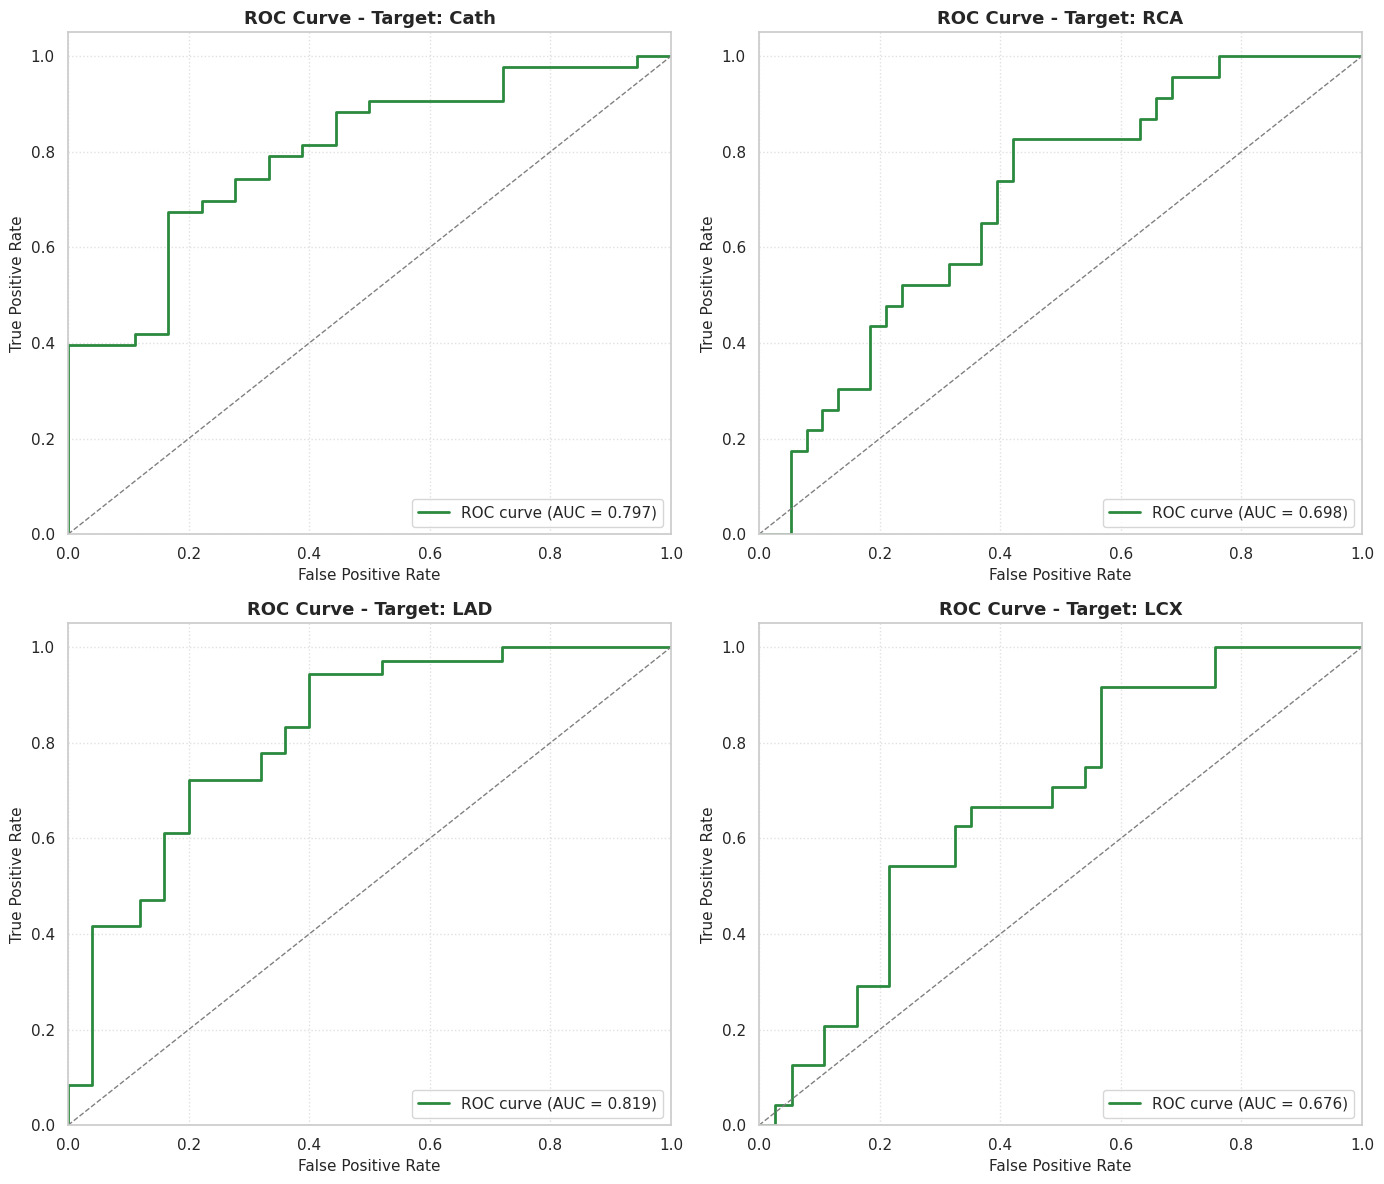
roc accuracy score
InspirationInspiration
The inspiration behind this project came from the critical need to make complex medical data intuitive and actionable for both patients and healthcare providers. While patient physiological and clinical data can yield vital prognostic indicators, raw numbers and clinical reports often fail to convey the spatial and functional severity of cardiovascular diseases like coronary artery disease. We wanted to bridge this gap by translating abstract risk metrics into a vivid, immersive, and interactive 3D human anatomical model, making cardiac risk assessment immediate and visually compelling.
What it does
Our system is an interactive 3D visualization platform designed to predict coronary artery disease and overall cardiac risk. By processing patient physiological and clinical inputs, the application maps multi-faceted risk predictions directly onto an interactive 3D anatomical model of the human heart and vascular system. This allows users and medical professionals to dynamically explore risk zones, visualize clinical correlations, and better understand localized cardiovascular vulnerabilities.
How we built it
Architecture & Pipeline: Designed a multimodal data ingestion pipeline to process clinical records and physiological parameters.

3D Visualization: Built an interactive rendering environment using modern web/graphics frameworks to map predictive outputs onto anatomical structures.

AI / Prediction Engine: Integrated machine learning models trained to evaluate risk factors and output probability scores for coronary artery disease and cardiac events.
Challenges we ran into
Data Mapping & Normalization: Aligning disparate clinical data points with 3D spatial coordinates on the anatomical model required precise calibration and scaling.

Performance Optimization: Ensuring the interactive 3D rendering remained smooth and responsive while handling backend prediction computations.

Multimodal Integration: Seamlessly synchronizing the predictive output states with visual state changes in the 3D viewer.
What we learned
We gained deep technical insights into handling clinical datasets, optimizing web-based 3D graphics rendering, and building intuitive interfaces for complex medical data visualization. Most importantly, we learned how powerful multimodal AI and immersive design can be in translating critical healthcare data into life-saving insights.
What it does
Our system is an interactive 3D visualization platform designed to predict coronary artery disease (CAD) and overall cardiac risk. By processing patient physiological, demographic, and clinical data, the application predicts overall CAD status as well as vessel-specific stenosis probabilities for the Left Anterior Descending (LAD), Left Circumflex (LCX), and Right Coronary Artery (RCA). These multi-faceted risk predictions are mapped directly onto an interactive 3D anatomical model of the human heart and vascular system, allowing users and healthcare providers to dynamically explore risk zones, rotate, zoom, and inspect localized vascular vulnerabilities. A companion clinical dashboard also provides an interpretable breakdown of risk factors (using feature attribution like SHAP/LIME) alongside essential vital metrics and compliance disclaimers.
How we built it
Machine Learning Pipeline: Trained classification models using Python, scikit-learn, and XGBoost on the Z-Alizadeh Sani clinical dataset (from the UCI Machine Learning Repository) to evaluate patient records, vital signs, lab values, and echocardiographic findings while rigorously preventing target leakage.
Backend & API: Developed a robust FastAPI backend to host the predictive models and serve real-time risk scores and feature importances.
Frontend & 3D Visualization: Built a Streamlit and web-based rendering environment integrating interactive 3D anatomy to map predicted stenosis probabilities dynamically onto corresponding anatomical nodes (LAD, LCX, RCA).
Challenges we ran into
Data Mapping & Normalization: Aligning tabular clinical features and probabilistic outputs with precise 3D spatial coordinates and color nodes on the anatomical heart model required careful calibration.
Target Leakage Prevention: Ensuring that vessel-specific diagnostic features (like direct catheterization outcomes) were properly excluded from model inputs to maintain a true predictive evaluation standard.
Performance Optimization: Balancing smooth, responsive 3D graphics rendering in the browser with backend data processing and inference calls.
Accomplishments that we're proud of Successfully bridging the gap between abstract numerical machine learning predictions and intuitive, spatial 3D medical visualization.
Achieving multi-vessel stenosis breakdown (LAD, LCX, RCA) alongside overall CAD classification, giving clinicians targeted anatomical insights rather than just a generalized score.
Building a seamless end-to-end prototype from raw clinical data ingestion to an interactive web dashboard with transparent model explainability.
What we learned
We gained valuable domain knowledge in cardiovascular pathology—specifically regarding coronary vessel distribution (LAD, LCX, RCA) and stenosis criteria—as well as technical mastery over integrating machine learning models with interactive 3D web graphics. We also reinforced the importance of clinical interpretability and safety disclaimers when building decision-support tools for healthcare.
What's next for Cardiovascular Risk Visualization & Prediction
Advanced 3D Meshes: Integrating higher-resolution, open-source 3D anatomical mesh models (such as from BodyParts3D or advanced GLTF assets) for even finer anatomical fidelity.
Expanded Multimodal Inputs: Incorporating medical imaging files (such as real echocardiogram videos or DICOM scans) directly into the multimodal pipeline.
Clinical Validation: Expanding testing with broader clinical datasets and gathering user feedback from medical professionals to refine the interpretability dashboard for real-world decision support workflows.
Built With
- fastapi
- numpy
- pandas
- python
- scikit-learn
- streamlit
- vscode
- xgboost

Log in or sign up for Devpost to join the conversation.