Inspiration
Heart disease is usually reduced to one number, a yes or no from a model nobody can question. But clinicians and students want to know which artery is affected and why. I wanted to connect patient data, which lives in tables, with the heart, which is a 3D organ you can look at and ask questions of.
What it does
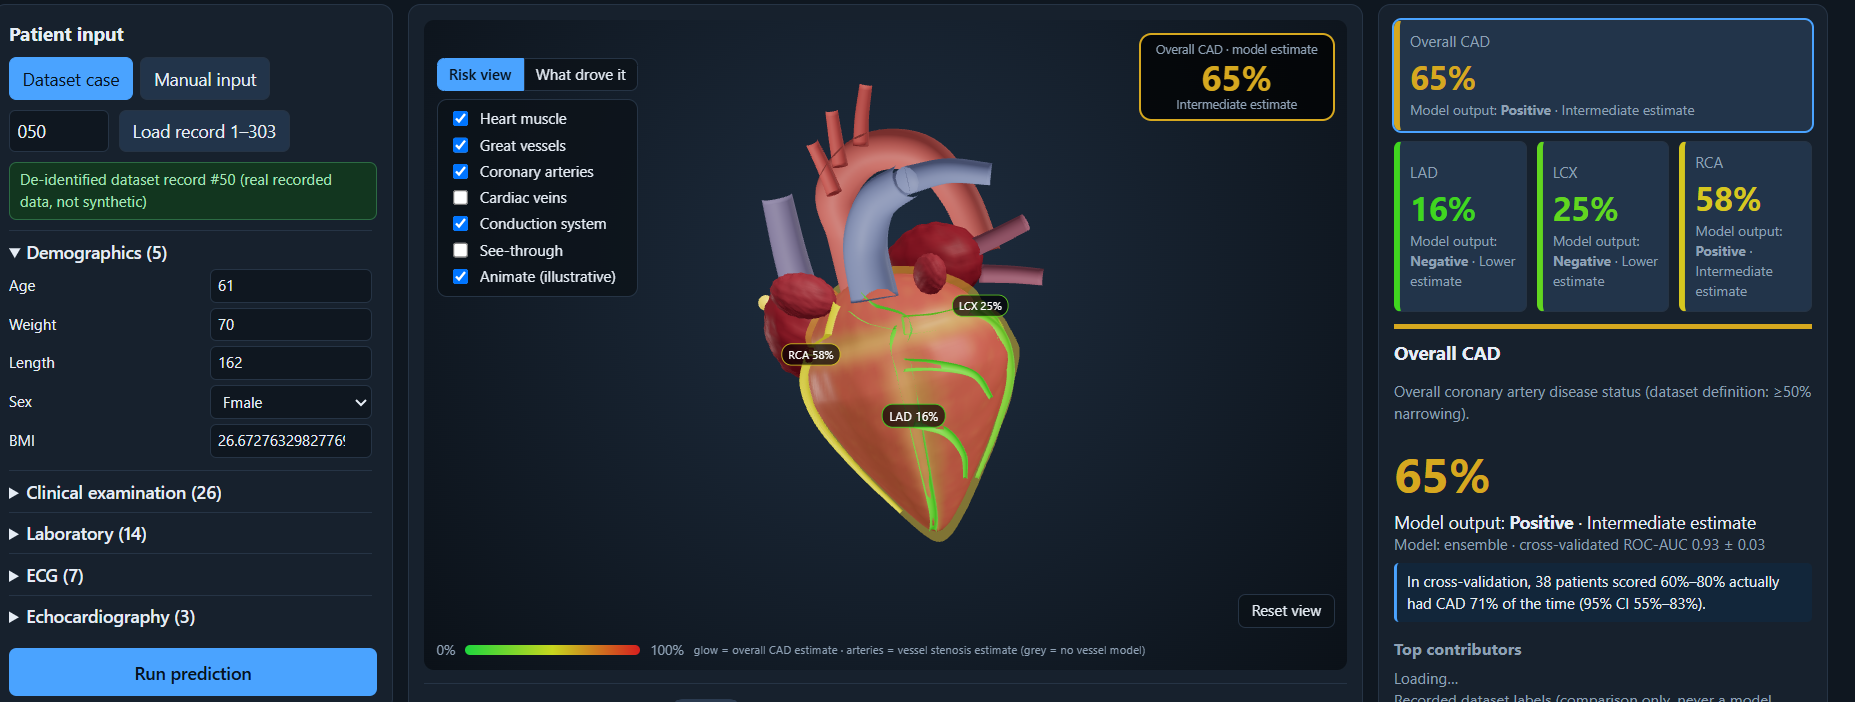
It takes one patient’s clinical, lab, ECG and echo data and predicts risk for overall CAD and for the LAD, LCX and RCA arteries. An interactive 3D heart and its coronary arteries are coloured by the predicted probabilities. Hovering or clicking any structure shows what it does and which measurements relate to it. You can switch layers (cardiac veins, conduction system), and every prediction is explained with SHAP. A what-if panel shows how changing one measurement moves the model’s output. A visible disclaimer states that it is for decision support and education only.
How I built it Data: the Extension of the Z-Alizadeh Sani dataset (UCI id 411), with 303 patients and 59 columns. Backend: FastAPI, scikit-learn, XGBoost and SHAP. It compares five models (logistic regression, random forest, XGBoost, an ensemble and a neural network) with repeated stratified cross-validation and picks the best per target. Frontend: React and React Three Fiber, with a procedural 3D heart, a clinical dashboard and a reliability chart. Safety: LAD, LCX, RCA and Cath are never model inputs. Preprocessing drops them, the transformed columns are checked again, the API rejects them, and tests enforce it. Challenges I ran into Keeping the answer labels out of the models. My first dataset had no per-vessel labels. Instead of inventing them, I built a mode that trains only what the data supports, then retrained on the Extension file. My first 3D heart looked like an egg with three lines, so I rebuilt it with ventricles, atria, great vessels, arteries, veins and a conduction system. A Windows text-encoding bug crashed training, so I fixed it and added a test for it. Accomplishments that I’m proud of Cross-validated ROC-AUC of 0.93 for overall CAD, 0.86 for LAD, and about 0.74 for LCX and 0.73 for RCA, against a baseline of 0.50. 85 automated tests covering leakage, SHAP consistency and the API. A 3D view where hover and click lead to real explanations tied to real dataset columns. Reporting the weaker results and the limits honestly. What I learned
A model score alone proves little. Leakage checks, a baseline, calibration and honest limits are what make a result believable. And explaining a prediction is as much a design problem as a modelling one.
What’s next for Cardiovascular Risk Visualization & Prediction Validate on an external dataset. Replace the procedural heart with a real anatomical mesh. Have a clinician review the structure notes. Try deep-learning models on larger data. Limitations
The dataset has 303 patients and no external validation, so the scores are mildly optimistic. The 3D heart is stylised, not a scan, and it never claims where disease is, because the data has no lesion locations. LCX and RCA predictions are only moderate. This is for decision support and education only, not a diagnosis.
Built With
- 3d-visualization
- explainable-ai
- fastapi
- healthcare
- javascript
- machine-learning
- numpy
- pandas
- pytest
- python
- react
- react-three-fiber
- scikit-learn
- shap
- three.js
- uvicorn
- vite
- webgl
- xgboost

Log in or sign up for Devpost to join the conversation.