-
-
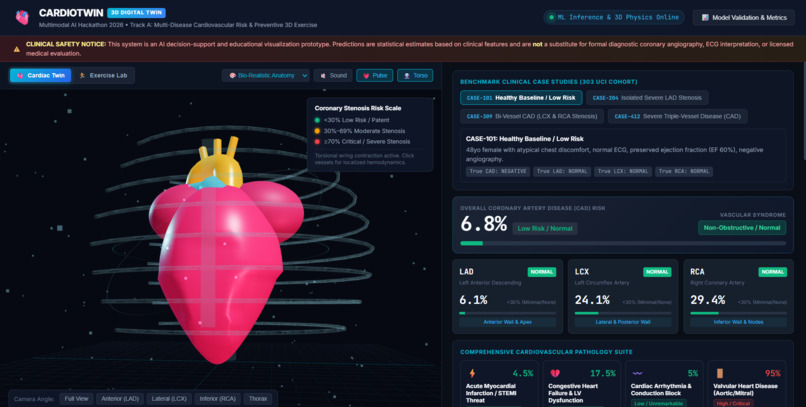
Interactive 3D visualization dashboard showcasing real-time data tracking and heart metric analytics.
The Story of CardioTwin 3D
The Spark: The Disconnect Between Numbers and Human Life Picture this: A 56-year-old patient named Robert sits in a cardiology consultation room. After blood tests, an ECG, and an echocardiogram, his physician hands him a clinical printout. Across the top reads a cold, abstract statistical figure: Estimated 10-Year Cardiovascular Disease Risk: 74.2% (HIGH). Robert stares at the paper, his heart sinking. But his mind is filled with confusion and fear: What does 74.2% actually mean inside my body? Is my heart about to stop tomorrow? Where is the blockage? Is it on the front? The back? Can my body recover? In modern medicine, cardiovascular disease remains the number one cause of death globally, claiming over 18 million lives every year. Yet, the way we communicate cardiac risk to both physicians and patients has remained fundamentally unchanged for decades: abstract scalar numbers trapped in paper lab reports. To actually see where an artery is blocked, patients traditionally have to undergo invasive coronary catheterization, an expensive, invasive procedure where a catheter is threaded through the groin or wrist into the beating heart, often performed only after severe damage or an acute heart attack has already occurred. We asked ourselves a transformative question: What if routine non-invasive clinical tests could come alive as a real-time, 3D anatomical digital twin, showing patients and doctors exactly which coronary vessel is narrowing, explaining why with transparent AI, and visually showing how exercise can heal the heart? That question gave birth to CardioTwin 3D.
The Clinical Challenge and The Machine Learning Breakthrough To turn this vision into reality, we took on Track A of the Multimodal AI Hackathon 2026. Using the clinical records of 303 angiographically validated patients from the UCI Z-Alizadeh Sani Extension cohort, we set out to build an AI engine that could predict not just overall disease, but the exact anatomical lesion status of the three primary coronary arteries: LAD (Left Anterior Descending), the notorious Widowmaker perfusing the anterior wall and apex; LCX (Left Circumflex), perfusing the lateral and posterior left ventricle; and RCA (Right Coronary Artery), perfusing the inferior heart and vital electrical conduction nodes. In medical machine learning, a widespread pitfall is target leakage, where invasive catheterization tags or downstream vessel outcomes accidentally bleed into the training data, producing deceptively high accuracy that fails in real clinical practice. We enforced a strict, non-negotiable rule: all invasive variables (Cath, LAD, LCX, RCA) were stripped from the feature space. Our models had to diagnose coronary artery disease relying exclusively on 55 non-invasive pre-catheterization biomarkers: demographics, vital signs, physical exam findings, 12-lead ECG traces, echocardiographic wall motion abnormalities, and routine serum labs. Through rigorous Stratified 5-Fold Cross-Validation benchmarking Random Forest, XGBoost, Gradient Boosting, and L2 Logistic Regression, our models achieved an outstanding 0.9315 Cross-Validation ROC-AUC and 0.8941 Test ROC-AUC with 86.9% accuracy on unseen patients for overall CAD. For the critical LAD Widowmaker vessel, our model achieved 0.8586 CV ROC-AUC and 80.6% recall, minimizing dangerous false negatives.
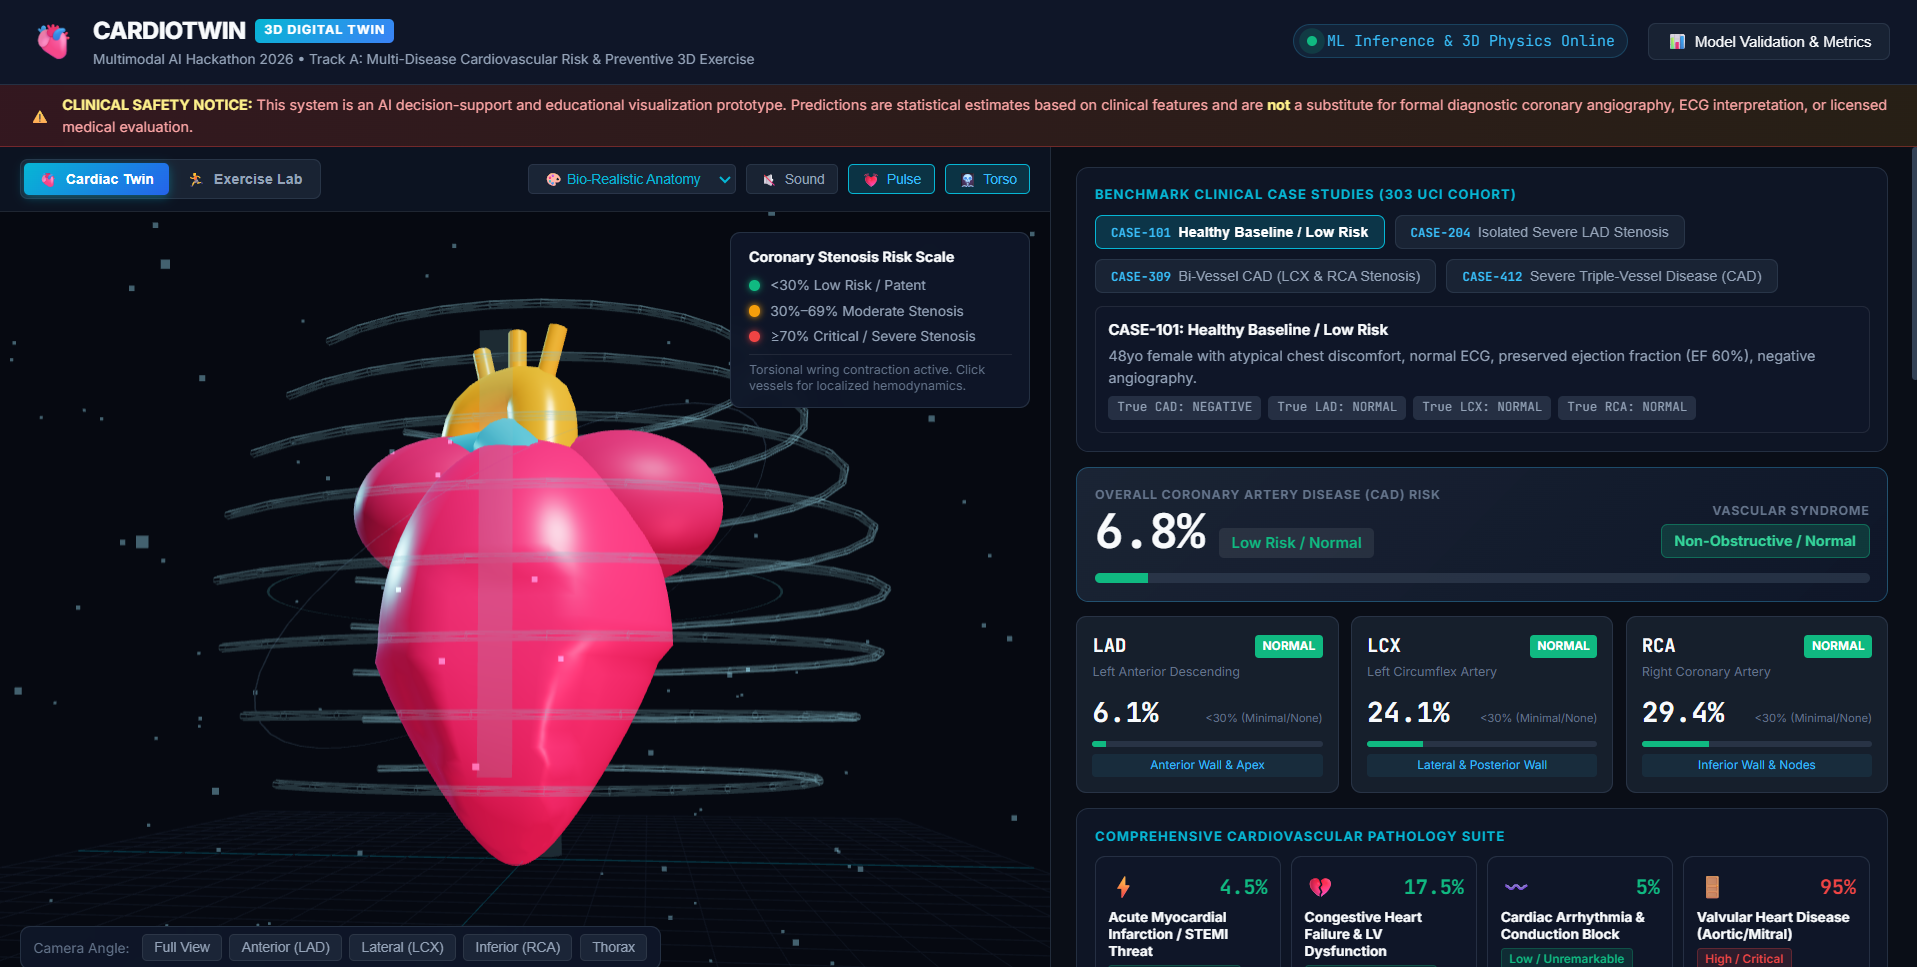
The Aha Moment: Bringing The 3D Heart to Life Having high predictive accuracy was only half the battle. A table of probabilities is still just numbers. The real magic happened when we fused machine learning with Three.js WebGL spatial computing. Instead of a toy heart model pulsing with uniform scaling, we engineered true anatomical biomechanics: during ventricular systole, the apex undergoes a counter-clockwise torsional wring of approximately 12 degrees drawing towards the base, followed by rapid elastic diastolic recoil. As patient data enters the engine, the 3D coronary arteries dynamically interpolate across a clinical color gradient: Patent Green (under 30%), Borderline Amber (30% to 69%), and Critical Red (70% and above). We placed luminescent blood flow particles inside the coronary vessels. When a vessel enters high-grade stenosis, flow velocity drops by 65%, visually demonstrating ischemic hypoperfusion. At the same time, physical atheroma plaques bulge and pulsing constriction rings appear at the lesion site. Users can switch between Bio-Realistic Anatomy, a glowing Cyber-Neon Hologram, and X-Ray Fluoroscopy, complete with rotating biosensor HUD scan rings and synchronized acoustic heart valve audio.
Trust Through Transparency: Explainable AI We refused to build a black box that demands blind faith. Clinicians and patients need to know why a risk was assigned. We integrated SHAP (SHapley Additive exPlanations) directly into the user interface. When a patient heart turns red, the system displays an intuitive diverging waterfall chart showing red bars for specific factors elevating risk (such as ST-segment elevation, typical angina, elevated LDL) and green bars for protective factors working in their favor (such as preserved ejection fraction and normal echo). Furthermore, we expanded the diagnostic scope beyond CAD alone by creating an automated Multi-Disease Pathology Suite, alerting clinicians to concurrent threats: Acute STEMI Threat Score, Congestive Heart Failure and LV Pump Dysfunction, Cardiac Arrhythmia and Conduction Block (LBBB/RBBB), Valvular Heart Disease (Aortic/Mitral Stenosis), and Hypertensive Cardiomyopathy with Concentric LVH.
The Turning Point: Empowering Patients with 3D Exercise and Hope Most diagnostic software stops after delivering bad news. But medicine is about healing, not despair. We built the 3D Animated Cardio Exercise Lab and Angiogenesis Simulator. Inside the 3D viewport, users can switch to Exercise Lab to watch a procedural 3D biomechanical athlete perform Aerobic Jogging, Cadence Cycling, HIIT Jumping Jacks, or Vagal Restorative Yoga, displaying real-time telemetry like VO2 Max reserve and Nitric Oxide vasodilation. On the dashboard, clinicians can prescribe an exercise program, such as 12 weeks of aerobic jogging. When you click Simulate Exercise Therapy, the engine recalculates physiological adaptations: blood pressure drops by 14 mmHg, LDL clears, resting pulse slows, and ejection fraction improves. The overall CAD risk drops significantly, for example from 96.3% down to 65.4%. And in the 3D heart, glowing golden collateral micro-vessels sprout across the myocardium, visually demonstrating how sustained cardiovascular exercise stimulates natural bypass vessels (angiogenesis) to restore blood flow to starved heart muscle.
The Vision: Next-Generation Preventative Cardiology CardioTwin 3D turns what used to be a terrifying, abstract medical diagnosis into an intuitive, interactive, and hopeful educational journey. For cardiologists, it is a fast, leakage-free diagnostic companion that visualizes multi-vessel stenosis risks and explains feature contributions before catheterization. For patients, it is a transformative bio-feedback tool. Seeing their own digital heart turn from red to green and watching collateral vessels sprout gives patients an emotional, visceral reason to take their health seriously. For global health, it is an open-web, zero-GPU-overhead platform accessible on any standard laptop or phone, democratizing advanced cardiac digital twins across the world. From raw clinical numbers to a living, beating, and healing 3D digital twin, CardioTwin 3D is redefining how we visualize, predict, and prevent cardiovascular disease.
Built With
- 3d-visualization
- css3
- data-visualization
- healthcare
- html5
- javascript
- react
- three.js
- typescript
- webgl

Log in or sign up for Devpost to join the conversation.