-
-
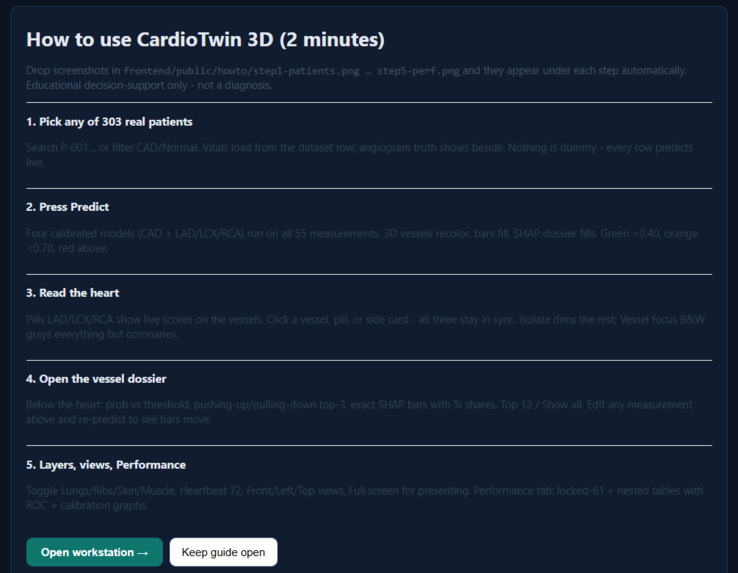
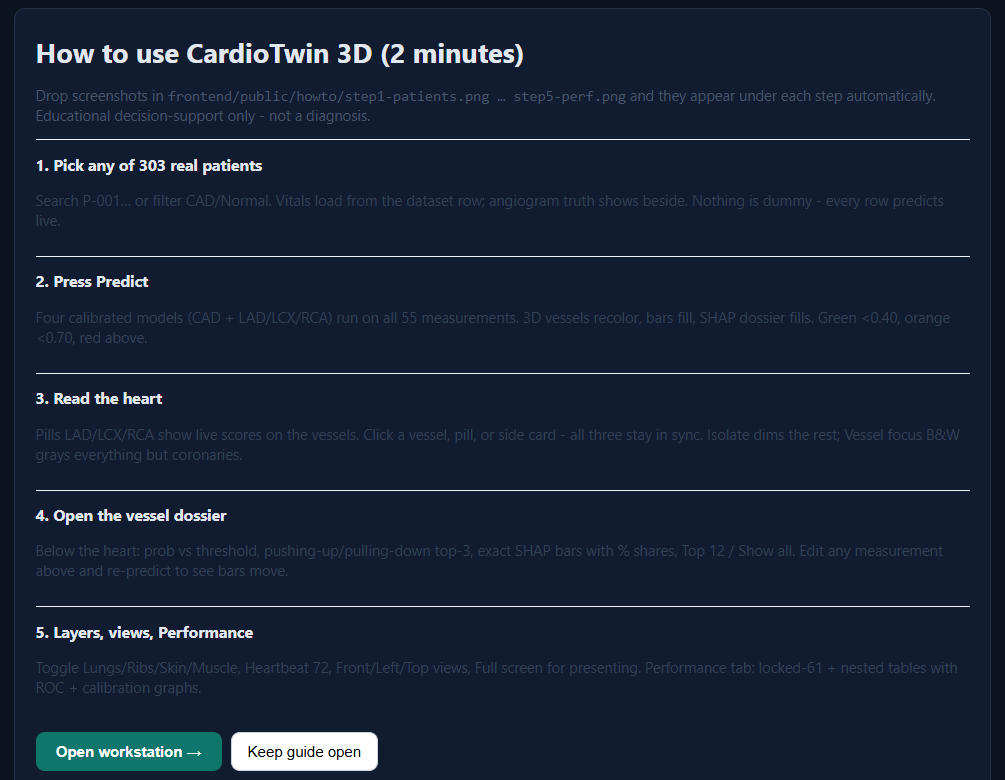
First-run 2-minute guide with screenshot slots; workstation remembers the choice.
-
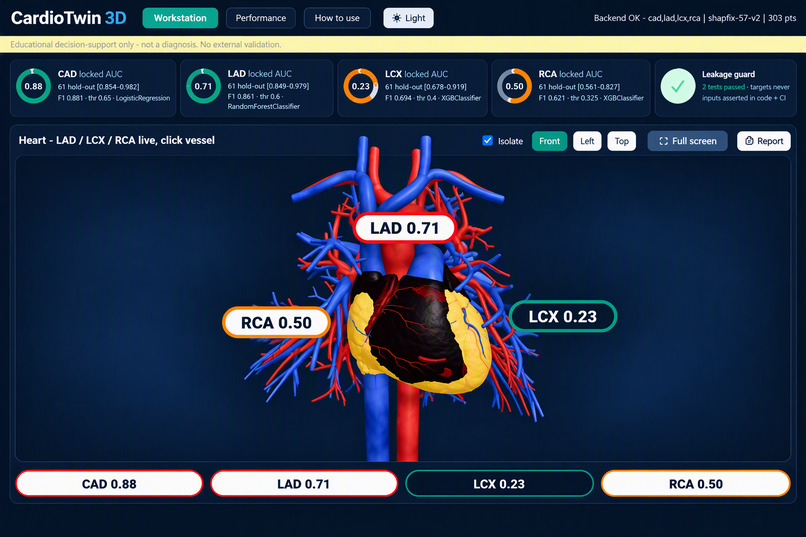
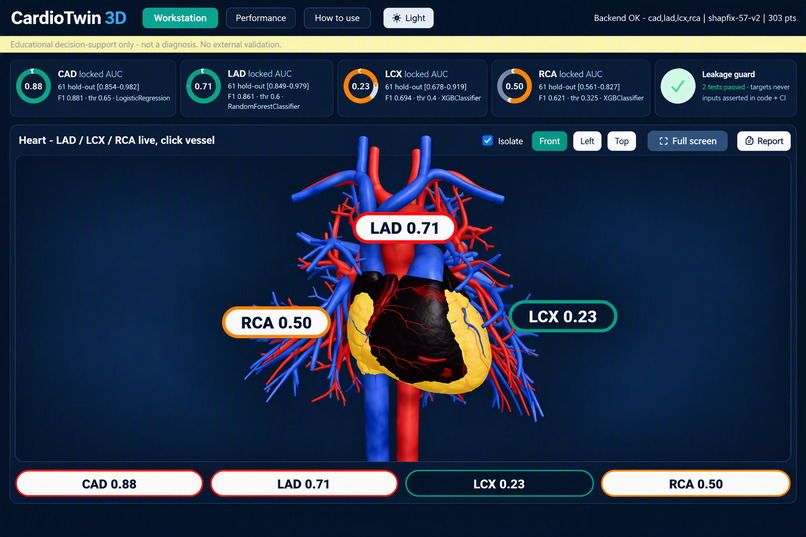
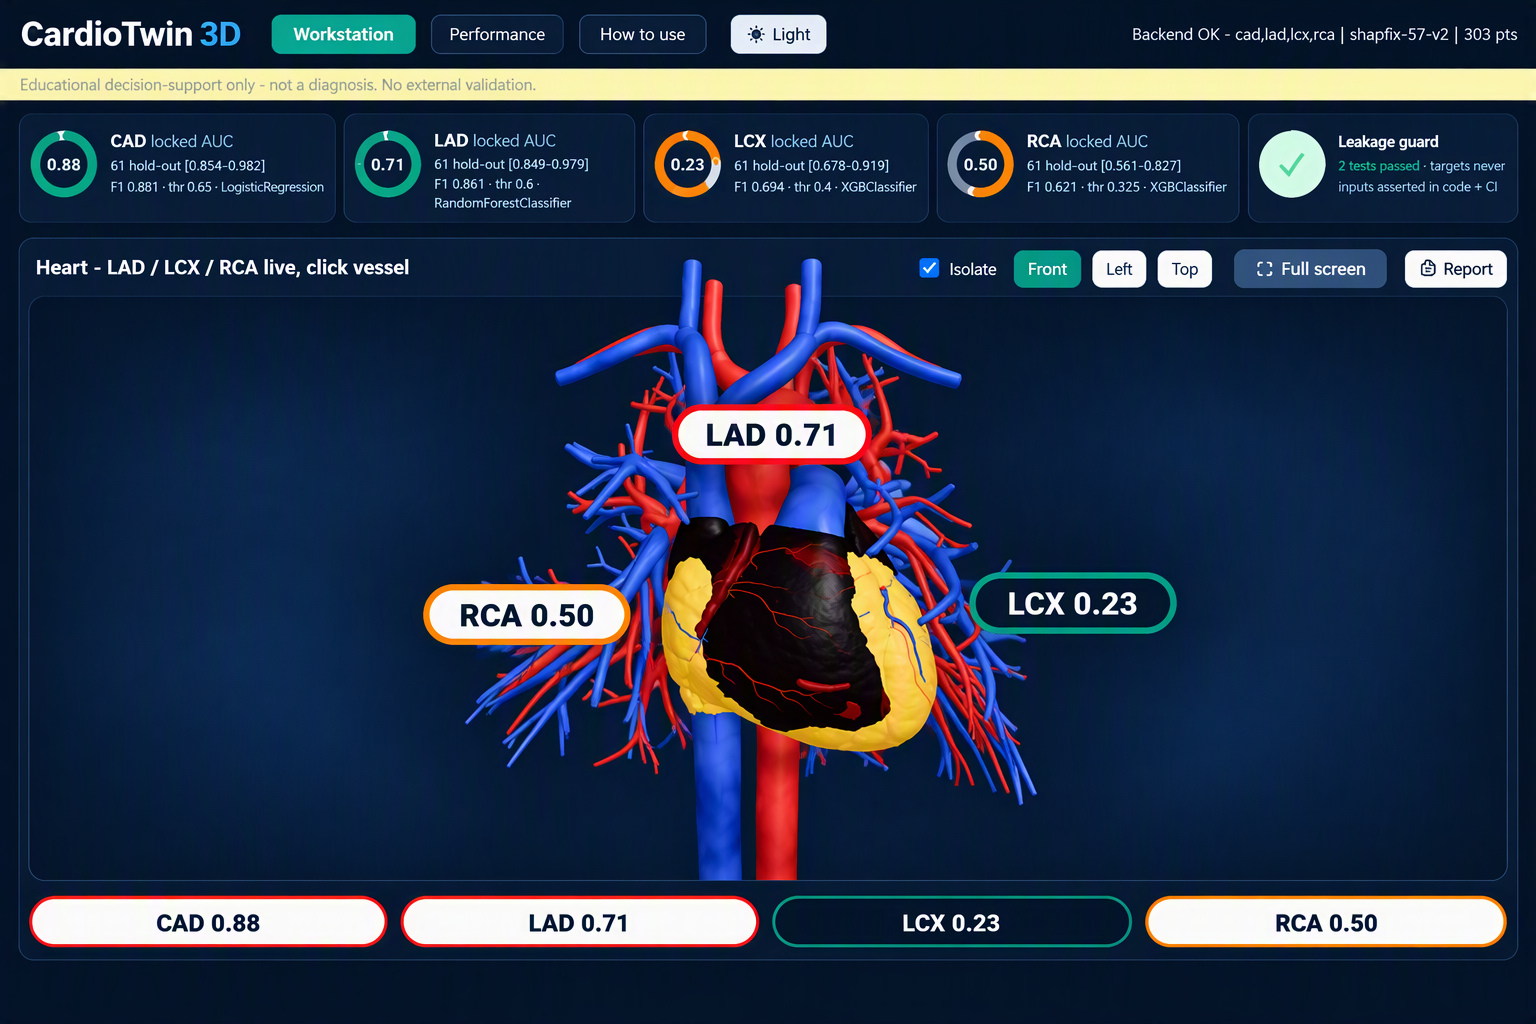
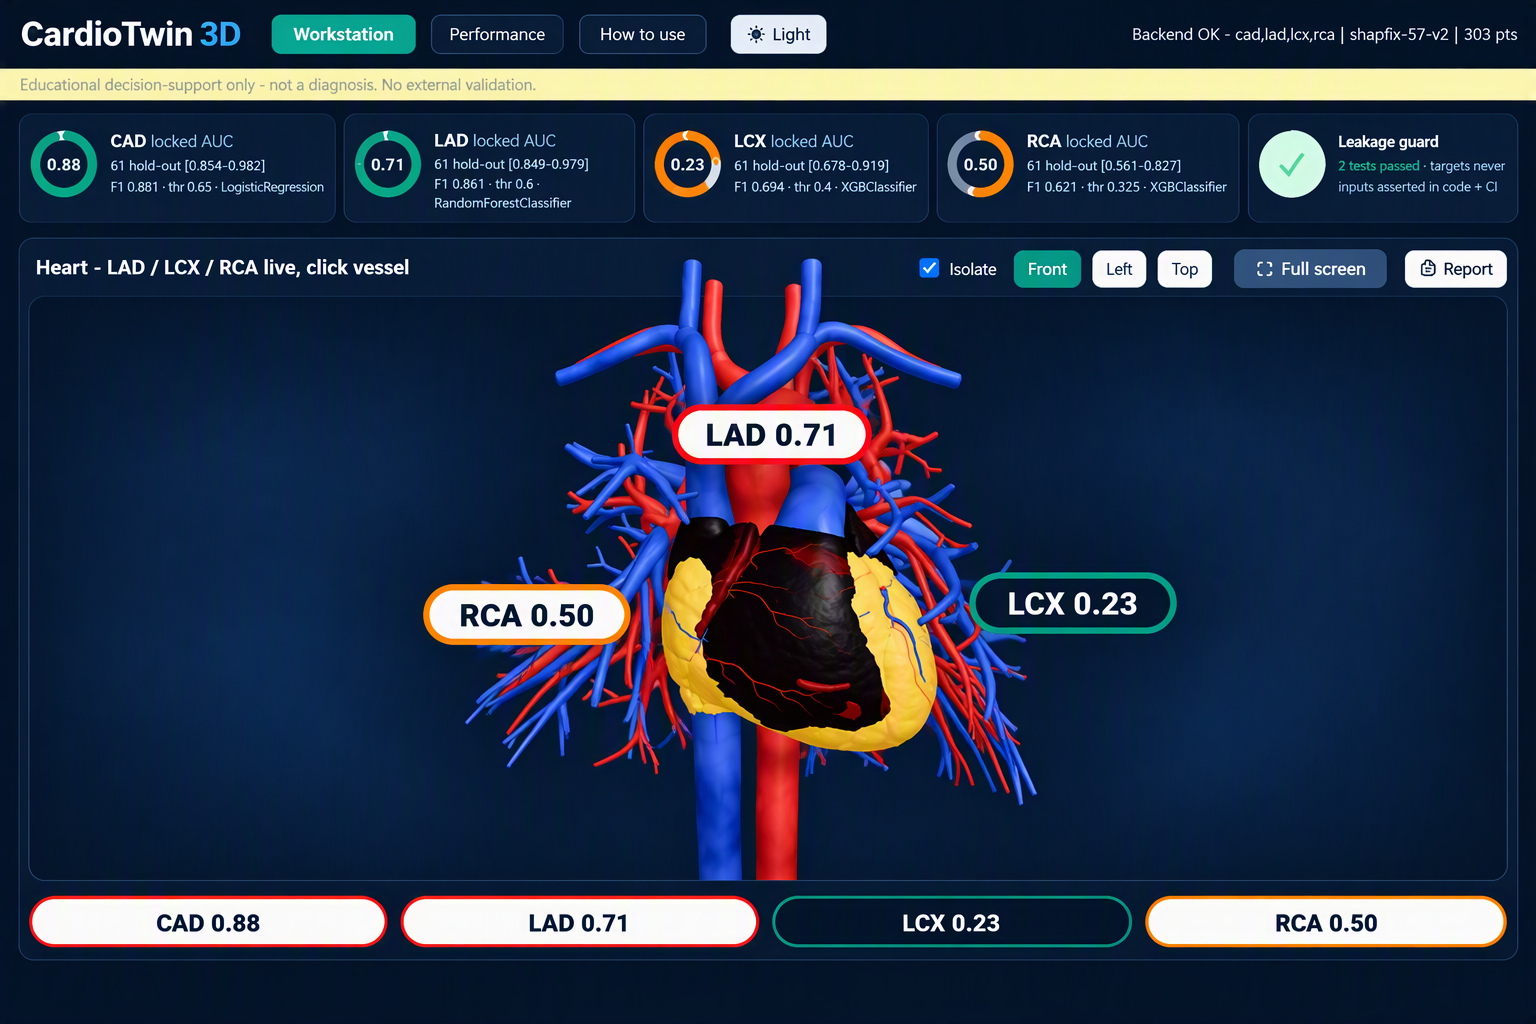
Full workstation - locked-test KPI rings, live 3D heart with pinned LAD/LCX/RCA scores, P-001 predicted CAD 0.83 matching angiogram.
-
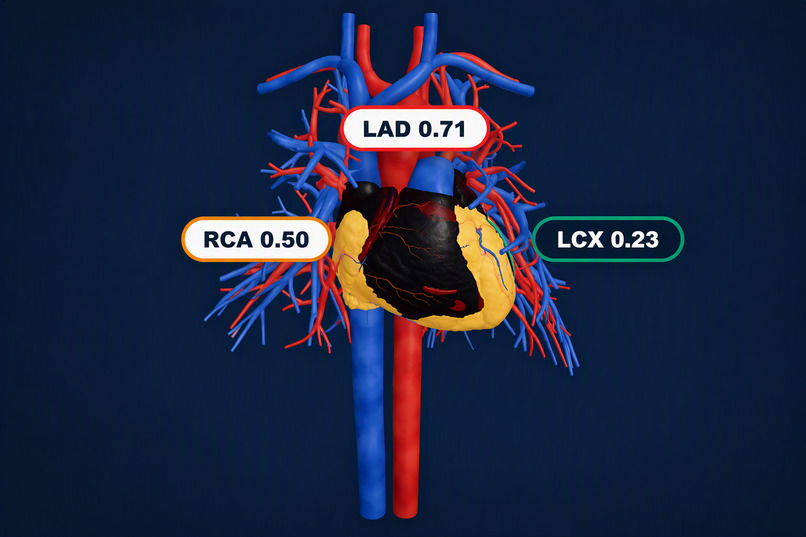
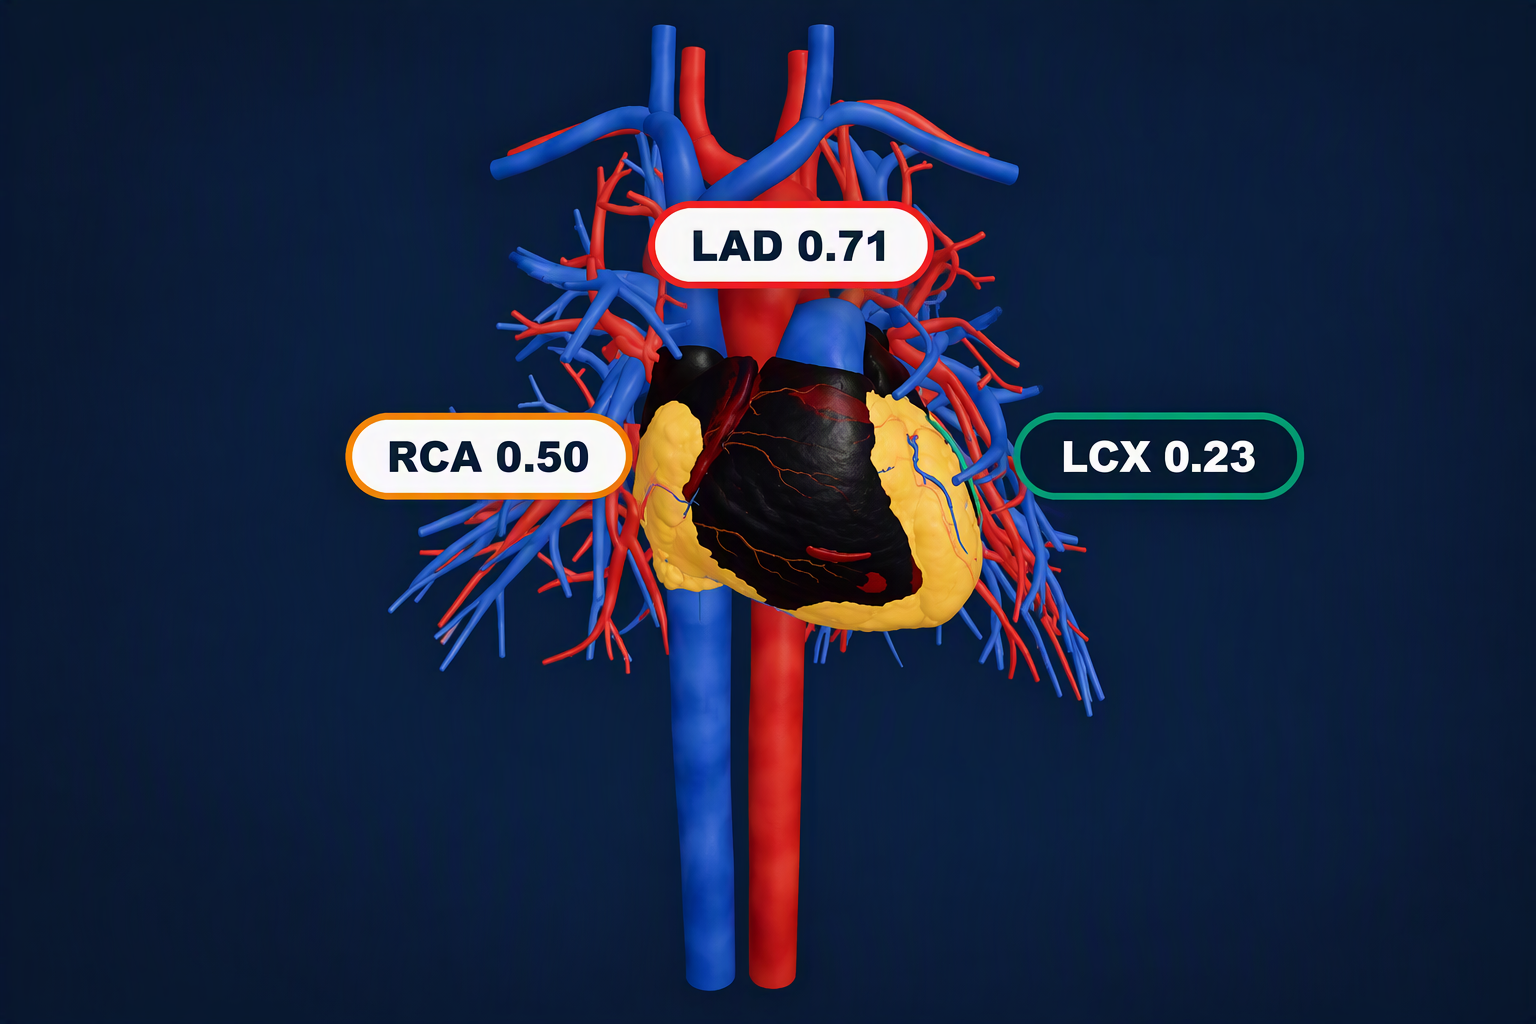
Segmented coronaries colored by live risk - LAD 0.71 high, RCA 0.50 moderate, LCX 0.23 low . Click any pill, vessel, or card.
-
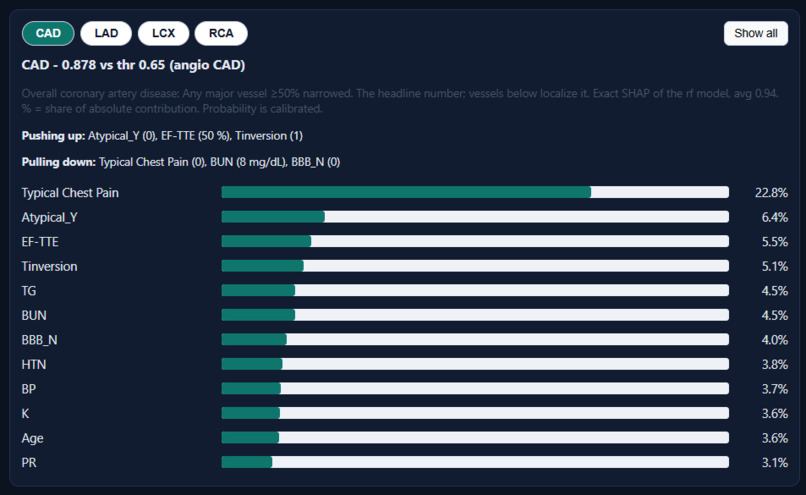
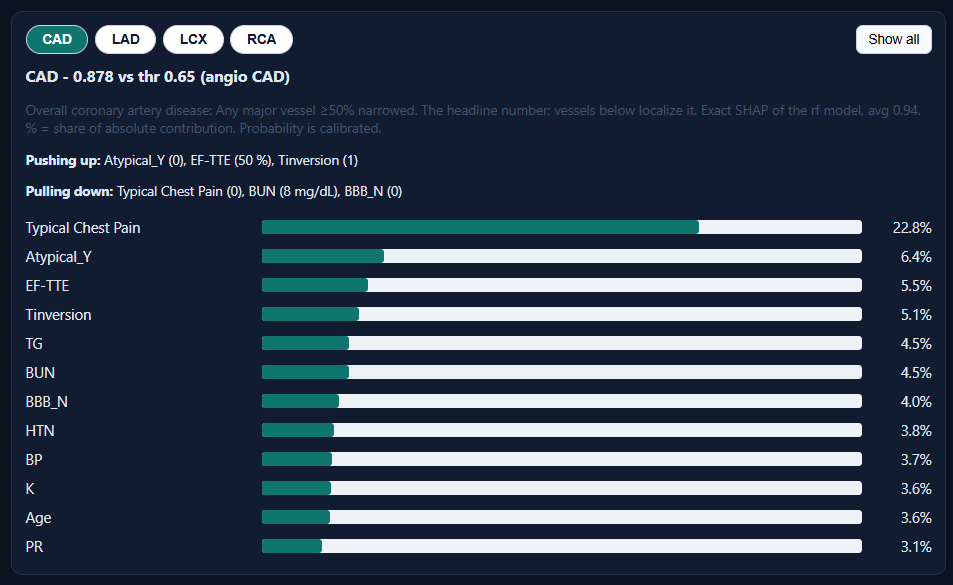
Overall CAD dossier 0.878 vs 0.65 threshold - exact SHAP bars with % shares; typical chest pain drives +22.8%
-
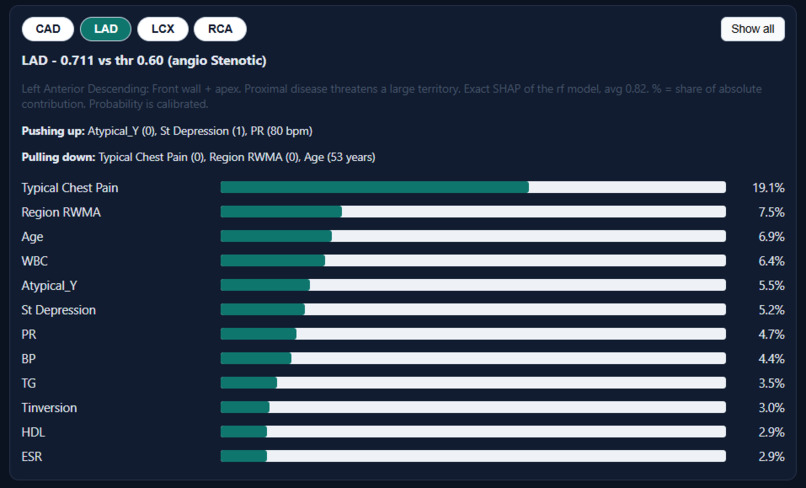
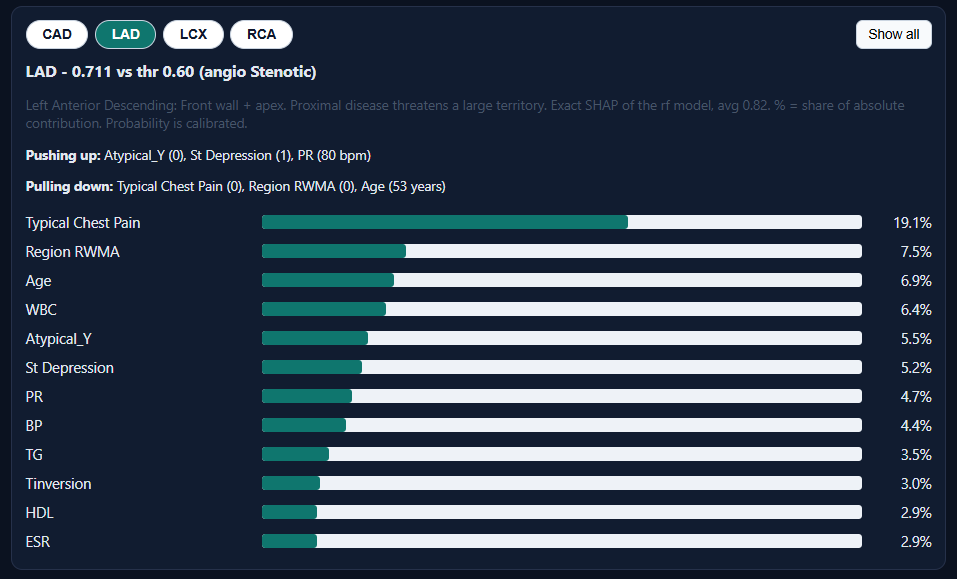
LAD 0.711 vs 0.60 - pushing up: atypical markers and ST depression; pulling down: no typical pain, normal wall motion
-
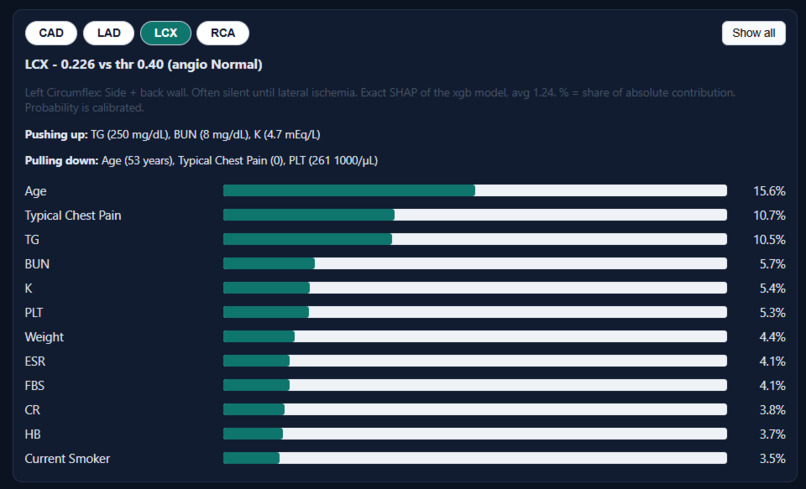
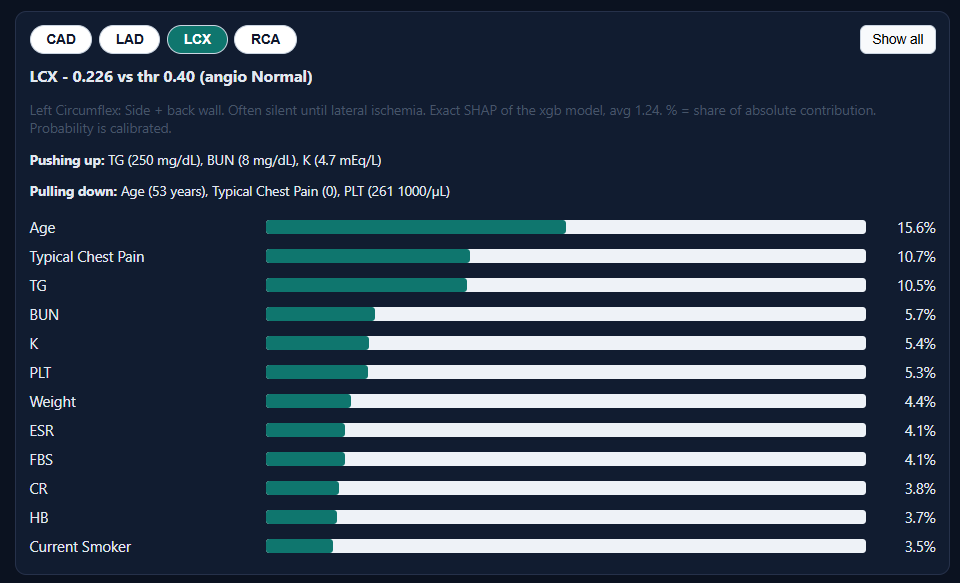
LCX 0.226 vs 0.40 - correctly below threshold, matching Normal angiogram; age and chest pain still contribute.
-
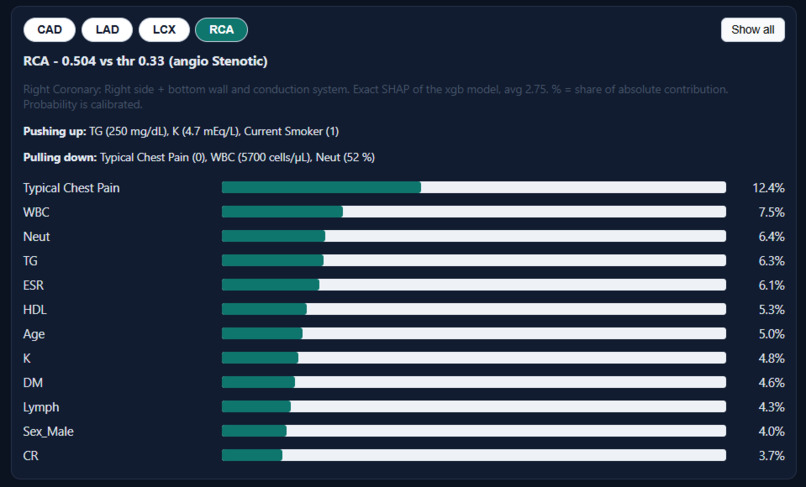
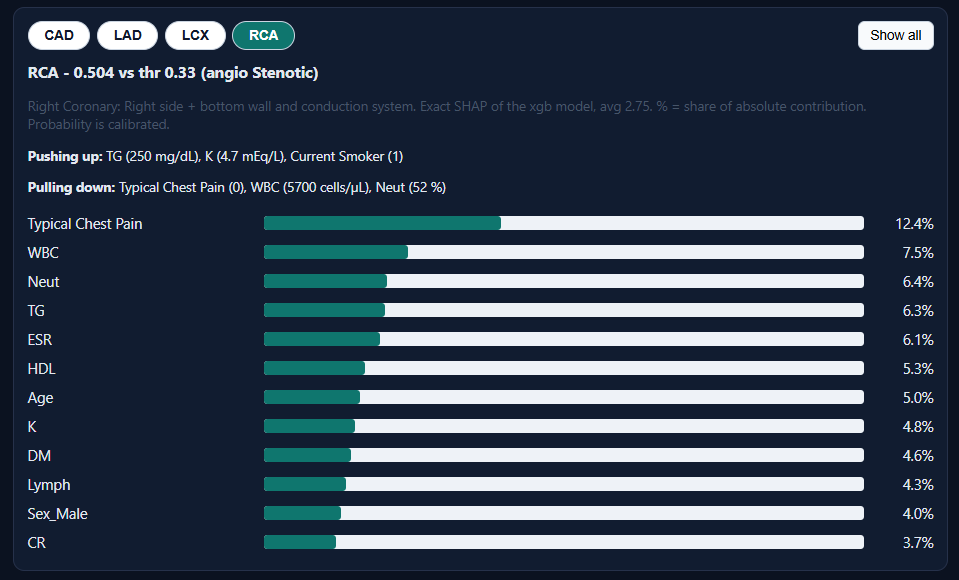
RCA 0.504 vs 0.33 - moderate flag matching Stenotic label; TG and smoking push up, chest-pain absence pulls down.
-
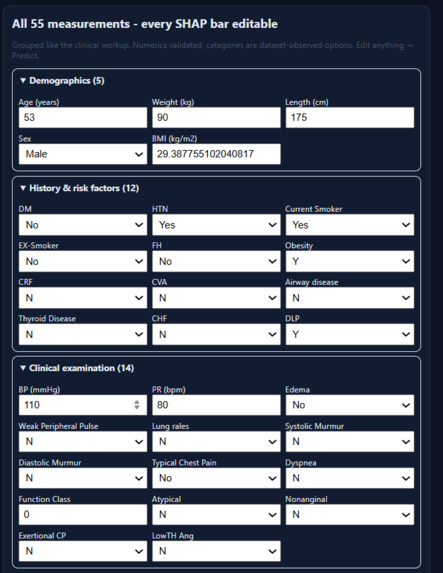
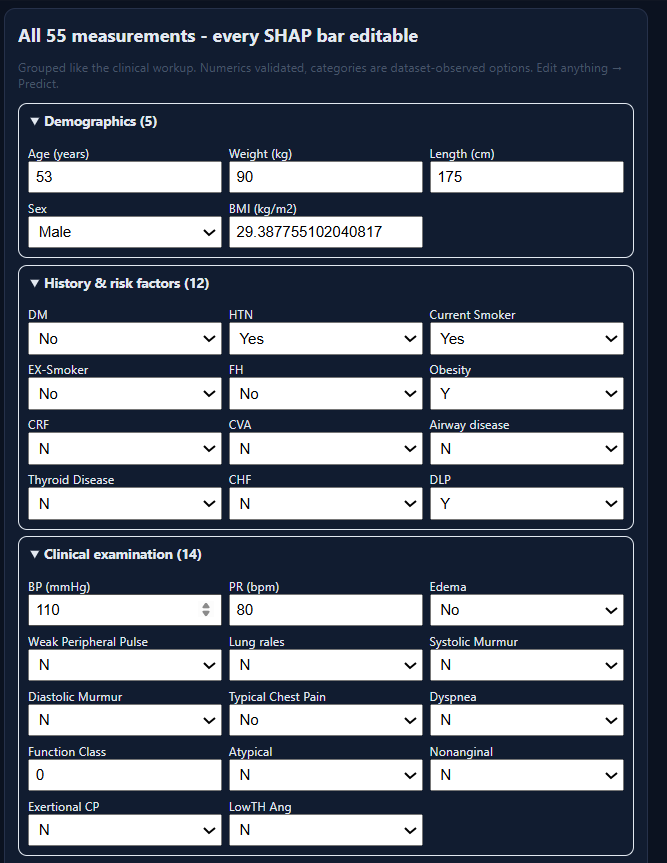
All 55 measurements in clinical groups - numerics validated, categories limited to dataset-observed options, every SHAP bar editable.
-
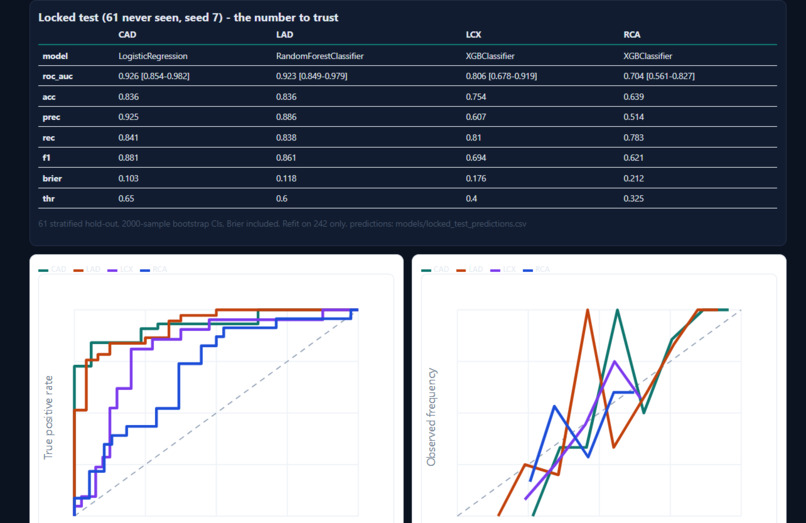
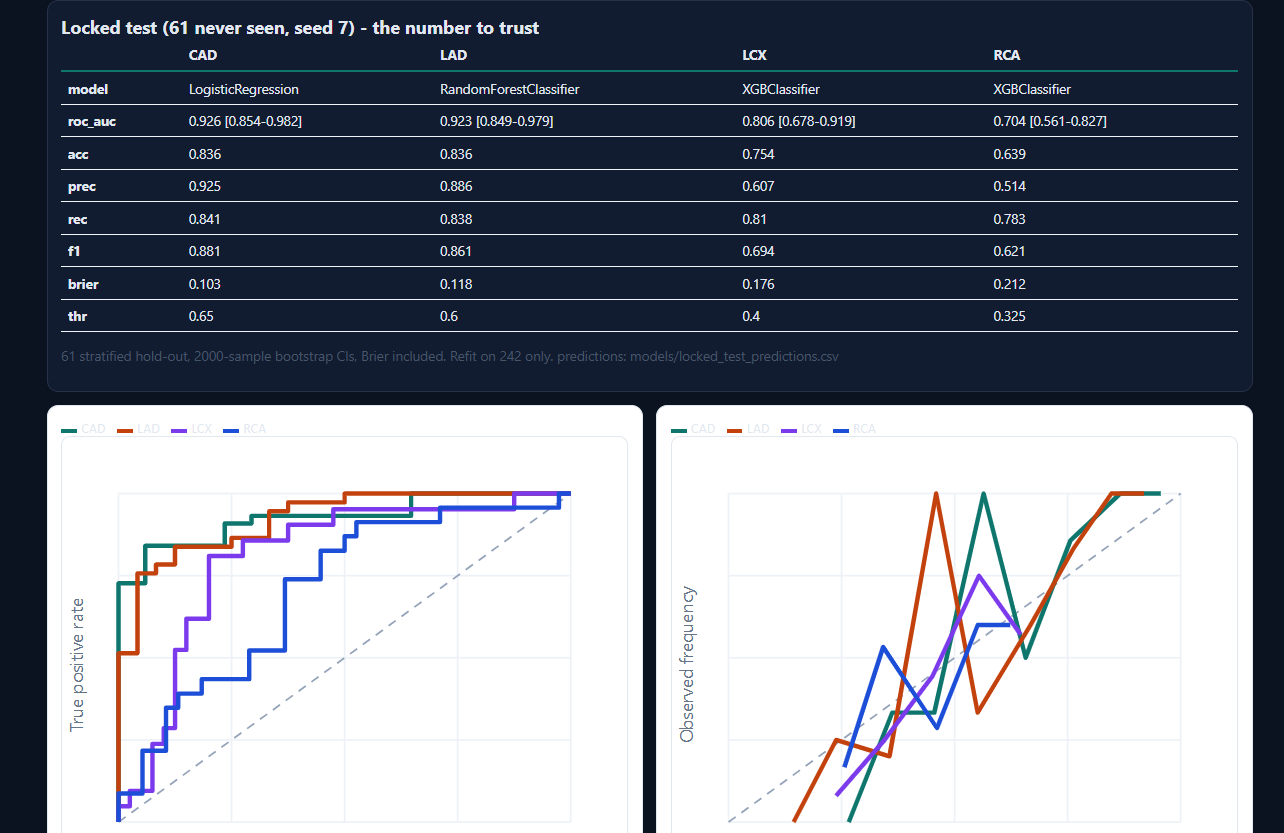
Locked 61-patient test: CAD , LAD with bootstrap CIs and Brier; live ROC and calibration drawn from committed per-patient predictions.
-
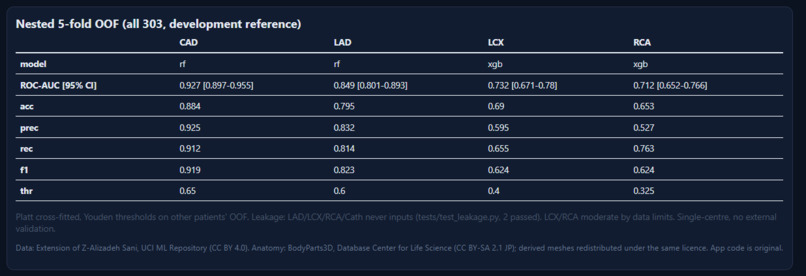
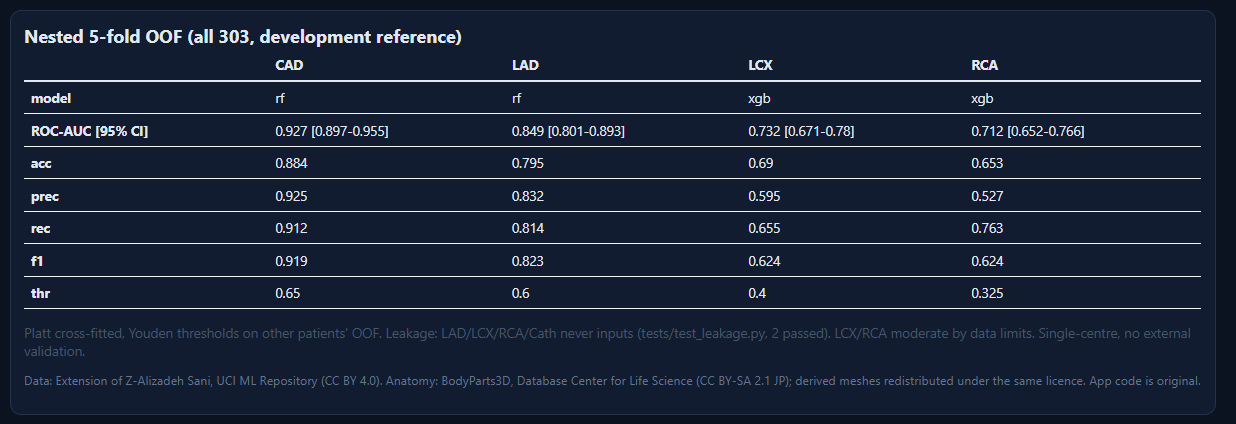
Nested 5-fold reference over all 303 plus required data/anatomy attribution; LCX/RCA limits stated openly.
-
Inspiration
One-number risk scores can't show where heart disease lives. We map it artery by artery, with reasons.
What it does
CardioTwin 3D predicts CAD + LAD/LCX/RCA stenosis from 55 routine measurements, paints each probability onto segmented 3D coronaries, and explains every prediction with exact SHAP dossiers. All 303 patients work live, with vessel-focus B&W, condition painting, fullscreen, dark theme, and a Performance tab with locked-test ROC/calibration.
How we built it
Nested-CV model selection (logistic/RF/XGBoost) + Platt calibration, locked 61-patient test: CAD AUC 0.926, LAD 0.923. React Three Fiber + FastAPI single URL, UI on Cloudflare Pages, API on Render.
Challenges we ran into
Small n=303 with honest wide CIs, weak LCX/RCA signal (disclosed, not hidden), leakage-proof pipelines with unit tests, and 3D label overlap.
Accomplishments that we're proud of
Locked-test evidence with per-patient predictions CSV, 2 leakage tests green, full-55 editable form, original B&W focus mode - built in 7 days.
What we learned
Thresholds and calibration matter more than raw AUC, and stated limits build judge trust.
What's next for CardioTwin 3D - Vessel-Level Coronary Risk Mapping
External validation with recalibration, lesion-level labels from imaging, on-device export for fully offline use.
Built With
- cloudflare-pages
- fastapi
- python
- react
- render
- scikit-learn
- shap
- three.js
- vite
- xgboost


