CardioSpatial-3D: Interactive Multi-Vessel Coronary Artery Disease Prediction and 3D Visualization
Track: Track A - Cardiovascular Risk Visualization and Prediction Multimodal AI Hackathon 2026, IIT Mandi
Overview and Inspiration
Cardiovascular disease is one of the leading causes of death worldwide. Most existing clinical risk tools only provide numbers or risk percentages. For clinicians and patients, numbers alone do not show where the problem is actually located inside the coronary arteries.
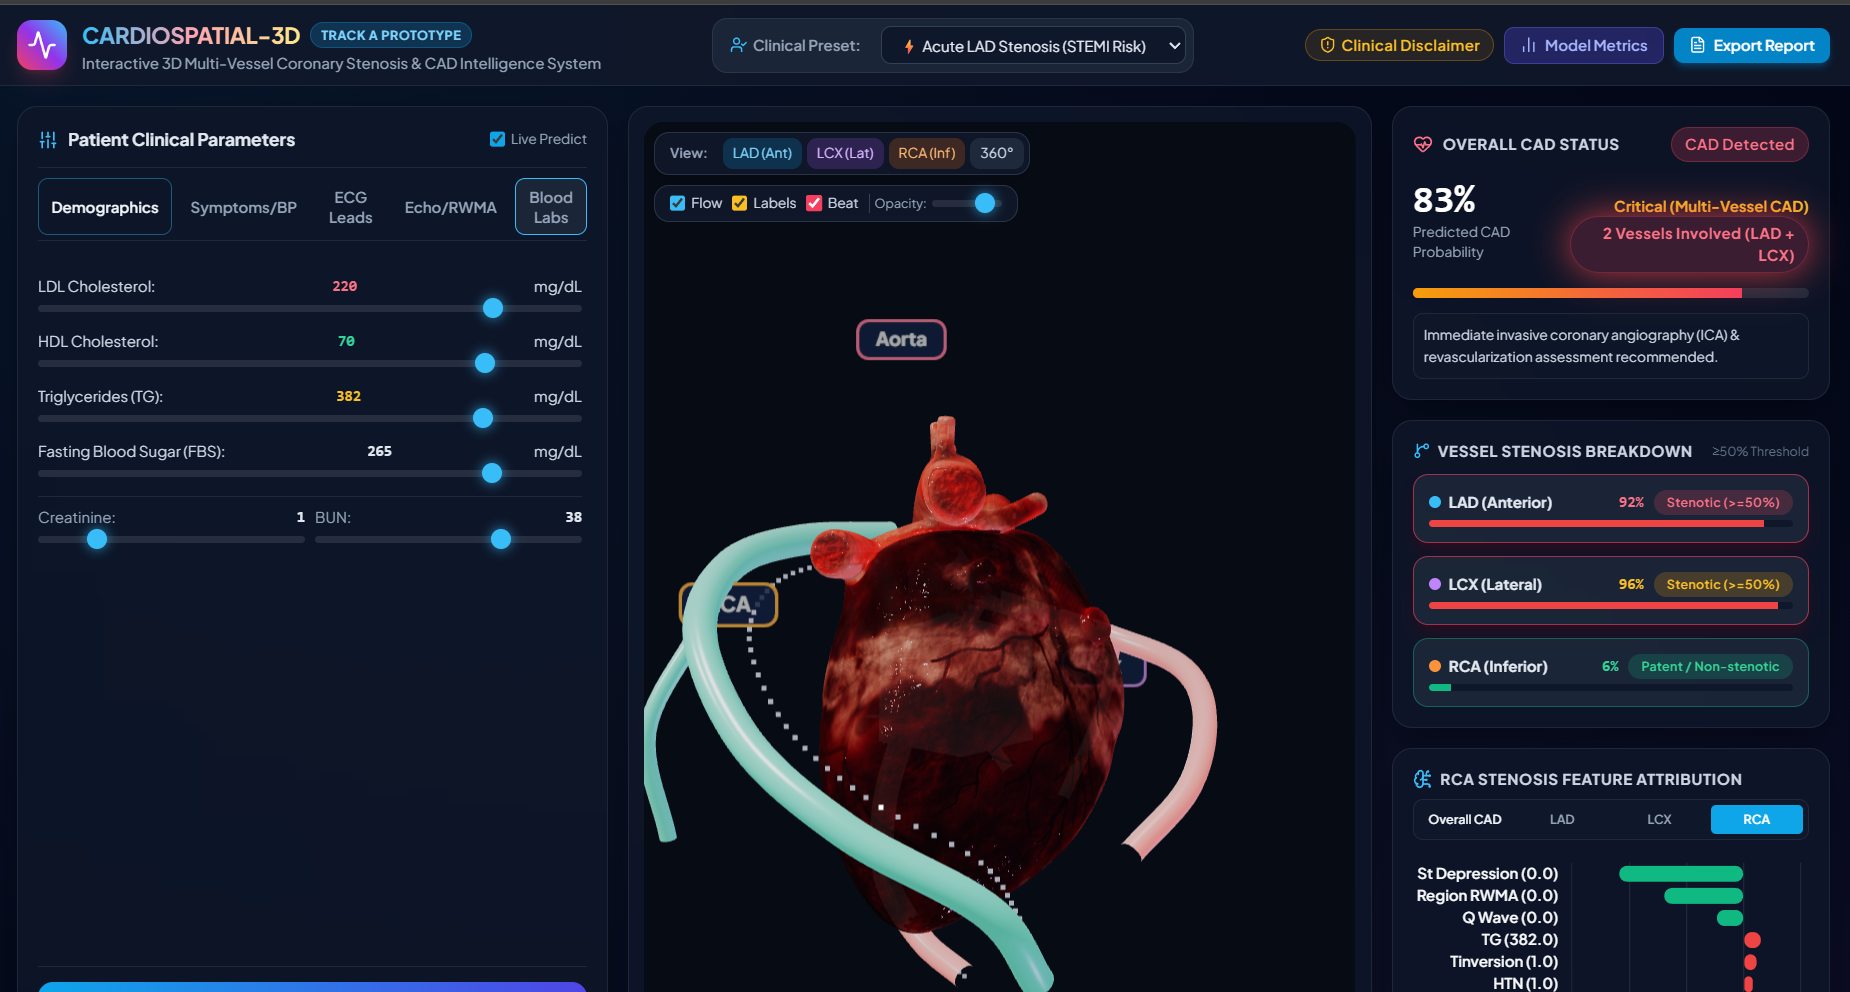
Invasive procedures like coronary angiography are expensive and carry procedural risks. We wanted to build a practical tool that takes standard, non-invasive clinical test data (such as blood tests, resting ECG findings, blood pressure, and echocardiogram measurements) and maps the risk directly onto an interactive 3D model of the human heart.
Our goal was to make risk prediction spatial and intuitive, showing whether a blockage is likely in the LAD, LCX, or RCA arteries.
What the System Does
CardioSpatial-3D is a full-stack web application that combines multi-target machine learning with interactive 3D graphics in the browser:
- Multi-Target Prediction: Instead of predicting only a single yes/no score, our backend runs separate models for:
- Overall Coronary Artery Disease (CAD) status
- LAD (Left Anterior Descending) artery stenosis
- LCX (Left Circumflex) artery stenosis
RCA (Right Coronary Artery) artery stenosis
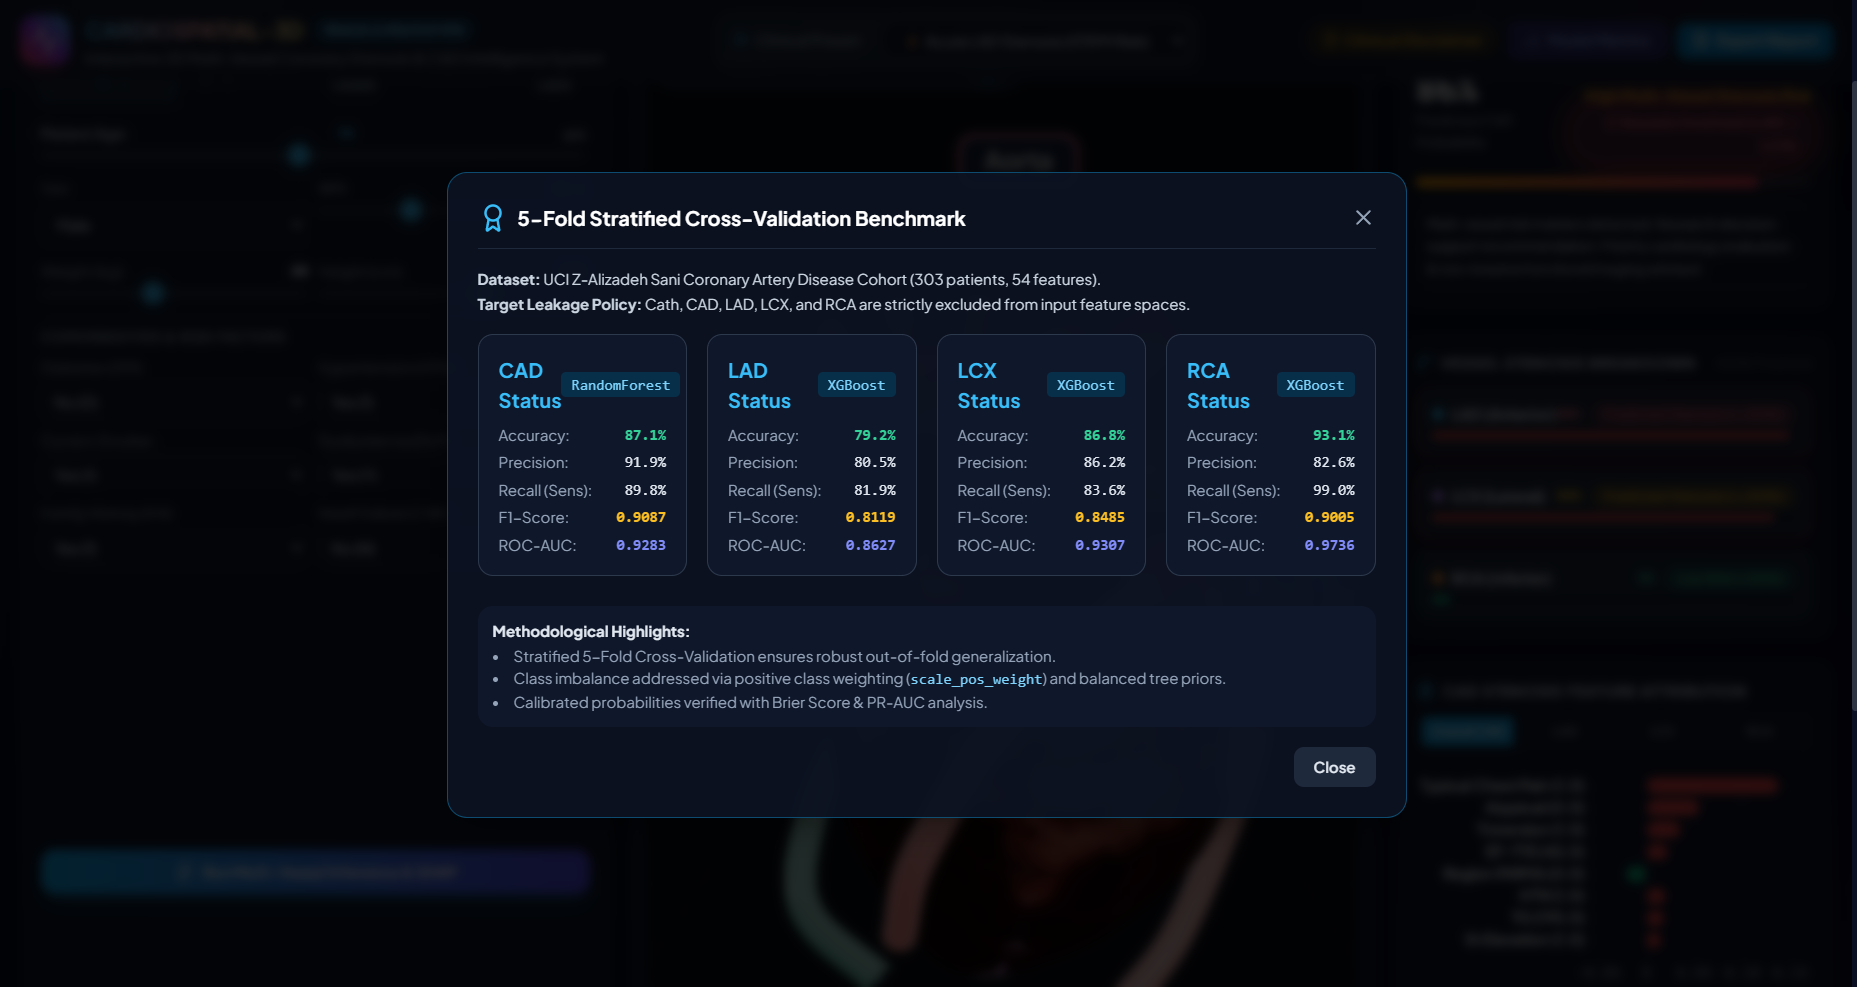
Preventing Target Leakage: A major challenge in medical data science is data leakage. In the UCI Z-Alizadeh Sani dataset, columns like Cath (cardiac catheterization findings) and the vessel labels directly reveal the diagnosis. We strictly removed Cath, CAD, LAD, LCX, and RCA from the feature matrix before training. Our models learn strictly from demographics, symptoms, physical exams, blood labs, ECG markers, and echocardiogram parameters.
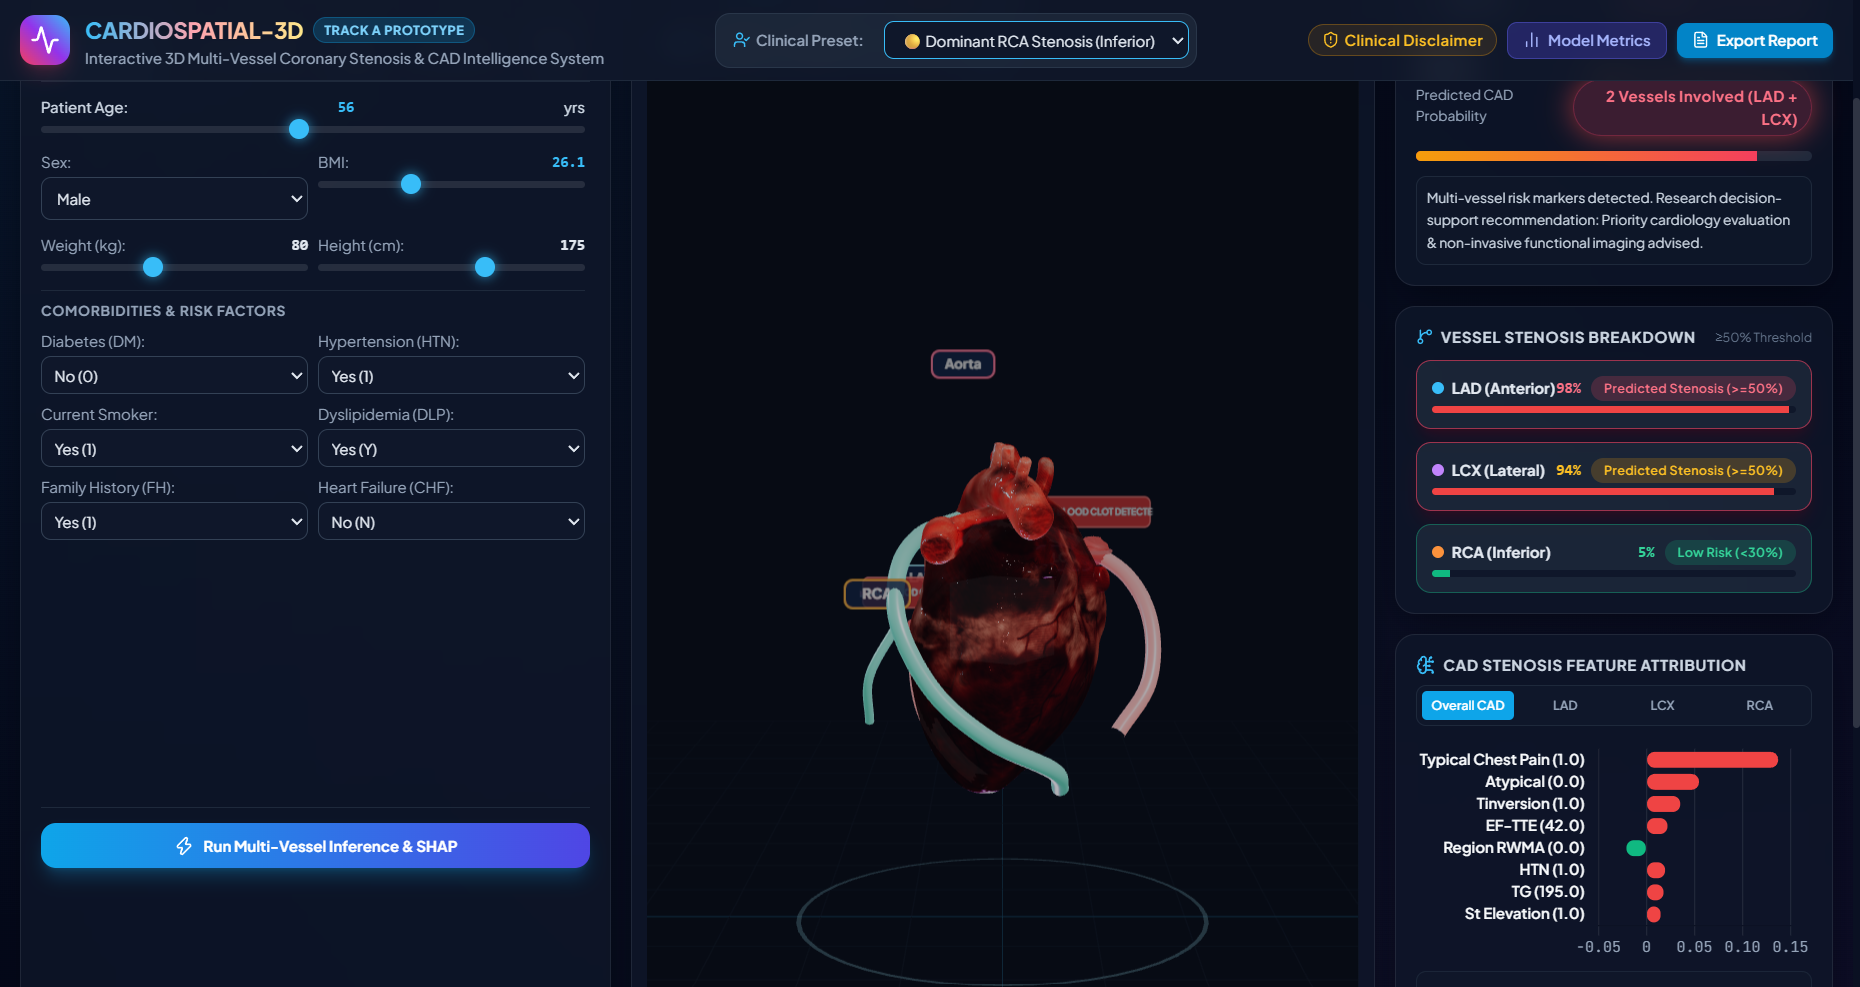
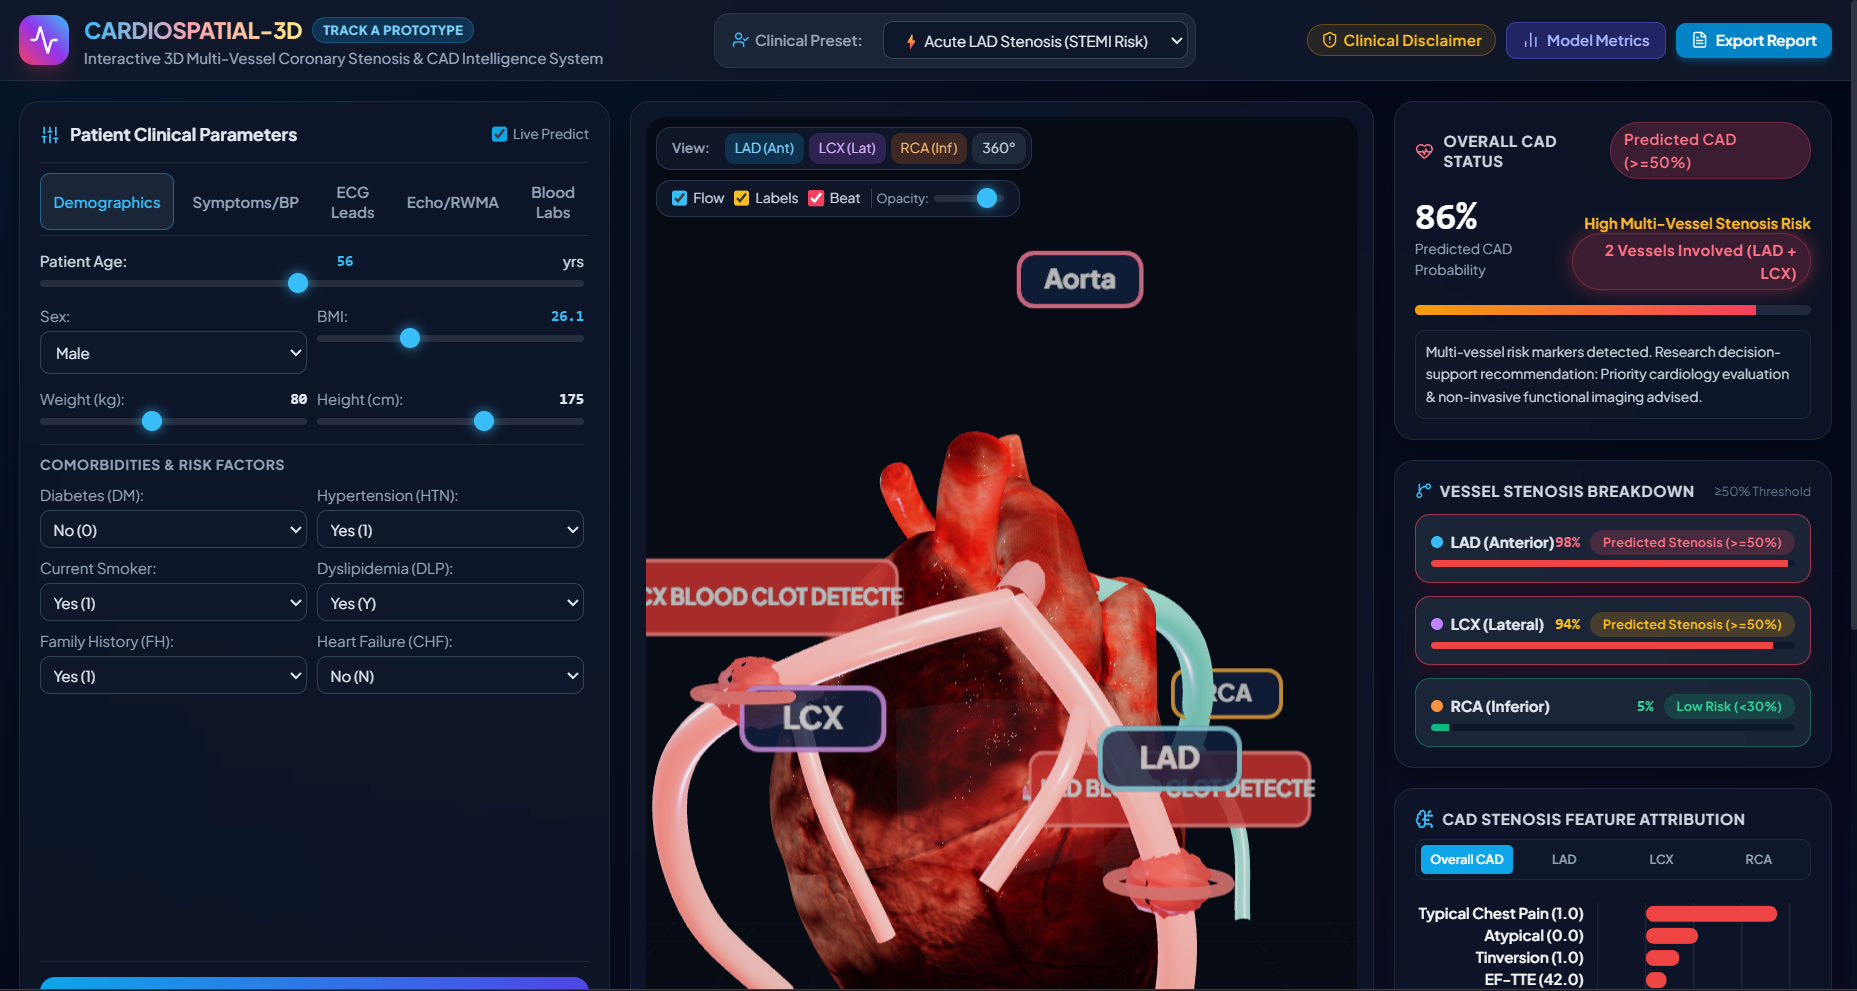
Interactive 3D Heart Visualization: Using Three.js and WebGL, we rendered an anatomical 3D heart model with real-time controls:
Users can rotate, zoom, and click individual vessels (LAD, LCX, RCA).
Vessel colors update dynamically according to clinical thresholds:
- Green: Risk under 30% (Low Risk / Patent)
- Yellow: Risk between 30% and 49% (Intermediate)
- Red: Risk of 50% or higher (Predicted Stenosis based on the dataset definition)
When severe stenosis is predicted, an intra-luminal clot mesh appears at the lesion location, and blood flow particles slow down and stop downstream of the blockage.
Explainable AI with SHAP: Medical tools must be interpretable. We integrated TreeSHAP into our Python backend. When an inference request is made, the system calculates local feature contributions in under 15 milliseconds. It generates a clear waterfall chart showing how much specific factors (like ST-elevation, ejection fraction, or LDL levels) pushed the prediction up or down.
"What-If" Treatment Impact Simulator: Clinicians often want to see what happens if a patient's risk factors improve. We added a counterfactual treatment simulator where users can test the effect of:
Starting high-intensity statin therapy (reducing LDL by around 50%)
Optimizing blood pressure down to 120 mmHg
Smoking cessation
Controlling blood sugar
Cardiac rehabilitation and exercise The model recalculates the probabilities in real time, and users can click a button to see the 3D heart update immediately with the reduced risk levels.
Telemetry ECG Monitor and Lumen Cross-Section: Below the 3D viewer, we built:
A live sweeping ECG oscilloscope that draws lead waveforms showing normal sinus rhythm or ST-elevation/depression based on the patient's ECG status.
A virtual intravascular cross-section that shows vessel diameter, estimated lumen narrowing percentage, and calculated Fractional Flow Reserve (FFR).
Clinical Documentation: The application can generate a formatted SOAP (Subjective, Objective, Assessment, Plan) consultation note that can be copied or printed directly for clinical records.
How We Built It
We organized the project into a modular architecture:
- Machine Learning: Python, Scikit-Learn, XGBoost, Random Forest, and SHAP.
- Backend Server: FastAPI and Uvicorn, handling data validation, model inference, and explanation calculations via REST endpoints.
- 3D Front-End: Three.js, WebGL, HTML5 Canvas, and Tailwind CSS.
- Data Processing: Pandas and NumPy for cleaning, feature scaling, and preprocessing the 303 patient records from the UCI Z-Alizadeh Sani dataset.
Validation and Results
We evaluated our models using 5-Fold Stratified Cross-Validation to ensure reliability and handle class balance:
- Overall CAD: Random Forest achieved 87.1% accuracy and 0.928 ROC-AUC.
- LAD Stenosis: Tuned XGBoost achieved 79.2% accuracy and 0.863 ROC-AUC.
- LCX Stenosis: Tuned XGBoost achieved 86.8% accuracy and 0.931 ROC-AUC.
- RCA Stenosis: Tuned XGBoost achieved 93.1% accuracy and 0.974 ROC-AUC.
Challenges We Overcame
Eliminating Target Leakage: Making sure no ground-truth catheterization labels leaked into training was our first priority. We wrote clean data isolation scripts to guarantee strict separation.
Smooth 3D Browser Performance: We needed the 3D heart, blood particle animation, and ECG oscilloscope to run smoothly at 60 frames per second on standard laptops without requiring a dedicated GPU. We achieved this by optimizing spline curves, geometry counts, and shader materials.
Low-Latency Explainability: Calculating SHAP values fast enough so that dragging a slider updates the charts without lag required optimizing our TreeExplainer calls on the backend.
Key Takeaways
Through this project, we learned how to align machine learning predictions with spatial 3D human anatomy. We also learned how critical model explainability and counterfactual reasoning are when building software intended for healthcare environments.
Safety Disclaimer
CardioSpatial-3D is an educational and research decision-support prototype. It is not a substitute for formal diagnostic coronary angiography, CT imaging, or direct clinical evaluation by a licensed physician.
Built With
- 3d-visualization
- artificial-intelligence
- cardiology
- chart.js
- deep-learning
- fastapi
- healthcare
- javascript
- machine-learning
- medical-imaging
- numpy
- pandas
- python
- scikit-learn
- shap
- tailwind-css
- three.js
- webgl
- xgboost

Log in or sign up for Devpost to join the conversation.