-
-
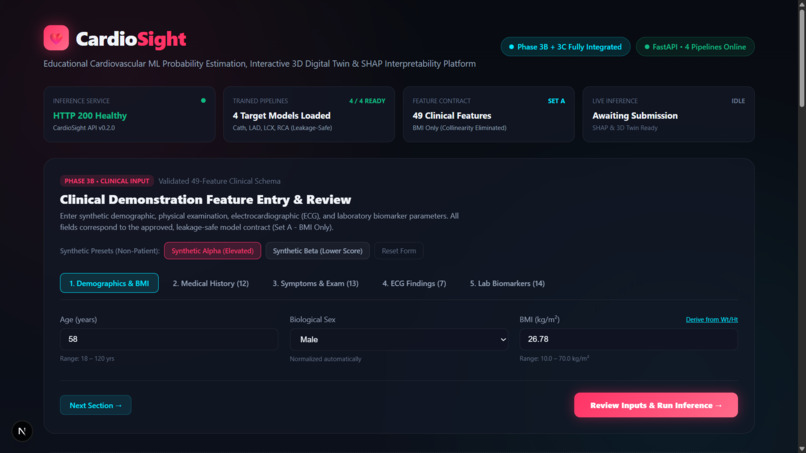
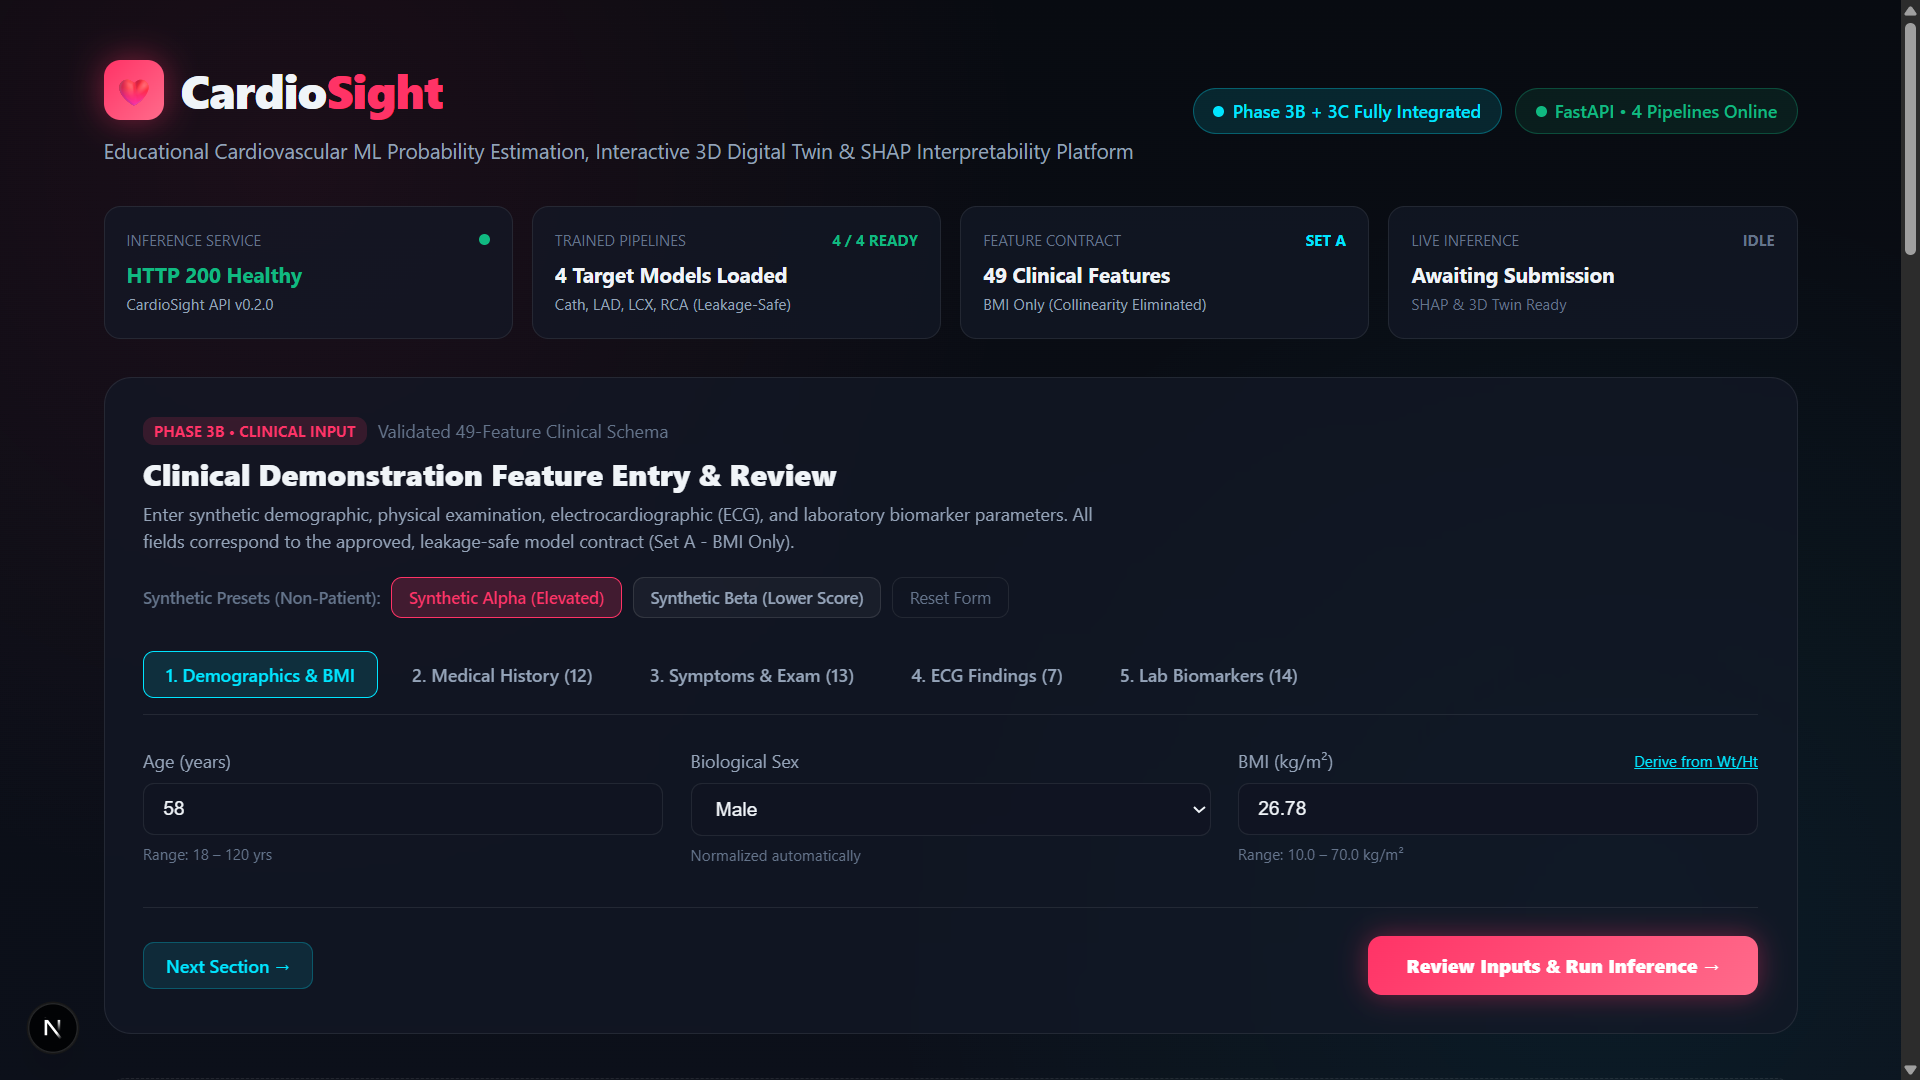
Landing page
-
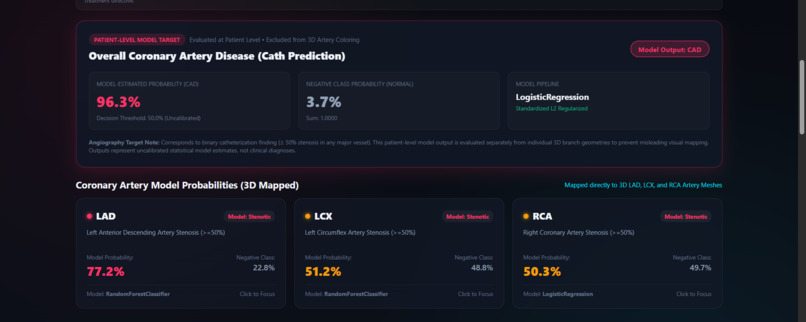
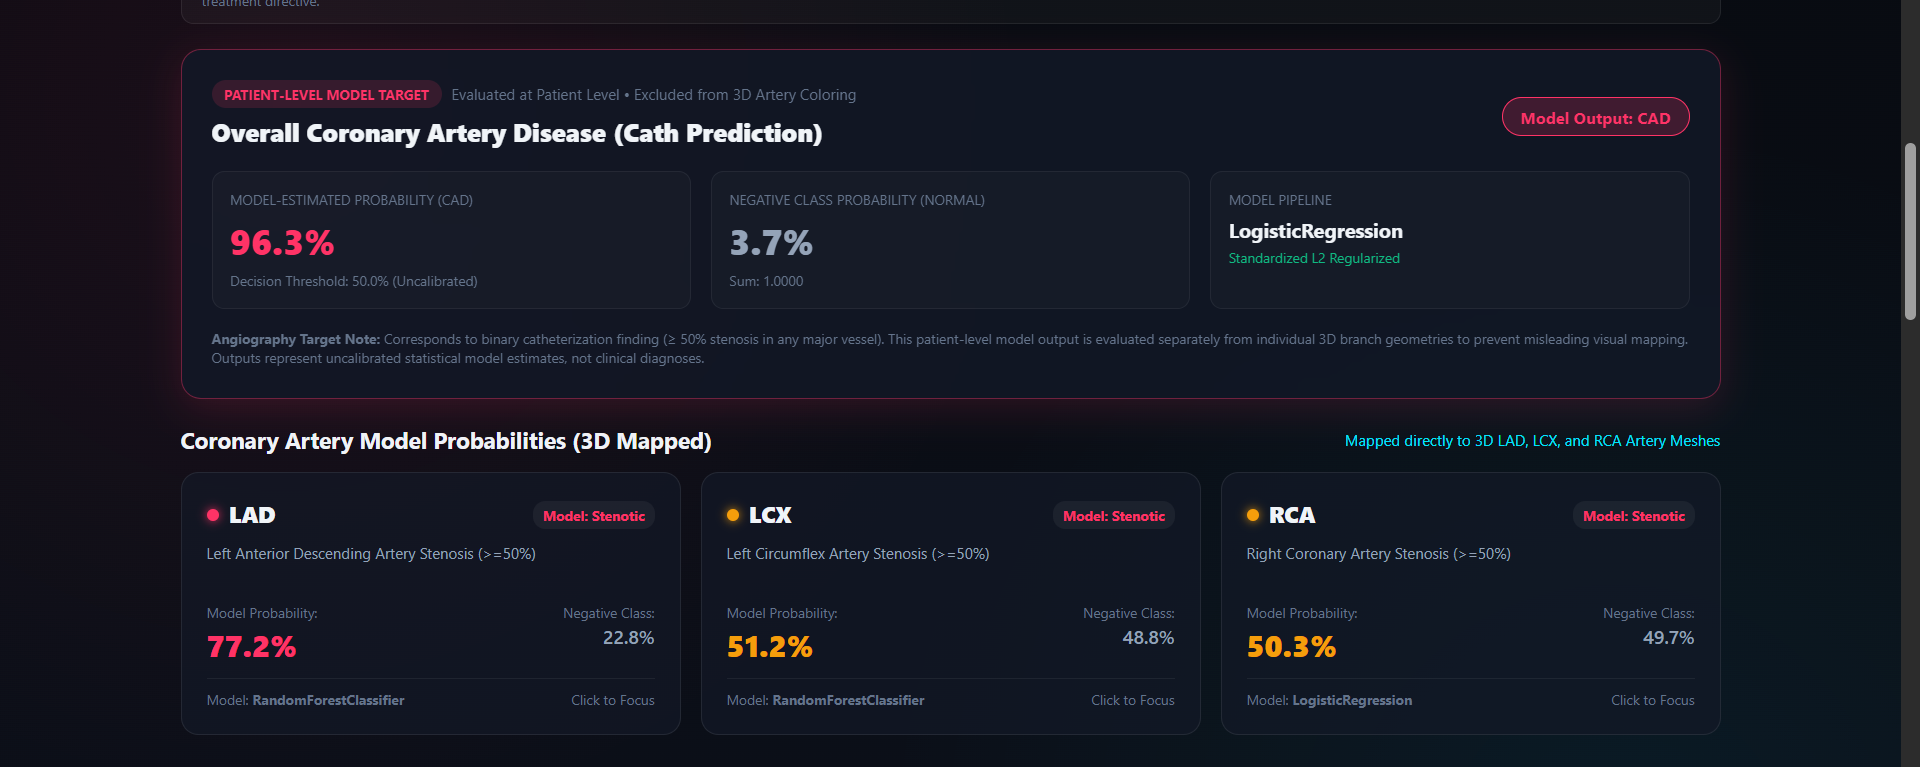
Patient level model
-
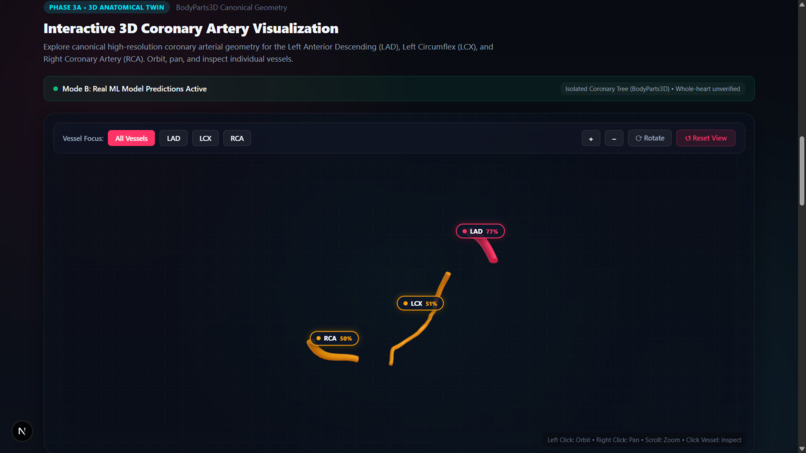
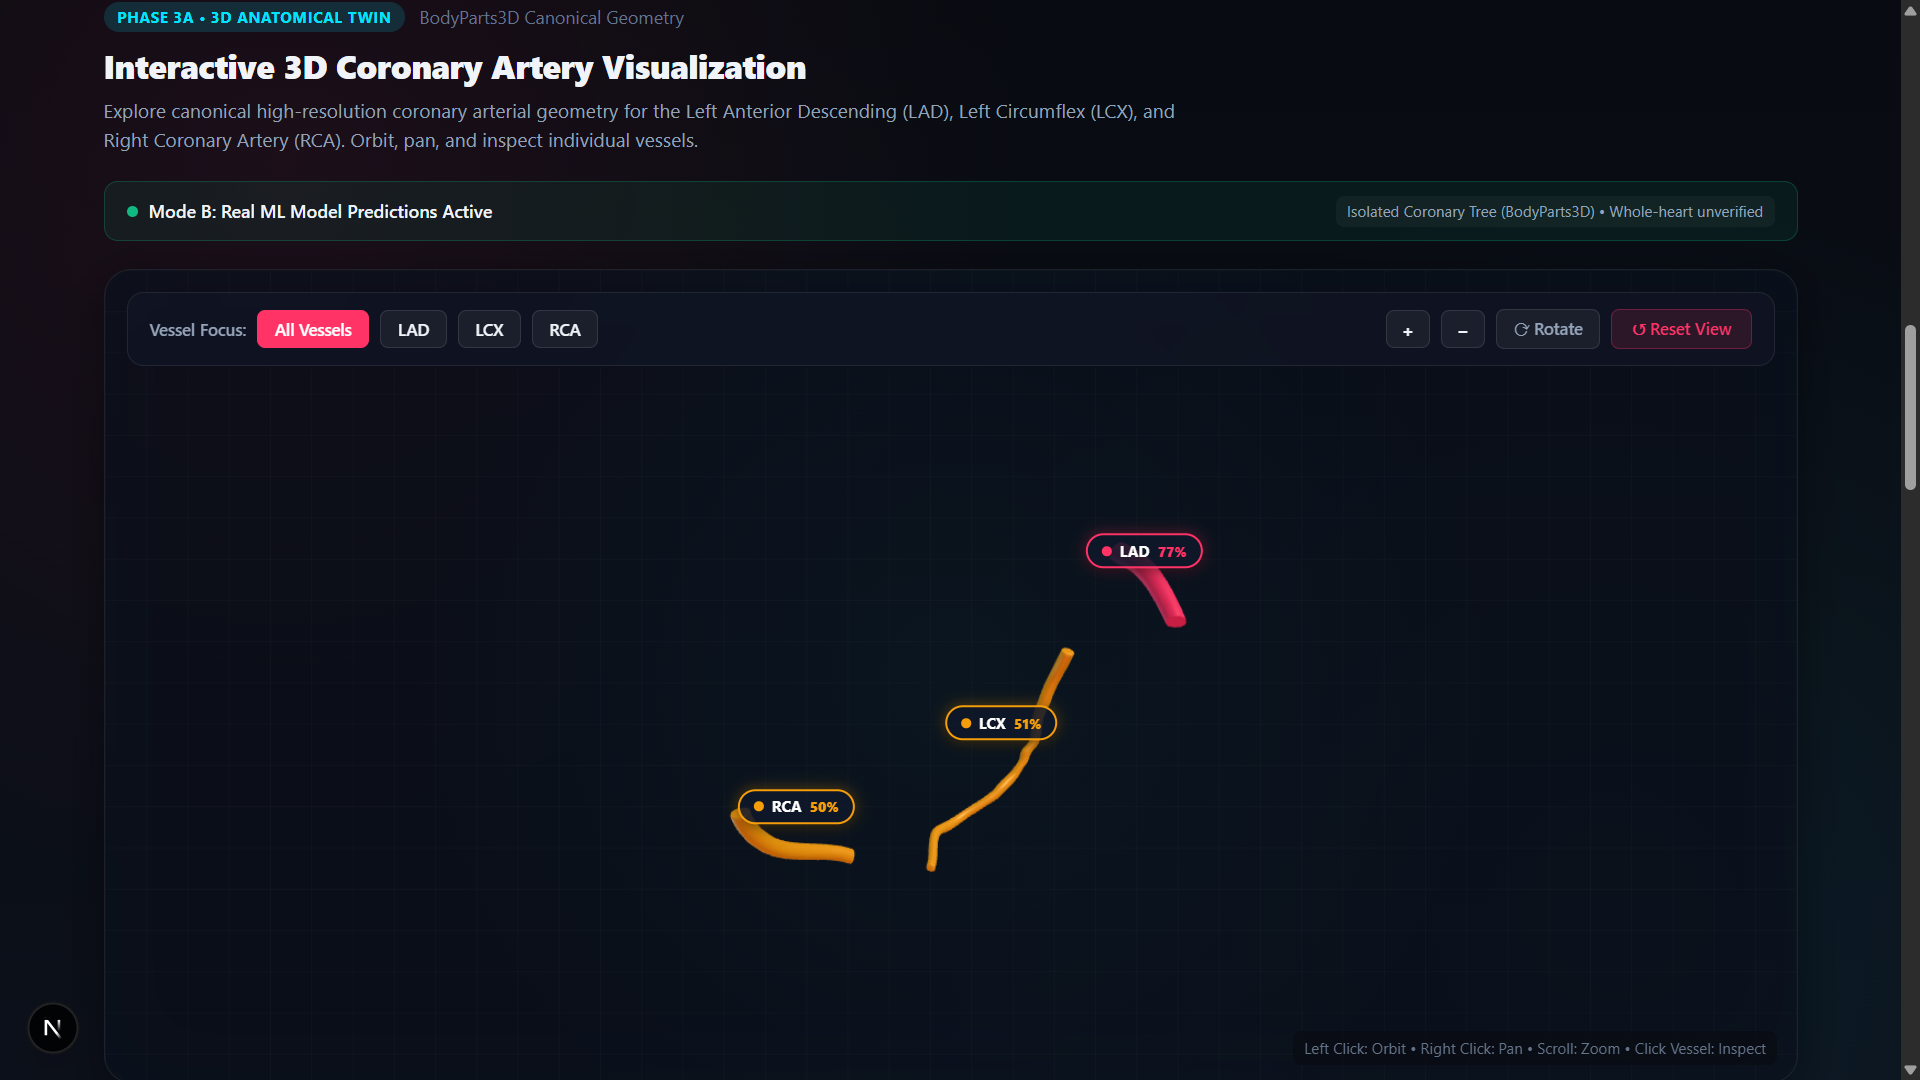
3D model
-
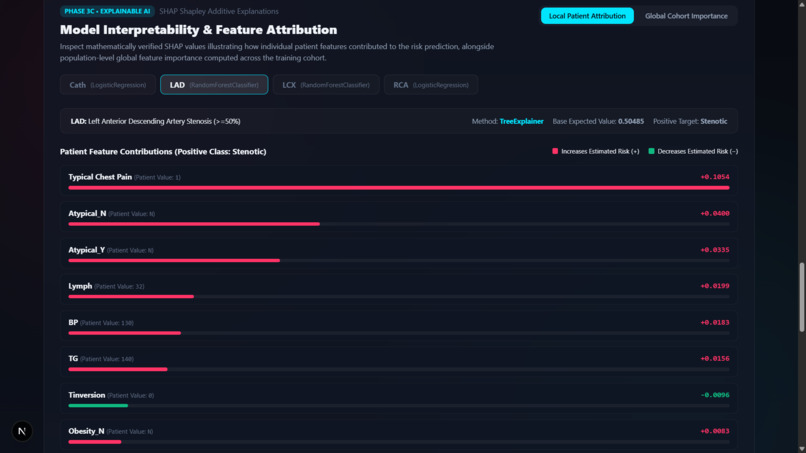
Modern Interpretability
-
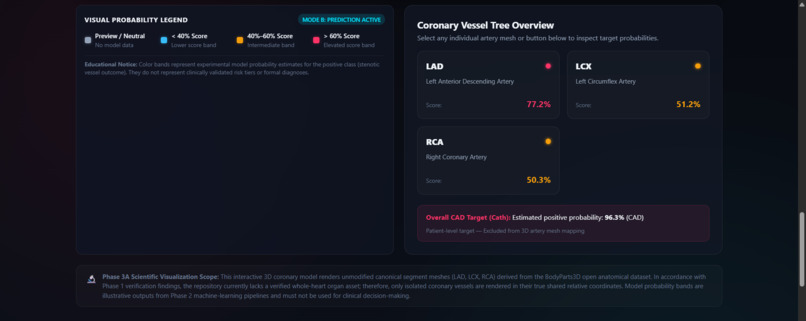
Coronary vessel Tree
CardioSight — AI-Powered Cardiovascular ML Visualization
The Problem
Cardiovascular disease is a major global health concern, and machine learning offers opportunities to explore patterns in clinical data. However, model predictions alone can be difficult to interpret. A probability displayed on a dashboard does not necessarily explain which input features influenced the output, how different prediction targets relate to one another, or how the results can be explored visually.
This creates an important challenge for educational and research prototypes: how can cardiovascular machine learning predictions, model explanations, and anatomical visualization be brought together in one understandable interface?
Our Solution
CardioSight is an educational cardiovascular machine learning prototype that integrates clinical feature entry, four classification pipelines, interactive three-dimensional coronary artery visualization, SHAP-based explainability, and model evaluation in a single web application.
Rather than presenting predictions as isolated numbers, CardioSight connects model outputs with visual representations and feature-level explanations. Users can enter a structured clinical feature profile, review the inputs, run inference, explore the resulting probabilities, and inspect how individual features contribute to a selected model's output.
The application evaluates four separate targets:
- Cath: Patient-level coronary artery disease classification.
- LAD: Left anterior descending artery stenosis classification.
- LCX: Left circumflex artery stenosis classification.
- RCA: Right coronary artery stenosis classification.
Keeping the patient-level Cath target separate from the three artery-level targets avoids incorrectly treating an overall classification as a prediction for an individual vessel.
How We Built It
CardioSight combines a modern web interface, a Python machine learning backend, interactive 3D rendering, and explainability tools.
Frontend: Next.js provides the application interface and organizes the clinical input workflow, prediction results, explainability views, and evaluation dashboard.
Backend: FastAPI handles inference requests and exposes the trained model pipelines through API endpoints.
Machine Learning: Scikit-learn powers four separate binary classification pipelines trained using the Z-Alizadeh Sani cardiovascular dataset, which contains 303 records. The feature contract uses 49 clinical features, with safeguards designed to exclude selected target-related or leakage-prone variables from model inputs.
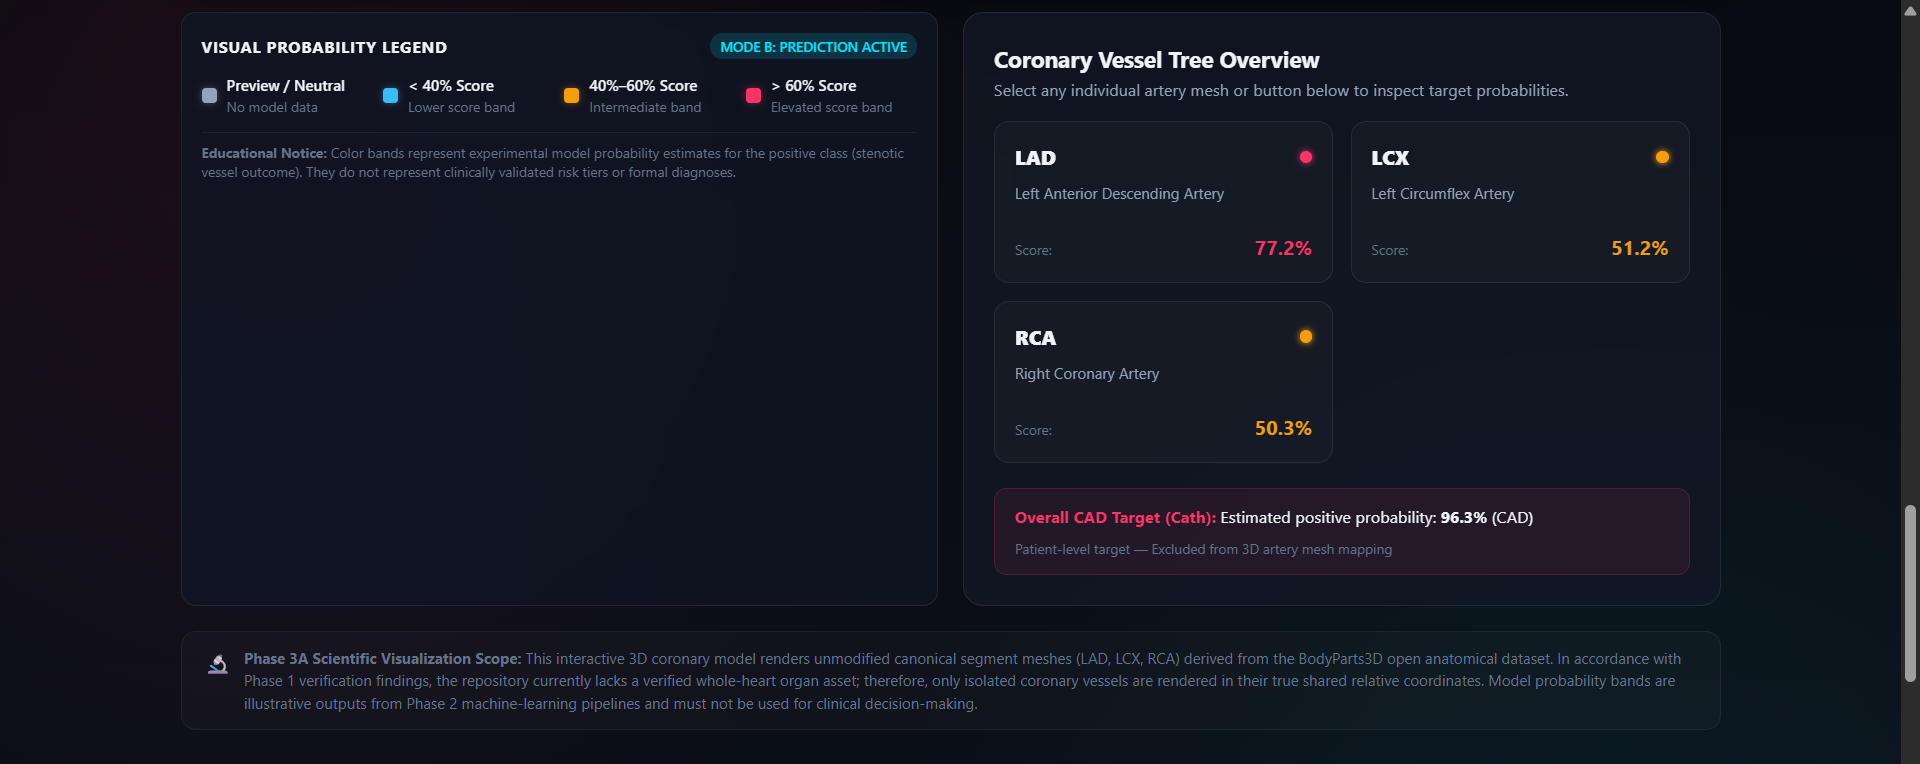
3D Visualization: Three.js renders canonical three-dimensional models of the LAD, LCX, and RCA. Users can rotate, zoom, reset the view, and focus on individual vessels. In prediction mode, the vessel visualization maps the corresponding model-estimated probabilities to illustrative color bands.
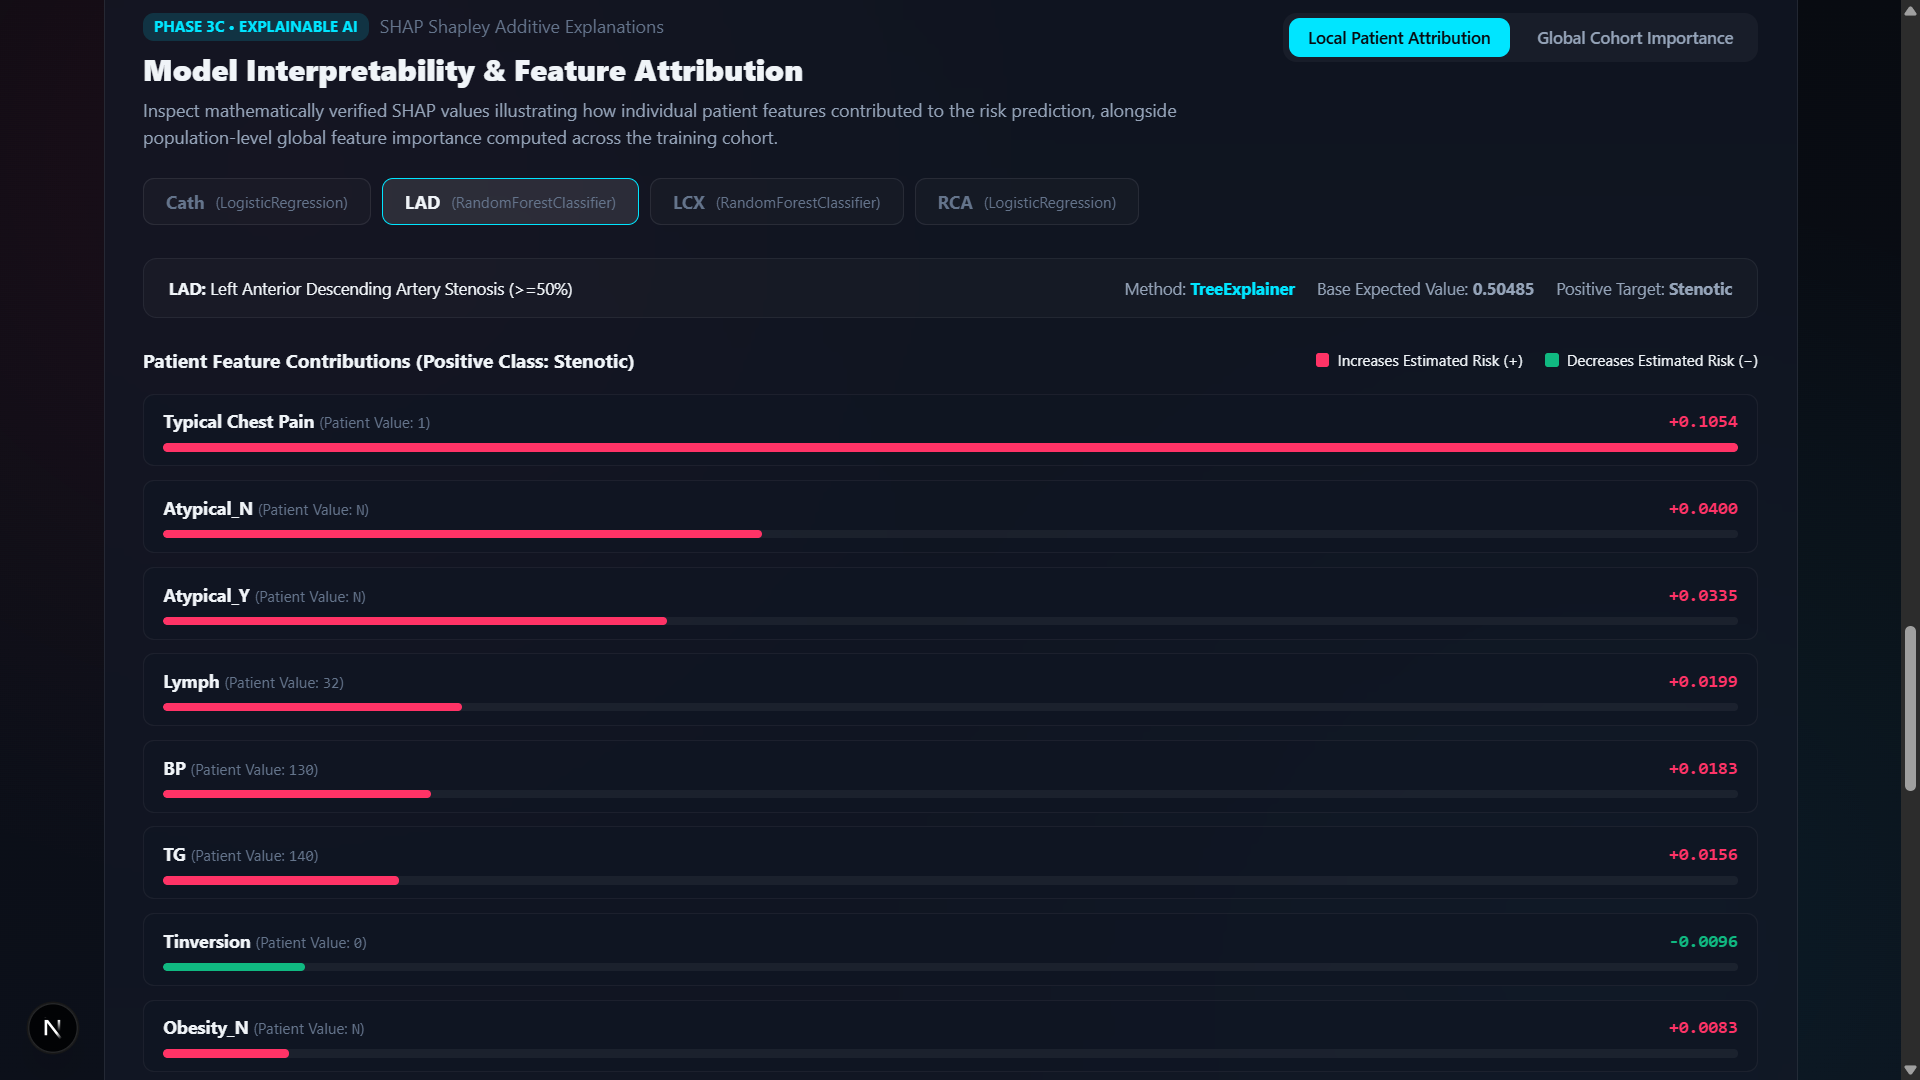
Explainable AI: SHAP, or SHapley Additive exPlanations, is used to inspect local feature contributions for individual predictions and global feature importance across the training cohort.
Model Evaluation: The dashboard presents held-out test metrics, cross-validation context, confusion matrices, and target class distributions. This helps users examine the models' measured performance rather than relying on prediction outputs alone.
The User Experience
The application follows a structured workflow:
- Enter or load a clearly labelled synthetic demonstration profile.
- Review the clinical inputs before confirming inference.
- View the four model outputs, with Cath separated from LAD, LCX, and RCA.
- Explore the corresponding coronary artery meshes in the interactive 3D viewer.
- Inspect local SHAP contributions and global feature importance.
- Review evaluation metrics and the dataset's target class distributions.
This workflow brings prediction, visualization, explanation, and evaluation into one cohesive interface.
Challenges We Addressed
One challenge was maintaining a consistent feature contract between the clinical form and the trained pipelines. The frontend inputs and backend models must agree on the expected features and their representation.
Another challenge was preventing misleading relationships between model targets and anatomical visualization. CardioSight keeps the patient-level Cath output separate from the individual artery predictions and maps only the corresponding LAD, LCX, and RCA outputs to their respective meshes.
Making the three-dimensional geometry visible and navigable also required attention to model positioning, camera framing, scaling, and interactive controls.
Finally, explainability and evaluation needed to be presented responsibly. SHAP contributions can describe how features influence a model's output, but they do not establish biological causation. Similarly, strong performance on a limited test split does not demonstrate generalization to other populations.
Results and Current Status
The implemented prototype brings together four trained classification pipelines, a 49-feature clinical input workflow, interactive coronary artery visualization, SHAP-based explanations, and an evaluation dashboard.
On the displayed held-out test results, the Cath model reports a ROC-AUC of 88.9% and accuracy of 83.6%. The dashboard also reports ROC-AUC values of 79.1% for LAD, 73.2% for LCX, and 73.3% for RCA.
These figures describe performance on the project's current dataset and evaluation setup. They are not evidence of clinical effectiveness or performance on external populations.
What We Learned
Building CardioSight reinforced that a useful machine learning application requires more than training a model. Data integrity, consistent feature handling, meaningful evaluation, understandable explanations, interactive visualization, and transparent limitations all matter.
The project also demonstrates how a full-stack application can connect a Python inference service with a modern web interface and interactive 3D graphics.
Limitations and Future Scope
CardioSight is an educational and research prototype, not a clinically validated diagnostic system. The dataset is small and single-center, model outputs are uncalibrated, and external clinical validation has not been established.
The 3D assets are canonical reference geometries rather than a complete, verified heart model or patient-specific anatomical reconstruction.
Future work could investigate larger and more diverse datasets, external validation, probability calibration, expanded robustness testing, and verified patient-specific anatomical modeling under appropriate clinical, ethical, and data-governance requirements.
Conclusion
CardioSight connects cardiovascular machine learning predictions with interactive anatomical visualization, explainable AI, and transparent model evaluation. Its core contribution is a unified educational platform that makes the prediction workflow easier to explore while keeping the scientific limitations visible.
For educational and research demonstration only. CardioSight is not intended to diagnose disease, guide treatment, or replace professional medical judgment.
Built With
- 3dvisualization
- datavisualization
- explainableai
- fastapi
- healthcareai
- machine-learning
- medicaldata
- modelevaluation
- next.js
- numpy
- pandas
- pipelines
- pydantic
- python
- react
- restapi
- scikit-learn
- shap
- three.js
- typescript

Log in or sign up for Devpost to join the conversation.