-
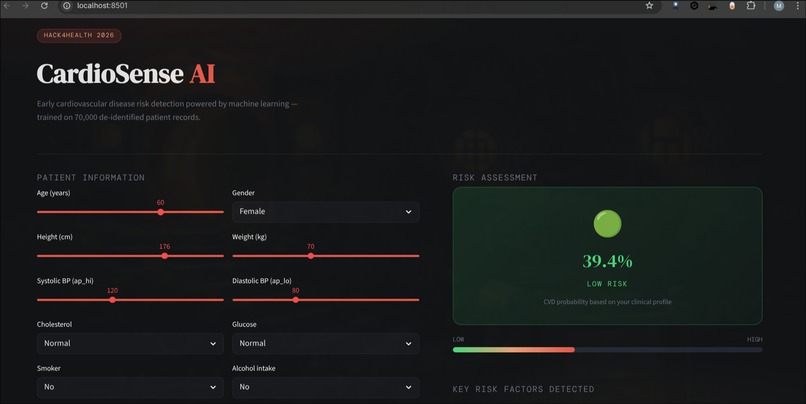
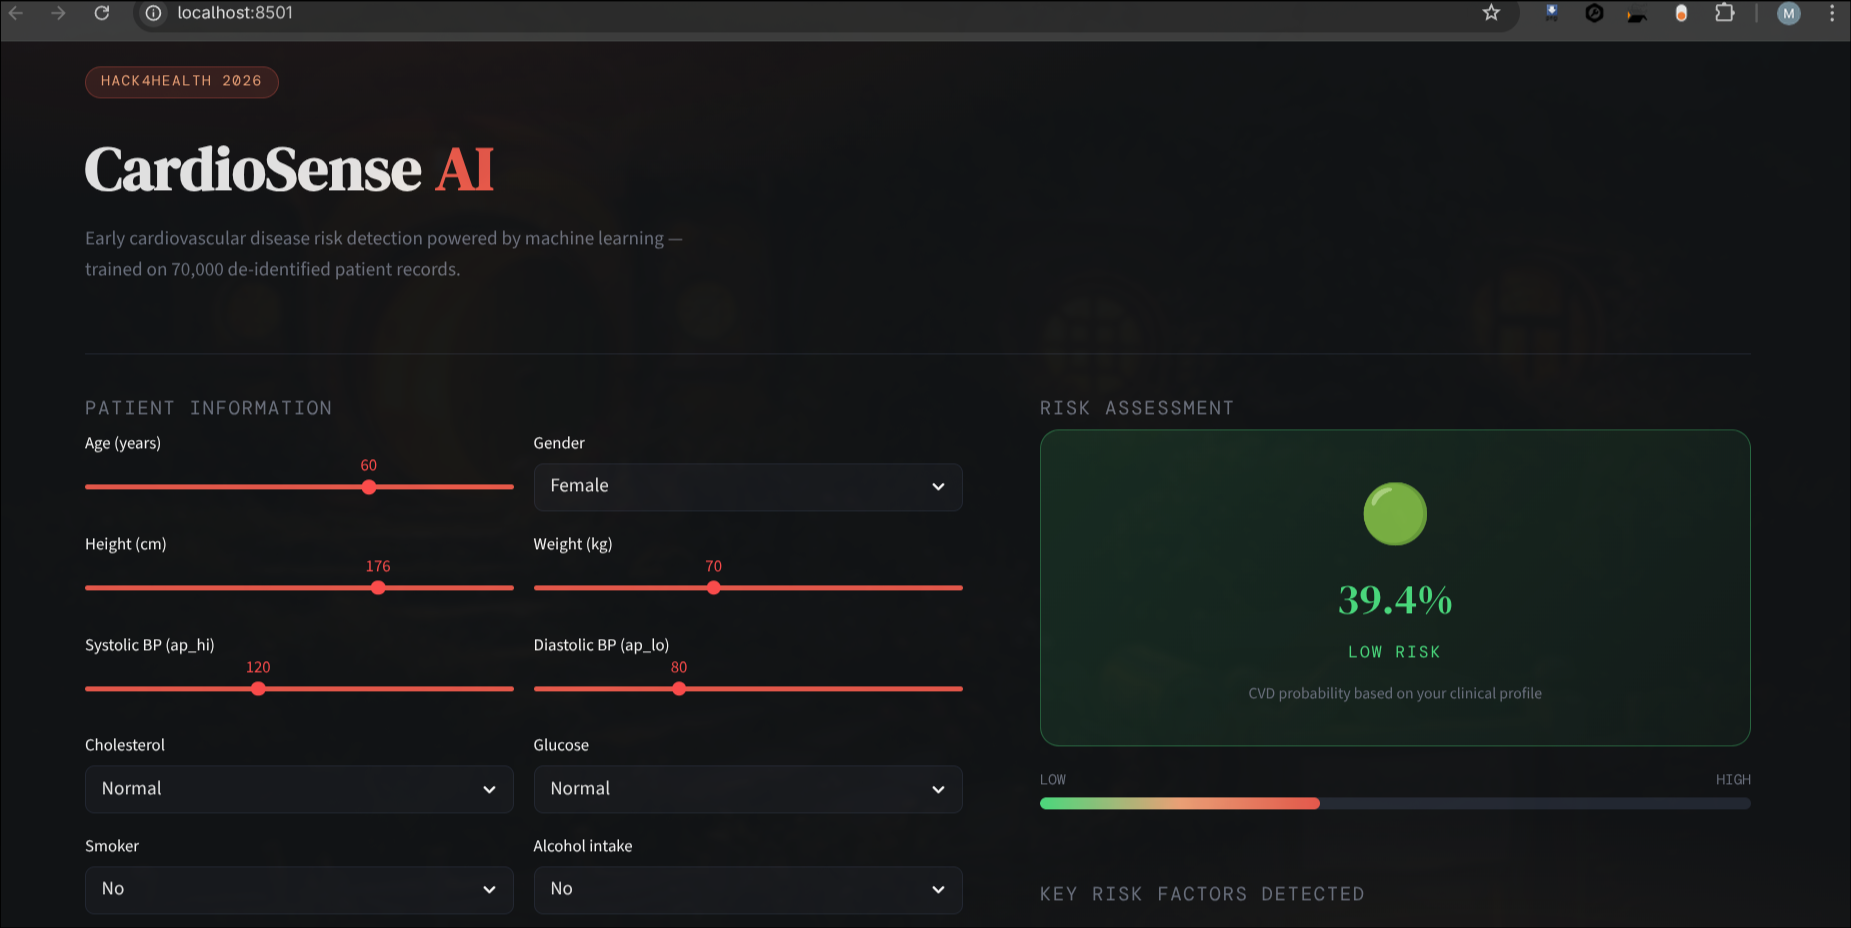
Demo
💡 Inspiration
Cardiovascular disease kills 17 million people annually — yet it's largely preventable with early detection. I wanted to build a tool that makes clinical-grade CVD risk prediction accessible from routine measurements any doctor already collects: blood pressure, age, cholesterol, and weight.
🔬 What I Built
CardioSense AI is an end-to-end ML pipeline that predicts cardiovascular disease risk from clinical features, trained on 70,000 de-identified patient records.
Full pipeline:
- EDA with skewness analysis and outlier detection
- Memory optimization: 6.4 MB → 1.6 MB (75% reduction) via dtype casting
- 5 feature engineering strategies tested (BMI, binned bands, digit decomposition, categorical encoding, genetic programming via gplearn)
- 3 model families benchmarked: XGBoost, LightGBM, RealMLP
- 5-fold Stratified Cross-Validation with out-of-fold (OOF) predictions
- Optuna Bayesian hyperparameter tuning (50 trials)
- SHAP KernelExplainer for model interpretability
- Streamlit web app for real-time risk assessment
📊 Results
| Model | AUC |
|---|---|
| Baseline (Logistic Regression) | 0.730 |
| XGBoost (best) | 0.7901 |
| LightGBM (best) | 0.7945 |
| RealMLP v1 | 0.7996 |
| RealMLP v3 (final model) | 0.8003 |
+9.6% improvement over baseline.
🧠 What I Learned
- RealMLP outperforms gradient boosting on this medical dataset thanks to learned feature embeddings and ensembling
- Digit decomposition of BP values (ap_hi_tens, ap_hi_units etc.) gave the model richer numeric structure — v3 beat all other versions
- SHAP revealed systolic BP, age, and cholesterol as dominant predictors — consistent with cardiology literature
- More features ≠ better: domain interaction features degraded AUC by −0.00047
- Smoking/alcohol had near-zero SHAP importance due to self-reporting bias in the dataset (only 8.7% smokers) — a real data quality lesson
- Optuna hit a ceiling — 50 trials showed no improvement over initial params
🛠️ How I Built It
Step 1 — Data Cleaning: Raw age in days (max 23,713). Removed impossible BP/weight/height values, rows where diastolic > systolic, 24 duplicates. Final: 65,663 patients.
Step 2 — Feature Engineering: Tested 5 strategies. Best was v3 — digit decomposition of BP/height/weight into hundreds, tens, units digits. 24 total features.
Step 3 — Model Training: XGBoost, LightGBM, RealMLP across all 5 versions, 5-fold CV. RealMLP v3 → AUC 0.8003.
Step 4 — Explainability: SHAP KernelExplainer, 200 test patients, precomputed and saved for instant app display.
Step 5 — Deployment: Dark medical Streamlit UI, real-time risk gauge, SHAP chart. Model converted CUDA→CPU for cloud deployment.
⚡ Challenges
- CUDA → CPU deployment: Model trained on RTX 4050 but Streamlit Cloud has no GPU — manually converted torch tensors to CPU
- SHAP + RealMLP: Not supported by TreeExplainer — used KernelExplainer, took ~15 minutes for 200 samples
- Age normalization: Dataset stores age in days — found exact max (23,713) to correctly normalize
- Optuna ceiling: 50 trials, zero improvement — confirmed initial params were already near-optimal

Log in or sign up for Devpost to join the conversation.