-
-
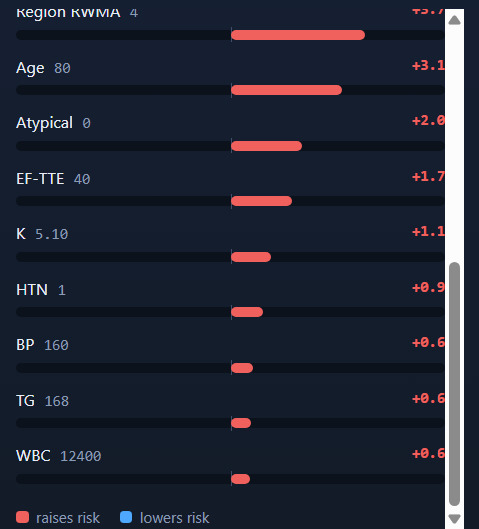
SHAP
-
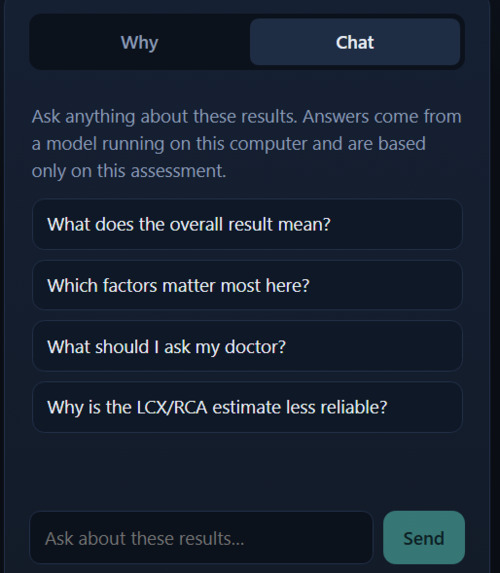
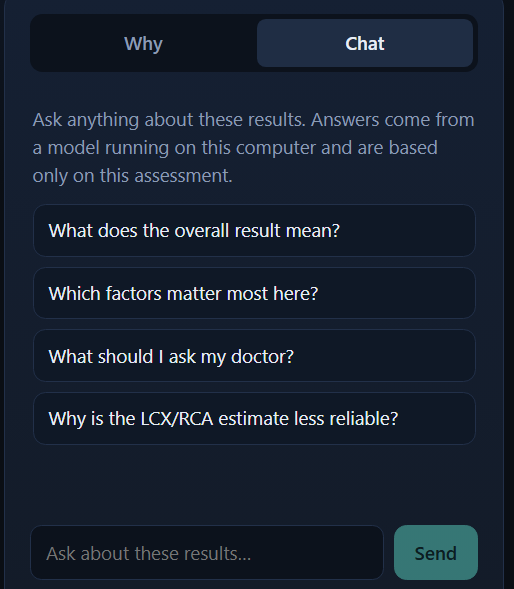
Chat
-
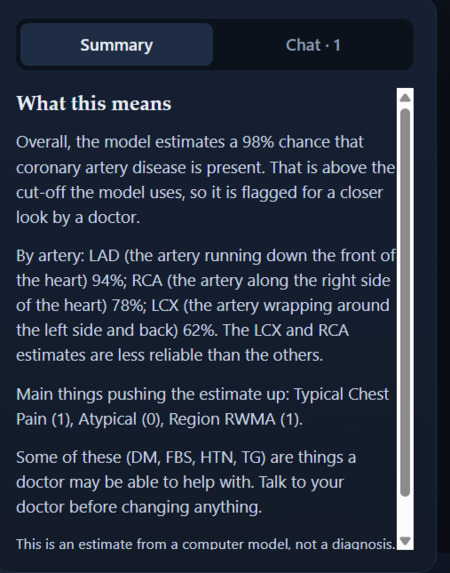
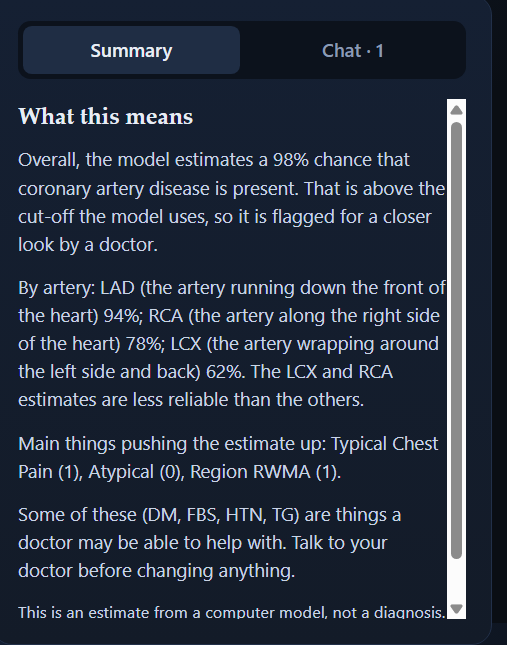
summary of the report in Patient model
-
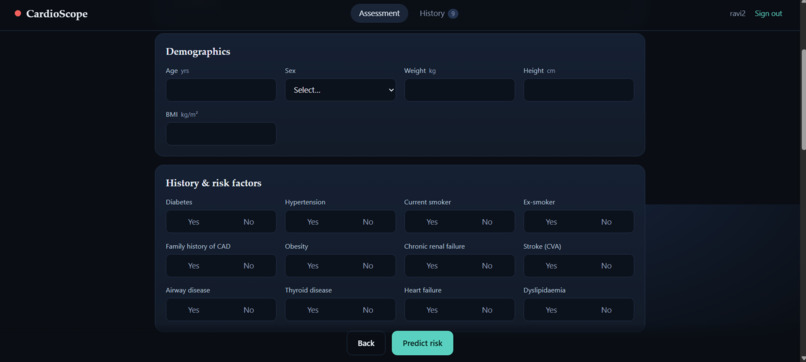
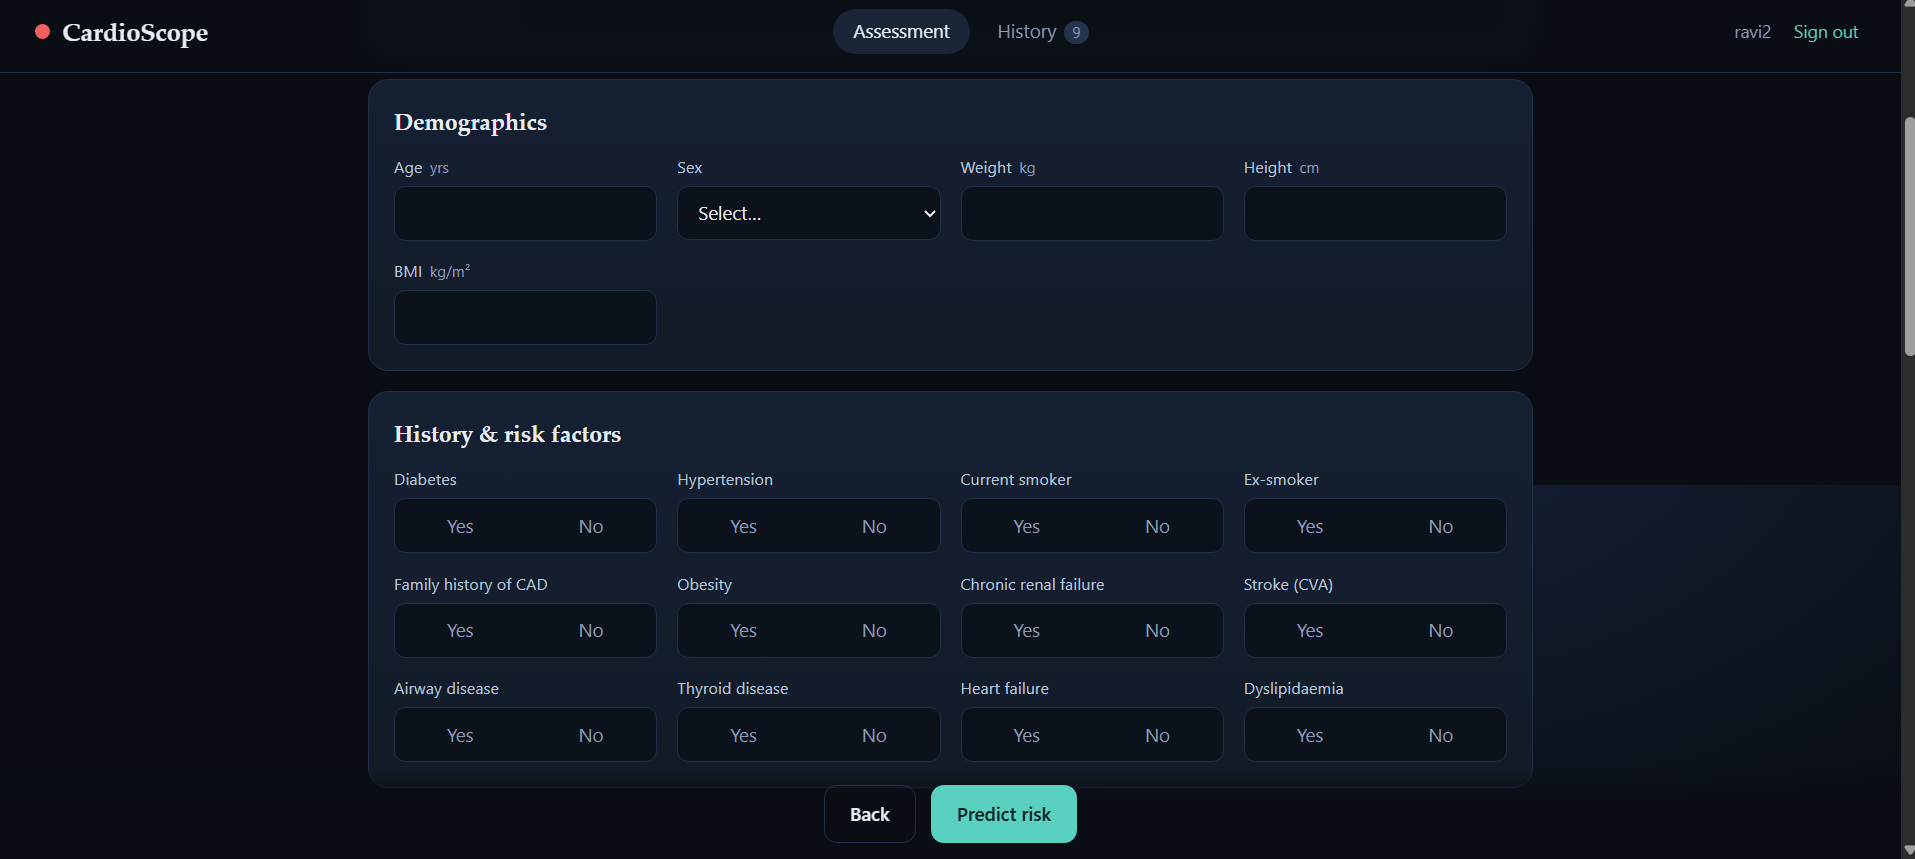
manual detials page
-
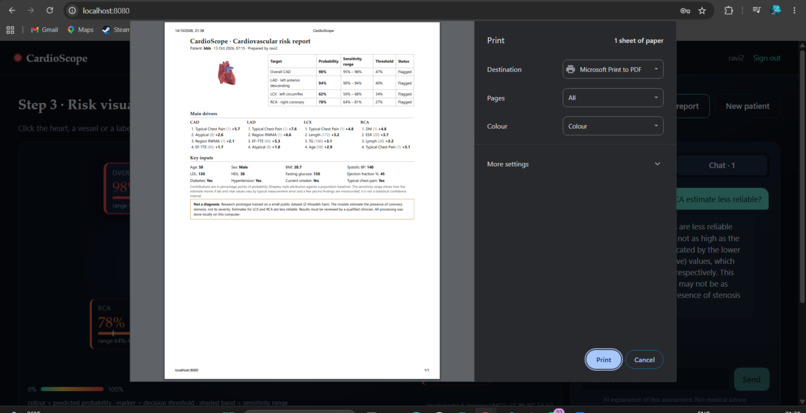
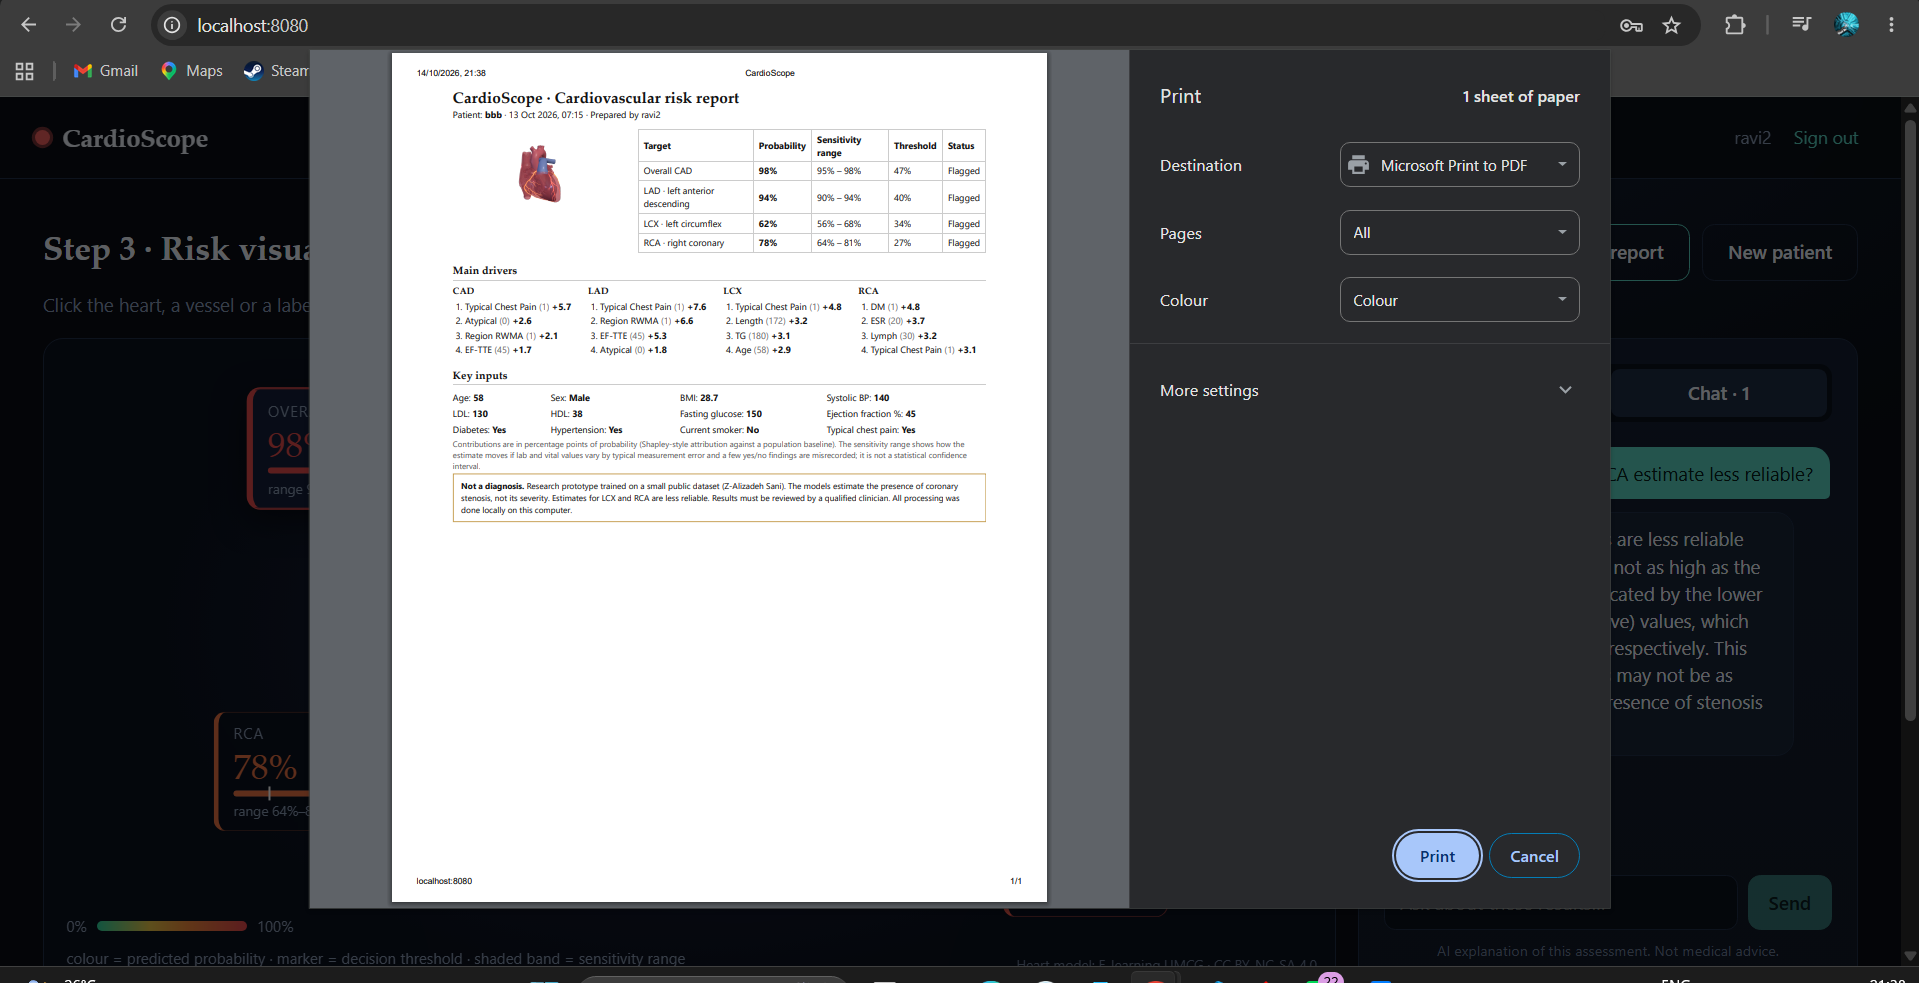
get pdf report feature
-
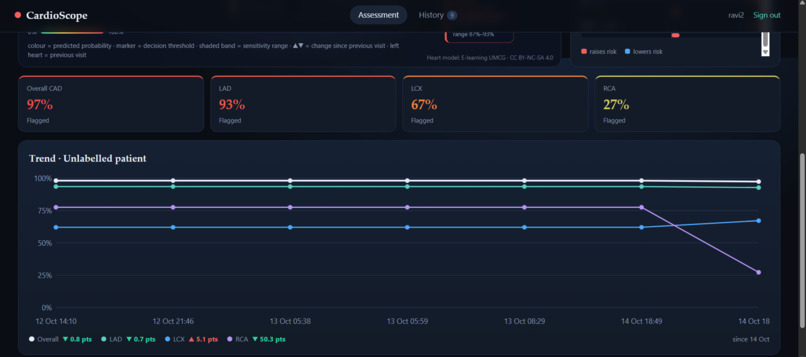
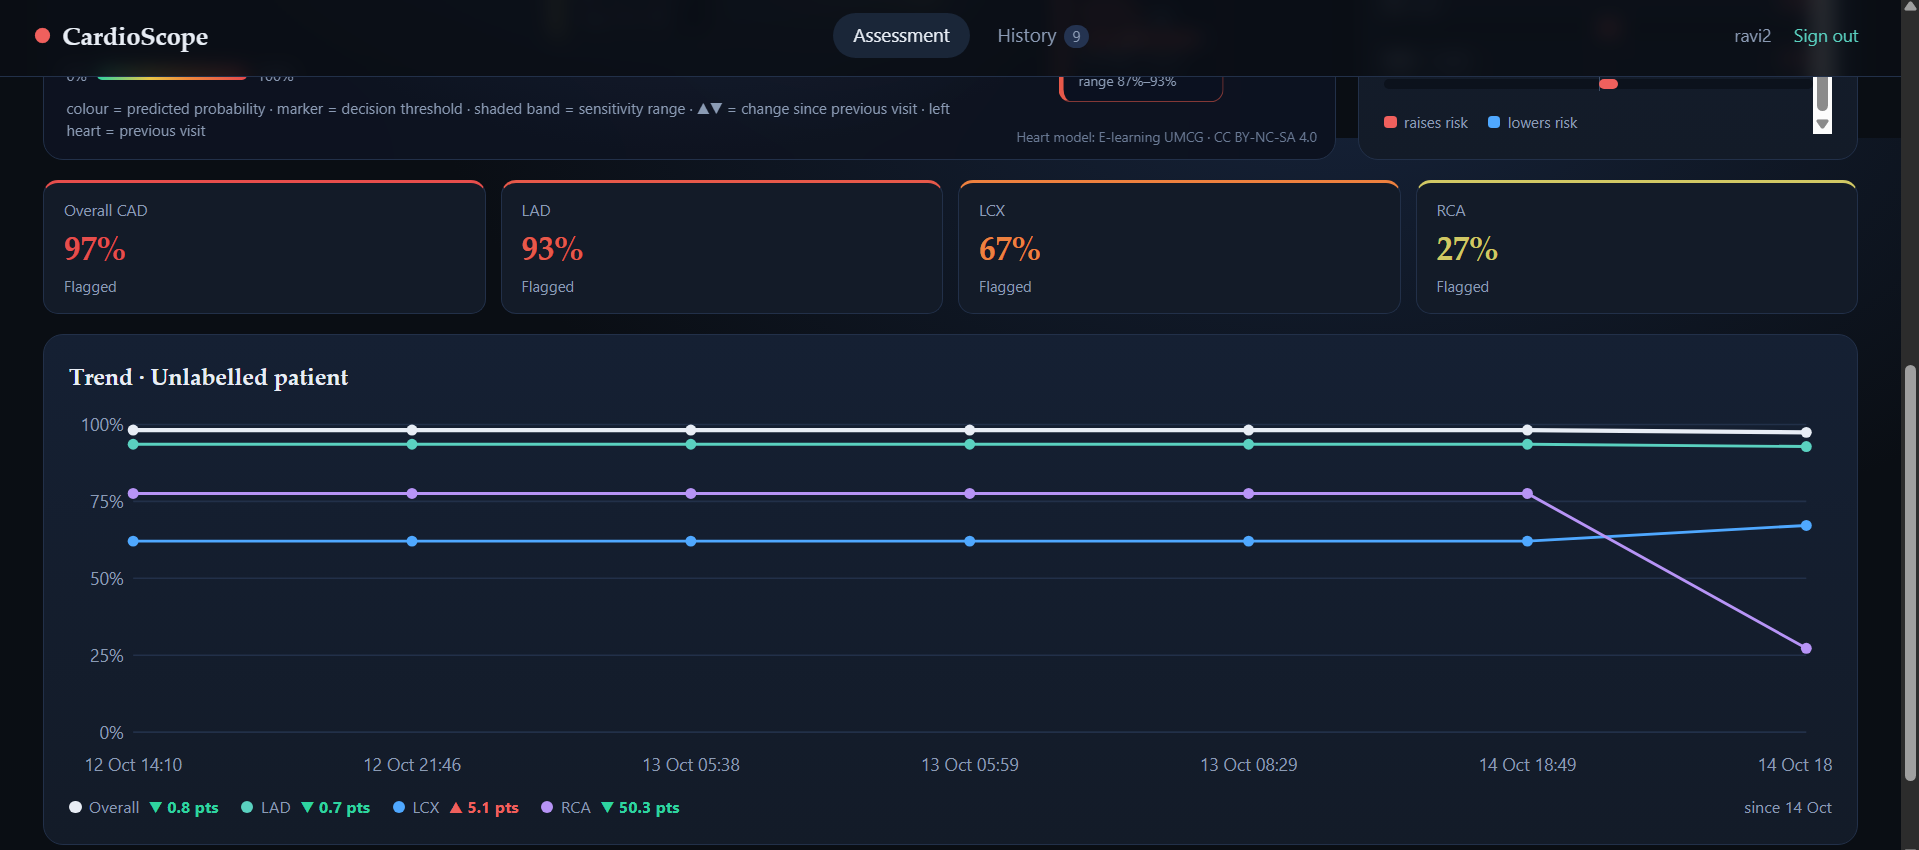
Patient Report track graph
-
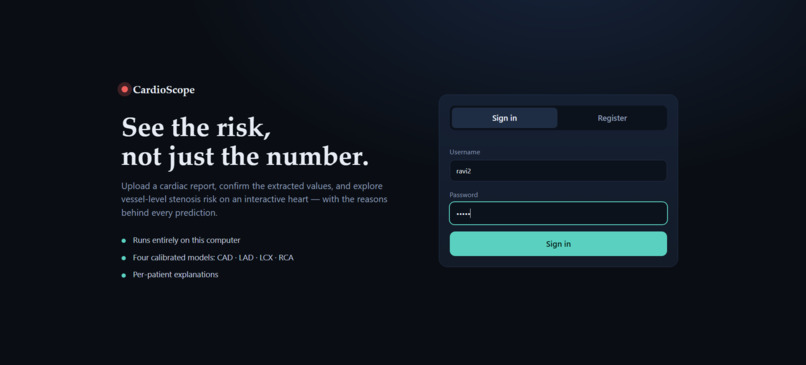
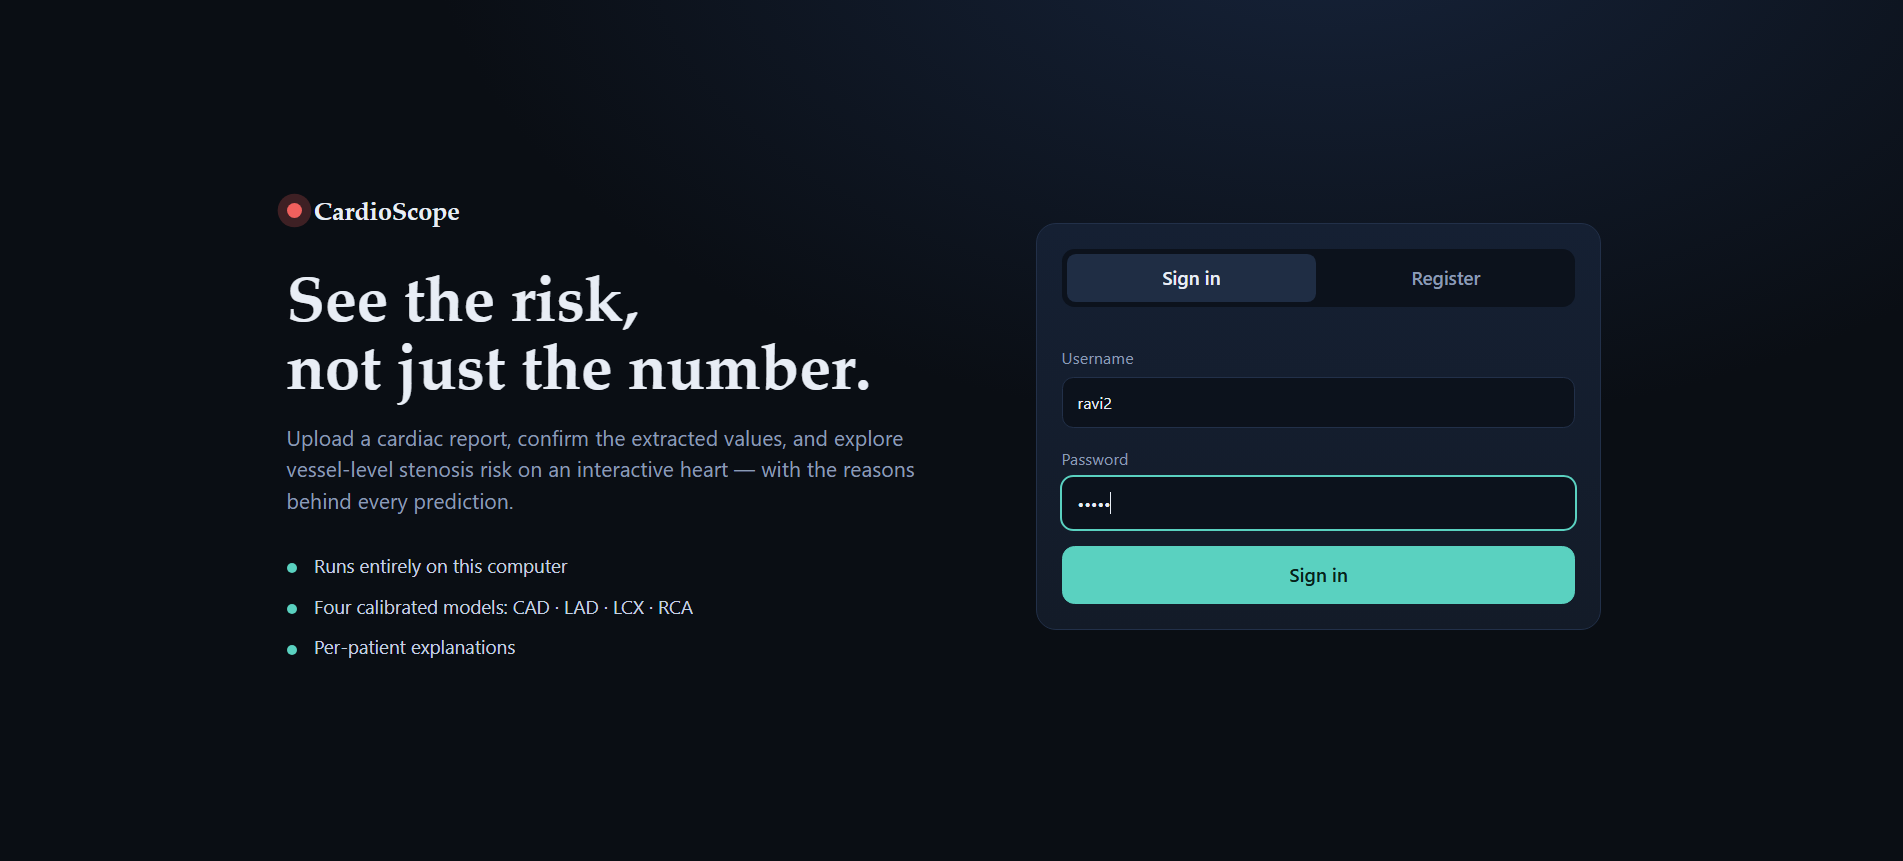
login page
-
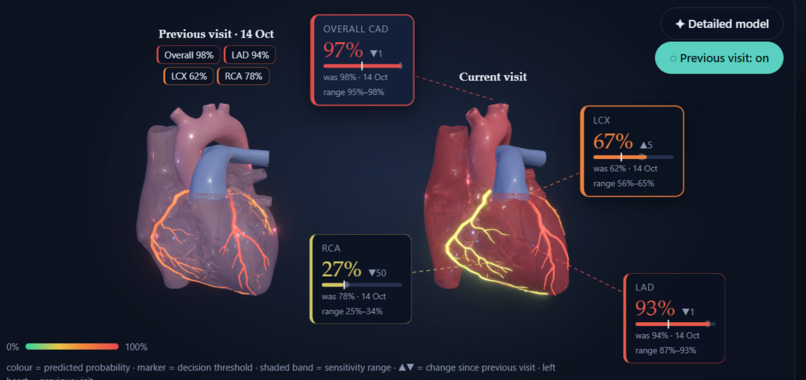
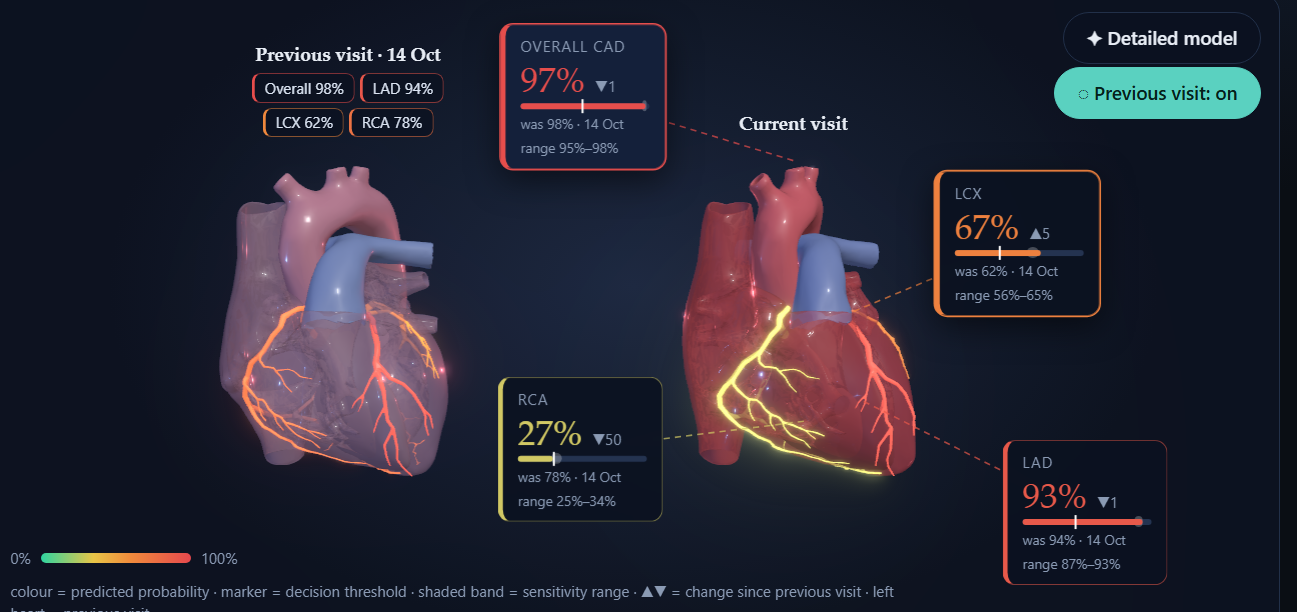
comparision mode and main window
-
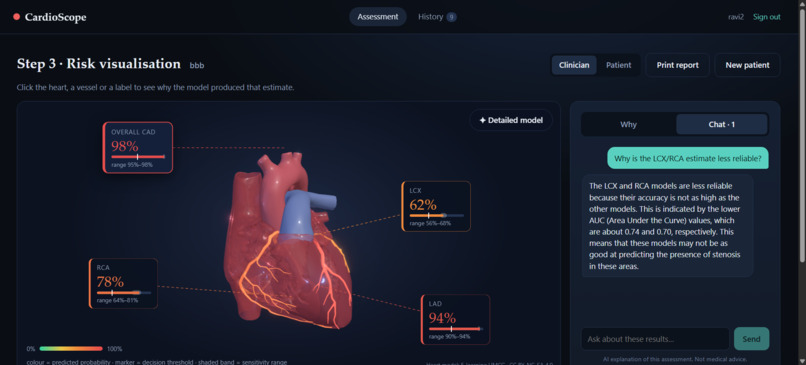
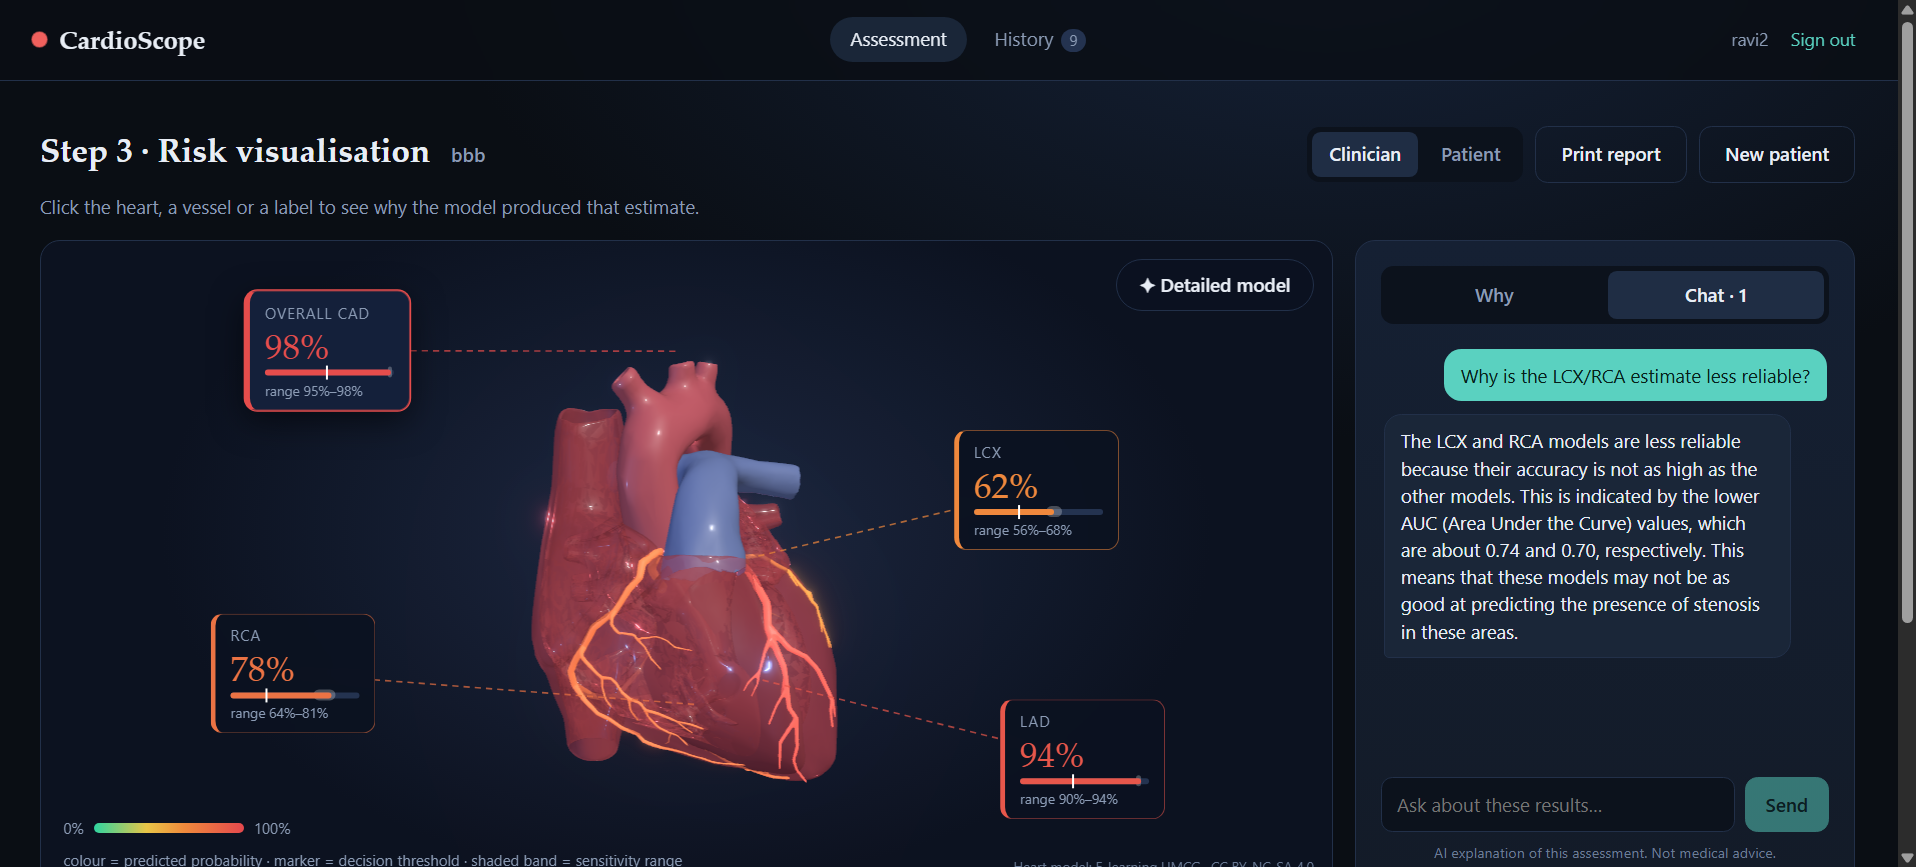
main window with chat response
-
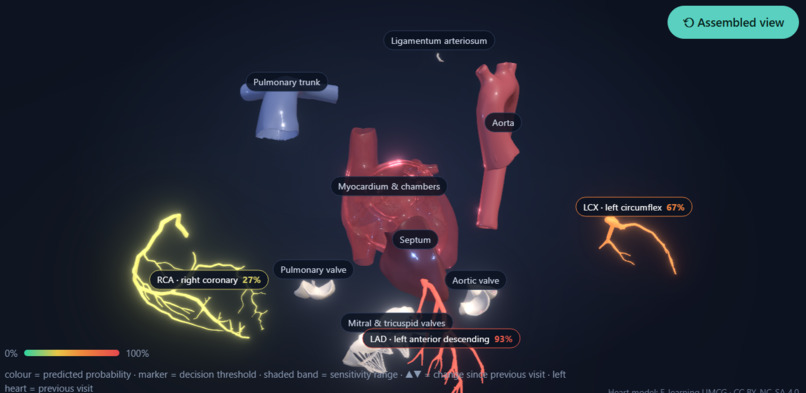
detailed model view
-
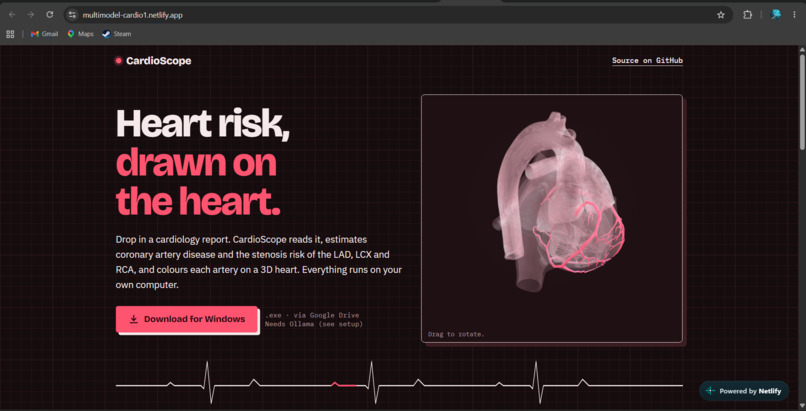
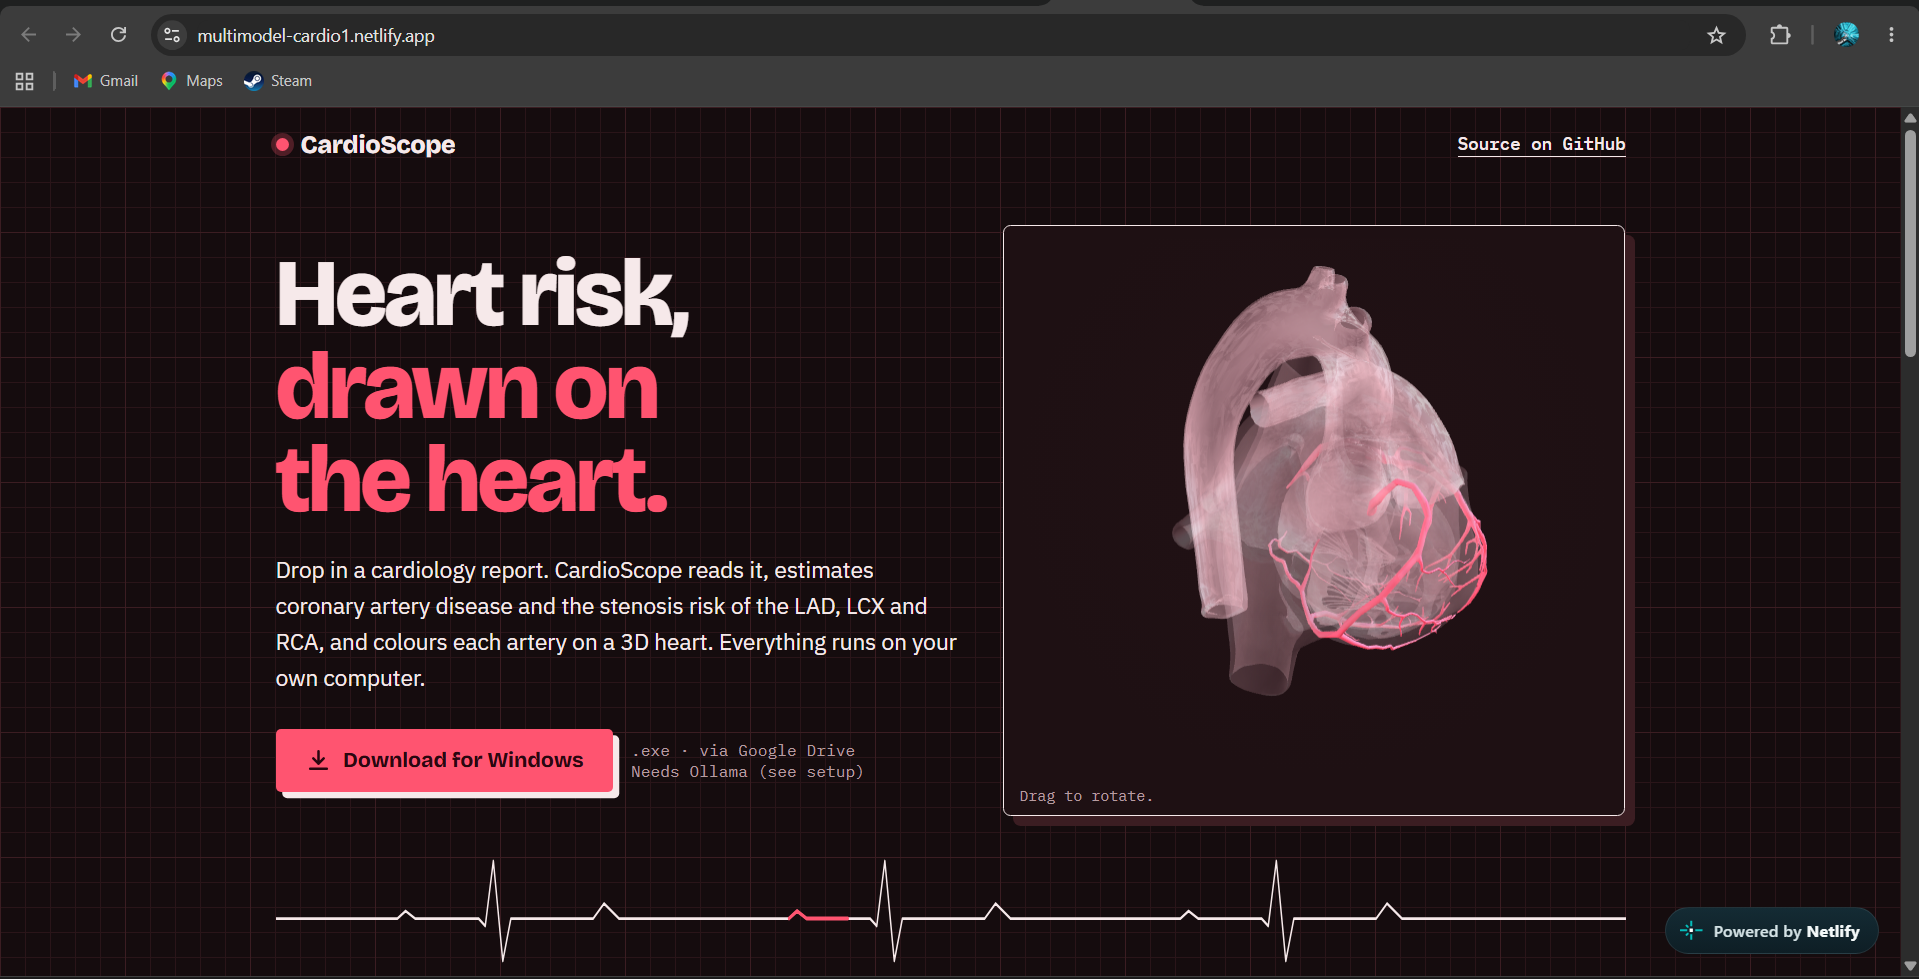
webpage
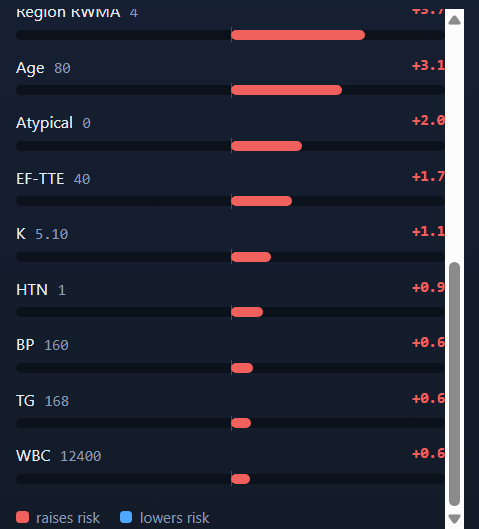
Inspiration
Coronary artery disease is often caught late, and most risk tools hand a clinician a single number with no explanation. We wanted something a doctor could actually interrogate: upload a patient's report, see which vessel is at risk, and understand why. Patient data is sensitive, so we made it fully offline. No cloud APIs, nothing leaves the machine. Moreover, the visualisation part was something we were really passionate about, and we did pour out heart while building it, getting to learn a lot which was the initial inspiration and target.
What it does
CardioScope turns a PDF clinical report into a cardiovascular risk assessment:
- Upload a PDF. A local LLM extracts the clinical fields (age, BMI, BP, LDL, EF, chest pain type, etc.).
- Four predictions: overall CAD plus stenosis in the LAD, LCX and RCA.
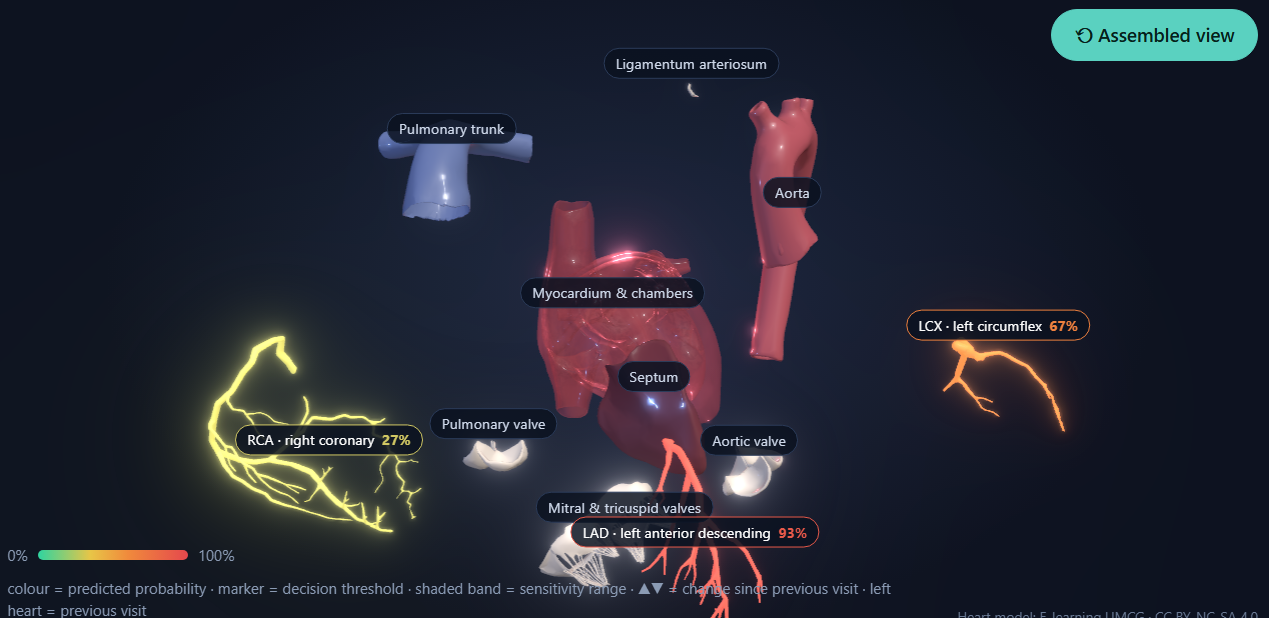
- 3D heart viewer: each coronary vessel is coloured by its predicted probability. Click a vessel for its detail panel.
- Explanations: top drivers per target, shown as signed contributions in percentage points.
- Sensitivity range: each estimate is re-run on perturbed inputs and the 5th to 95th percentile is shown.
- Chat panel: ask follow-up questions about an assessment, streamed token by token.
- Exportable report with a clear "not a diagnosis" disclaimer.
How we built it
Stack: React + Vite + React Three Fiber (GLTFLoader, OrbitControls) on the front end. Spring Boot (Java 21) with Spring Security (HTTP Basic) and Spring Data JPA on the back end. Text extraction uses PDFBox with Tesseract OCR as fallback. Ollama (llama3.1:8b) handles field extraction, summaries and chat. ONNX Runtime runs the four models in Java. Storage is an AES-encrypted H2 file database, and every table is reached through its owner, so users only see their own data.
ML (Z-Alizadeh Sani dataset, 303 patients):
- Removed 5 leakage columns (CAD, LAD, LCX, RCA, Cath), so the labels never leak into the inputs.
- One calibrated RandomForest per target, tuned by randomized search (8 candidates, ROC-AUC objective), wrapped in 5-fold sigmoid calibration.
- Nested CV (5 outer, 3 inner folds), so tuning never sees the rows that score it.
- Thresholds chosen per target on out-of-fold probabilities.
- Baselines (logreg, XGBoost) with 5×5 repeated CV showed the gaps were inside the error bars, so we kept RandomForest.
For calibration we tracked the Brier score:
$$\text{Brier} = \frac{1}{N}\sum_{i=1}^{N}(\hat{p}_i - y_i)^2$$
For explanations we used Shapley-style attributions that sum to the prediction minus the background average:
$$\sum_{j}\phi_j = f(x) - \mathbb{E}[f(X)]$$
| Target | ROC-AUC | PR-AUC | Brier | Brier (base rate) |
|---|---|---|---|---|
| CAD | 0.914 | 0.961 | 0.100 | 0.205 |
| LAD | 0.848 | 0.883 | 0.154 | 0.243 |
| LCX | 0.741 | 0.586 | 0.203 | 0.239 |
| RCA | 0.697 | 0.554 | 0.210 | 0.235 |
Challenges we ran into
- Tiny dataset. With 303 rows, a 61-patient test set gives very noisy estimates. We reported cross-validated metrics on all rows instead.
- Data leakage. The label columns are closely tied to each other, so we had to strip them carefully and keep the deployed feature vector identical to training.
- Weak LCX and RCA models. Their Brier scores are close to the base-rate reference, so the UI flags them as lower-confidence instead of hiding it.
- Messy encoding. Examples: the source spells female as "Fmale", VHD is ordinal (0 to 3), and BBB needed one-hot encoding.
- Honest uncertainty. The sensitivity range is not a statistical confidence interval, and the interface says so.
- Staying fully offline. PDF parsing, LLM extraction, inference and chat all had to run on localhost without a dedicated GPU.
- Faithful 3D mapping. Vessel meshes are matched by name to model outputs, and colour is driven by the raw probability, not the thresholded label, so the visual never contradicts the numbers.
Accomplishments that we're proud of
- A complete offline, privacy-first pipeline from PDF to explained 3D result.
- CAD AUC of 0.914 and LAD AUC of 0.848 under nested CV, with a clean leakage-free setup.
- An interface that shows its own limits: low-confidence flags, sensitivity ranges and a clear disclaimer.
- Explanations a clinician can read: per-patient drivers plus global SHAP summaries.
- Real-time 3D updates: a new assessment re-colours the vessels without reloading.
What we learned
- Validation design matters more than model choice. Nested CV and leakage control changed our numbers more than any tuning.
- Calibration is as important as discrimination. A good AUC with a bad Brier score is not trustworthy.
- SHAP shows what the model relies on, not what causes disease.
- Thresholds picked on the same out-of-fold probabilities make F1 slightly optimistic, and we say so.
- Local LLMs are good enough for structured field extraction and chat when the stack is designed around them.
What's next for CardioScope
- External validation on multi-centre data. Our validation is internal (303 patients, one centre).
- Improve LCX and RCA with more data and better features.
- Add severity estimation, not just presence of stenosis.
- Add confidence intervals with proper uncertainty quantification.
- Improve the OCR and extraction pipeline for varied report formats, and support regional languages.
- Run a clinician usability study before any real-world use.

Log in or sign up for Devpost to join the conversation.