-
-
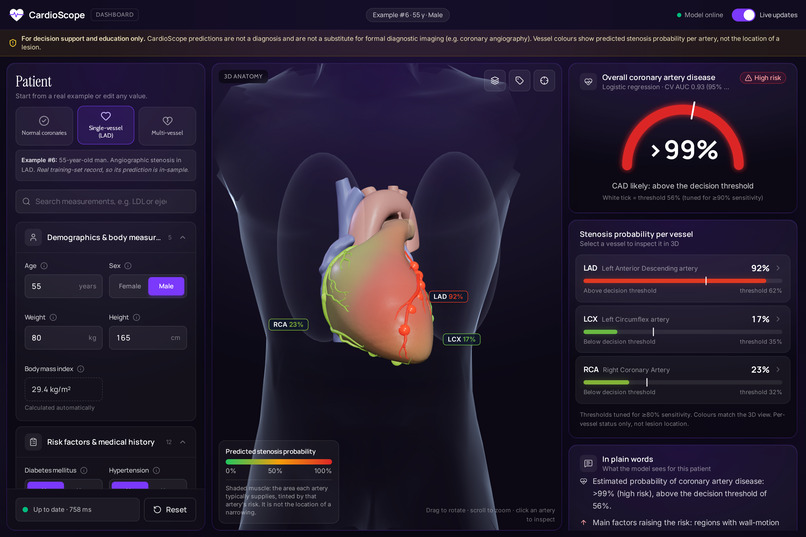
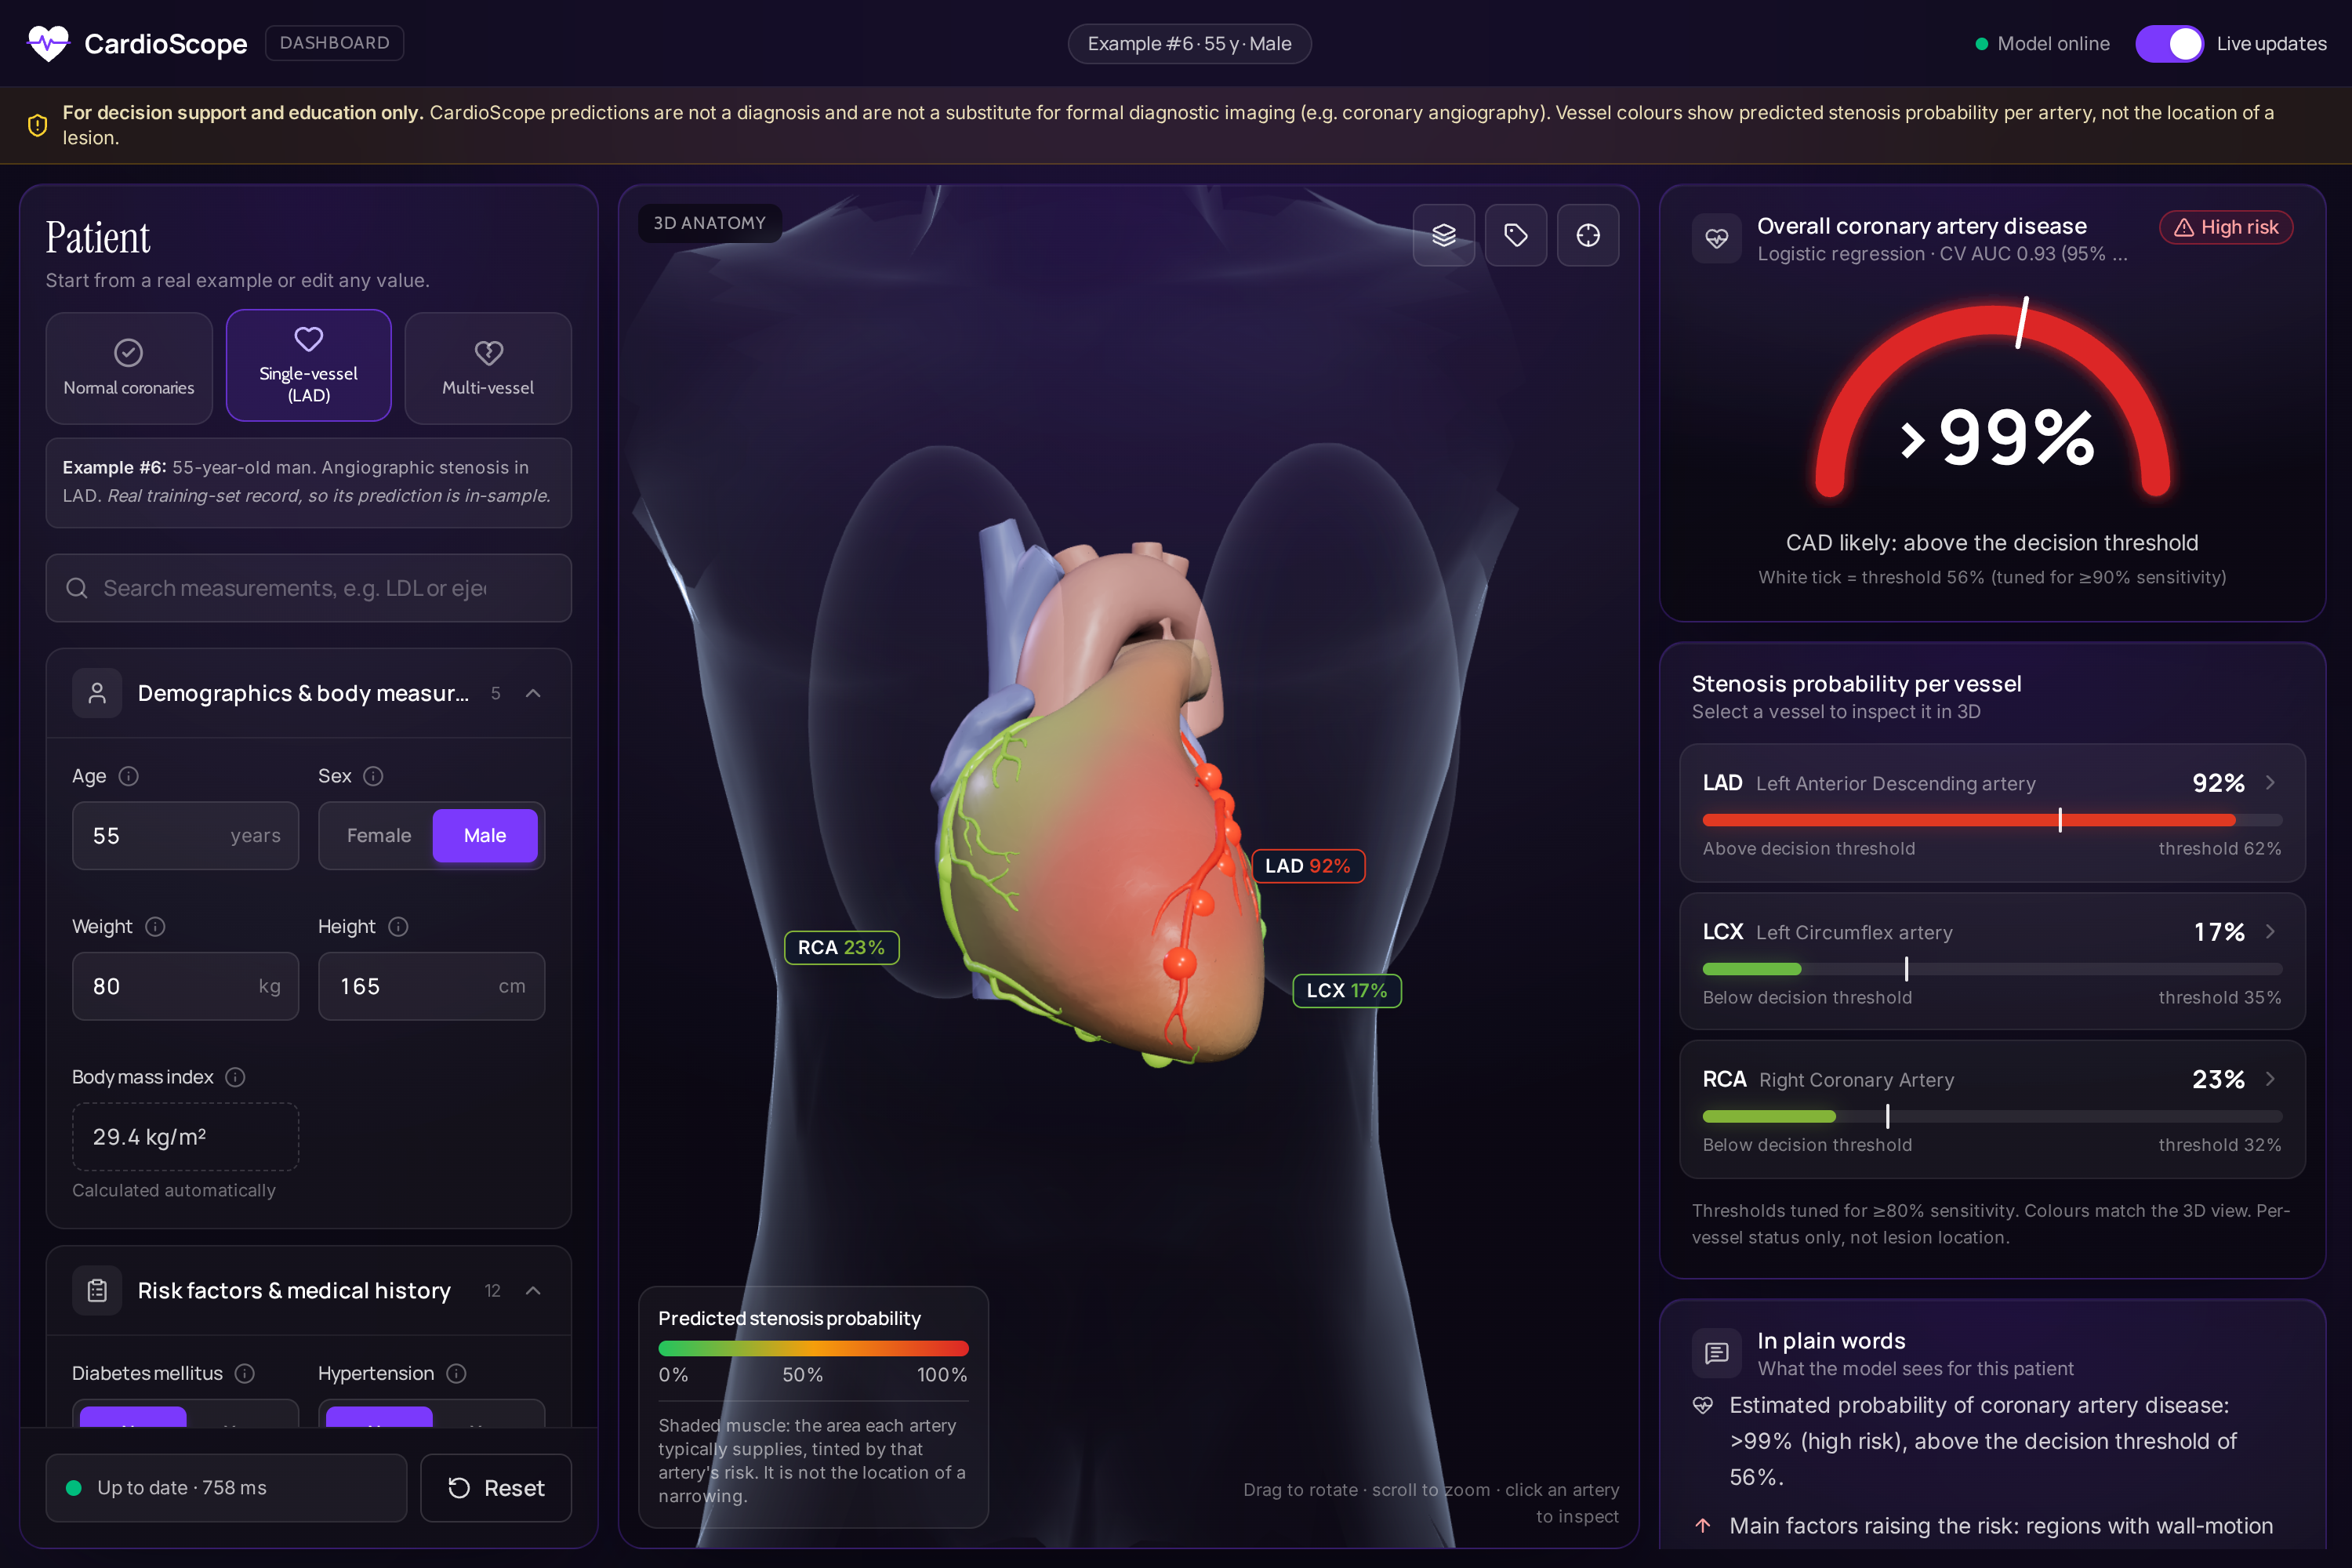
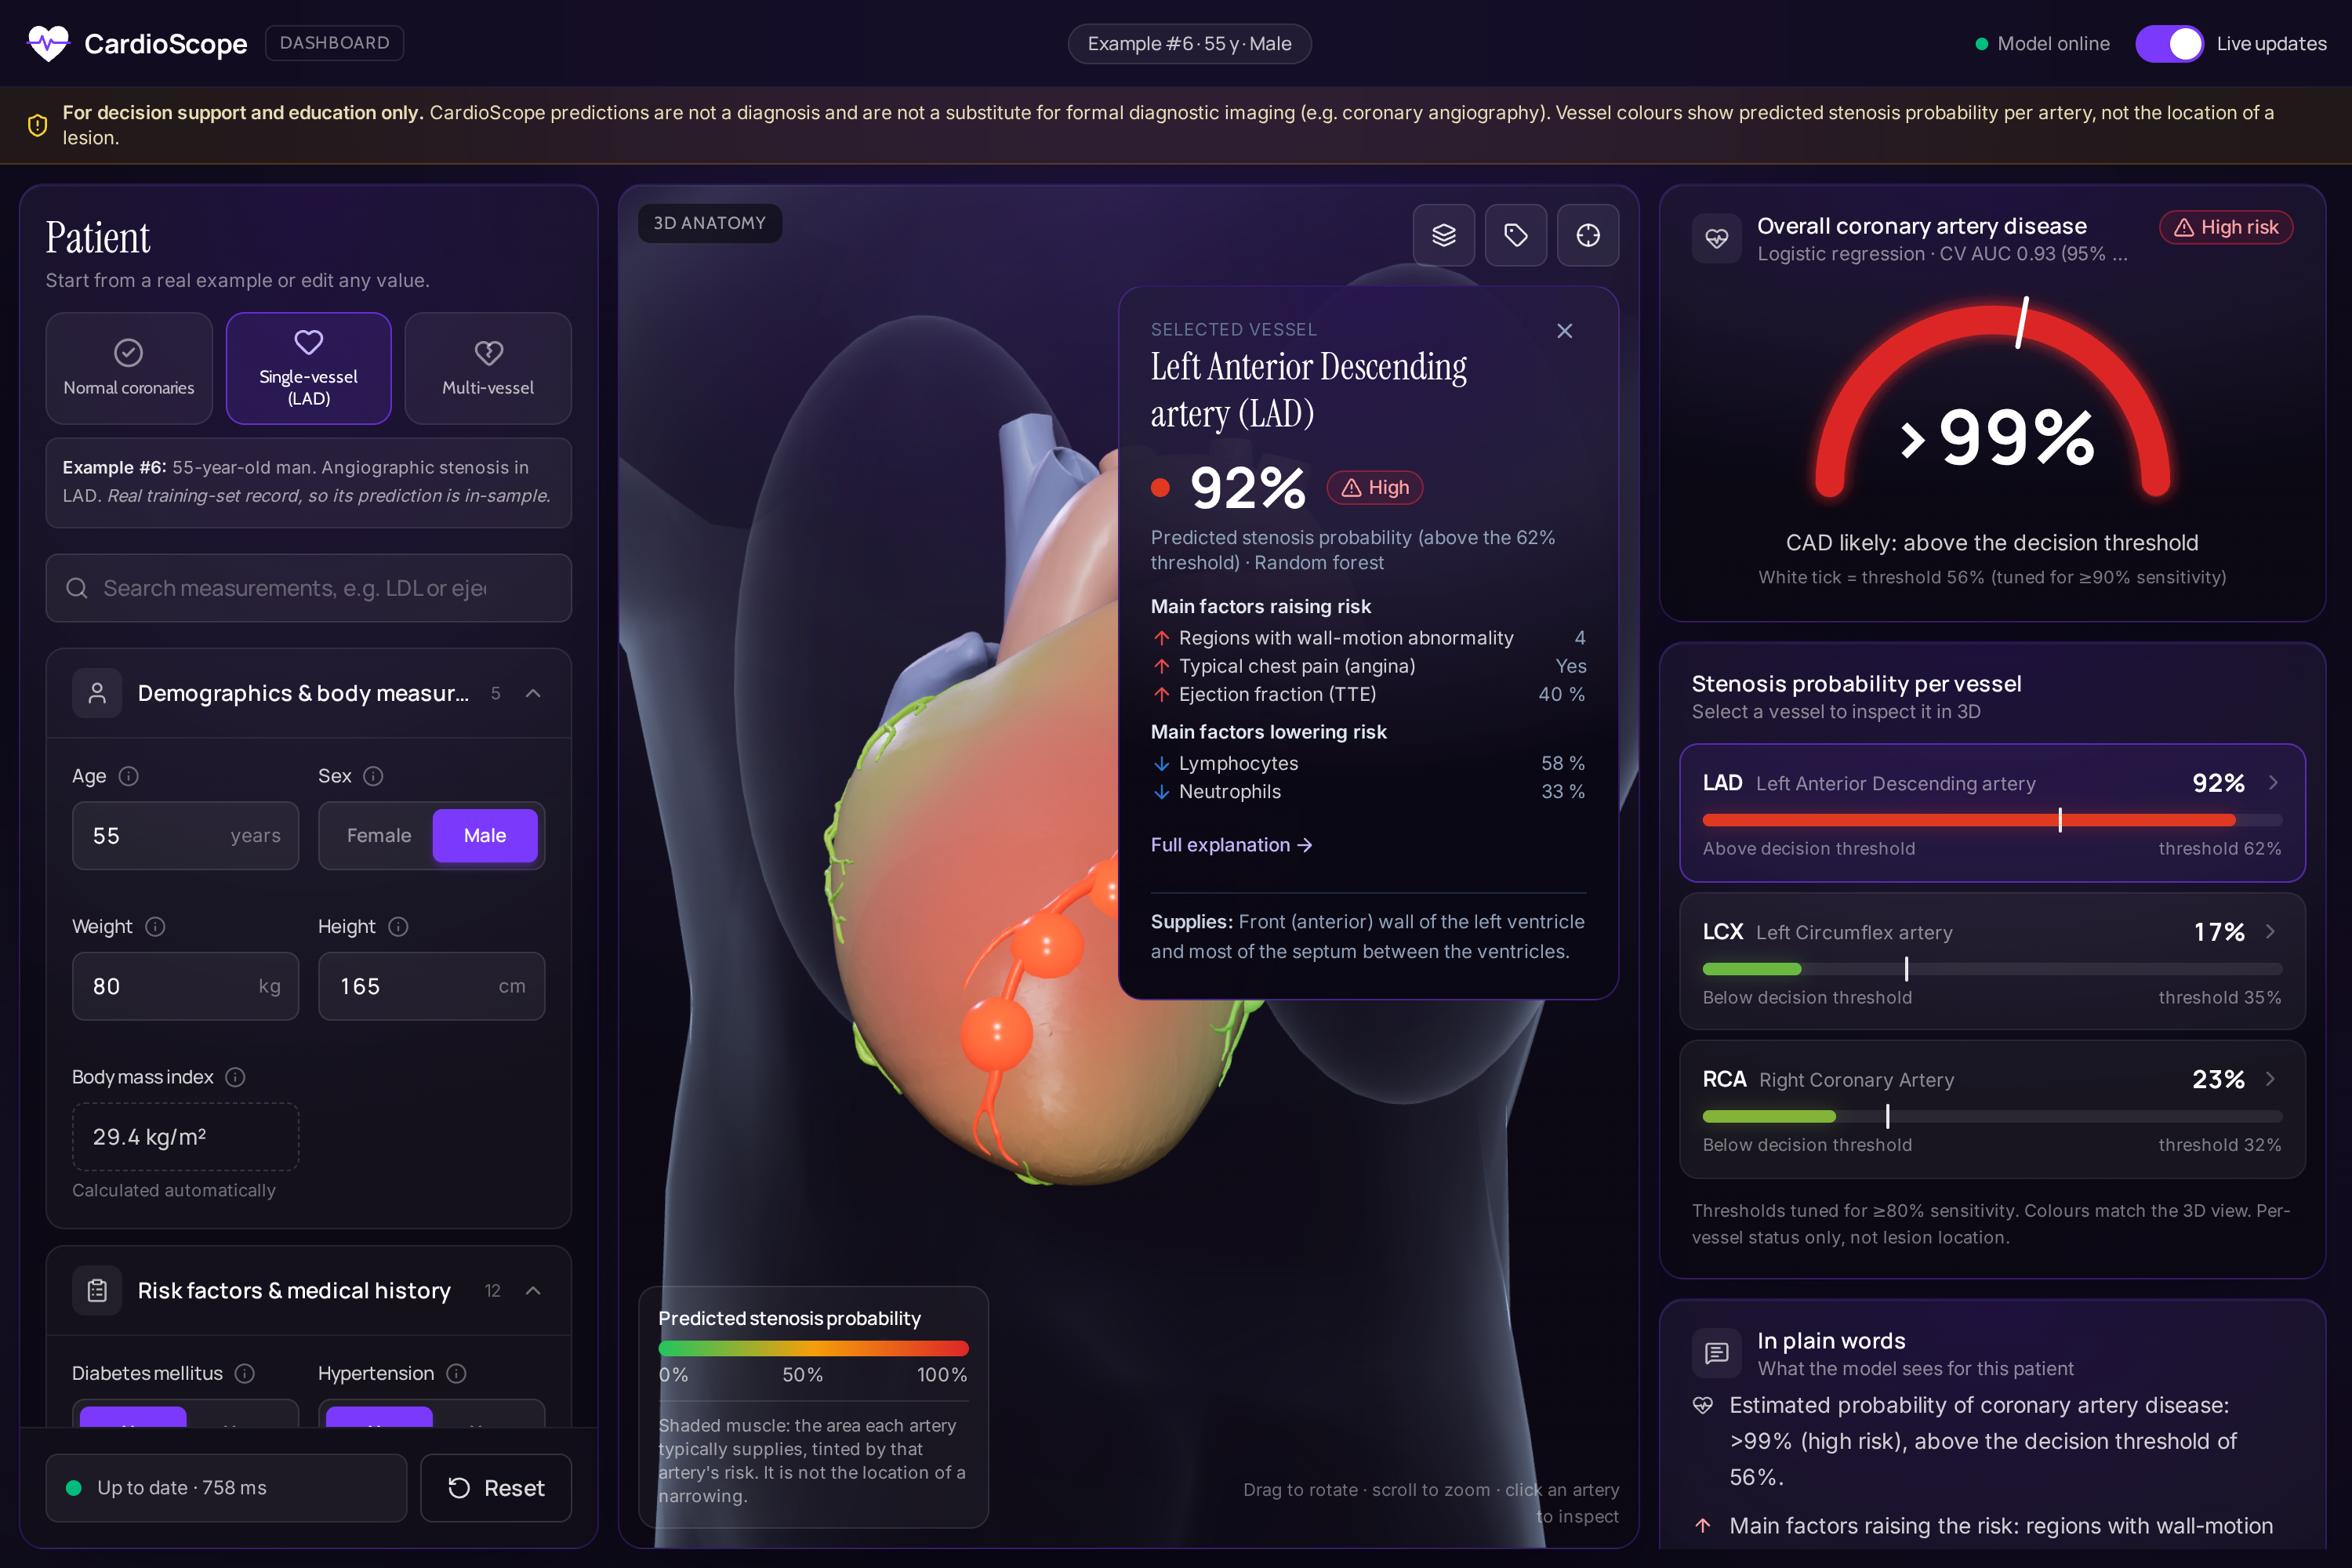
Single-vessel patient: LAD 92% (red) and its supply territory shaded on the 3D heart; LCX and RCA low (green).
-
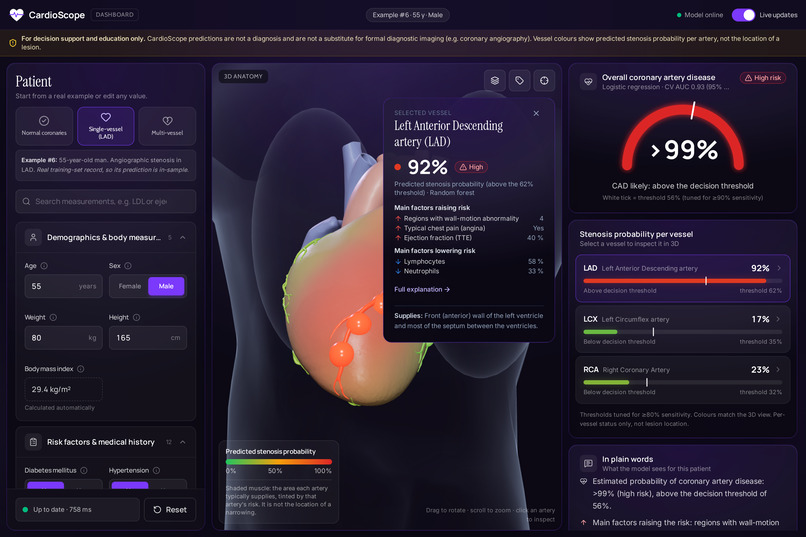
Click an artery: the camera flies to it and shows its probability, top SHAP factors and the region it supplies.
-
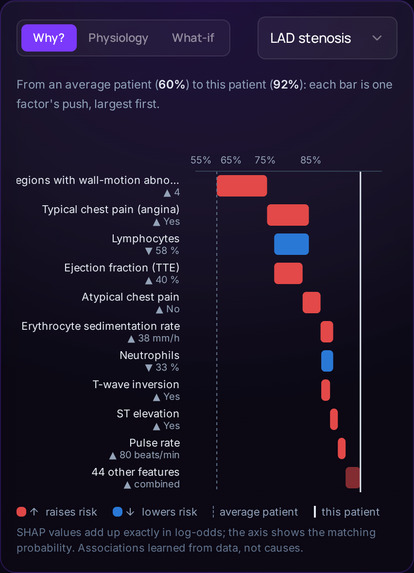
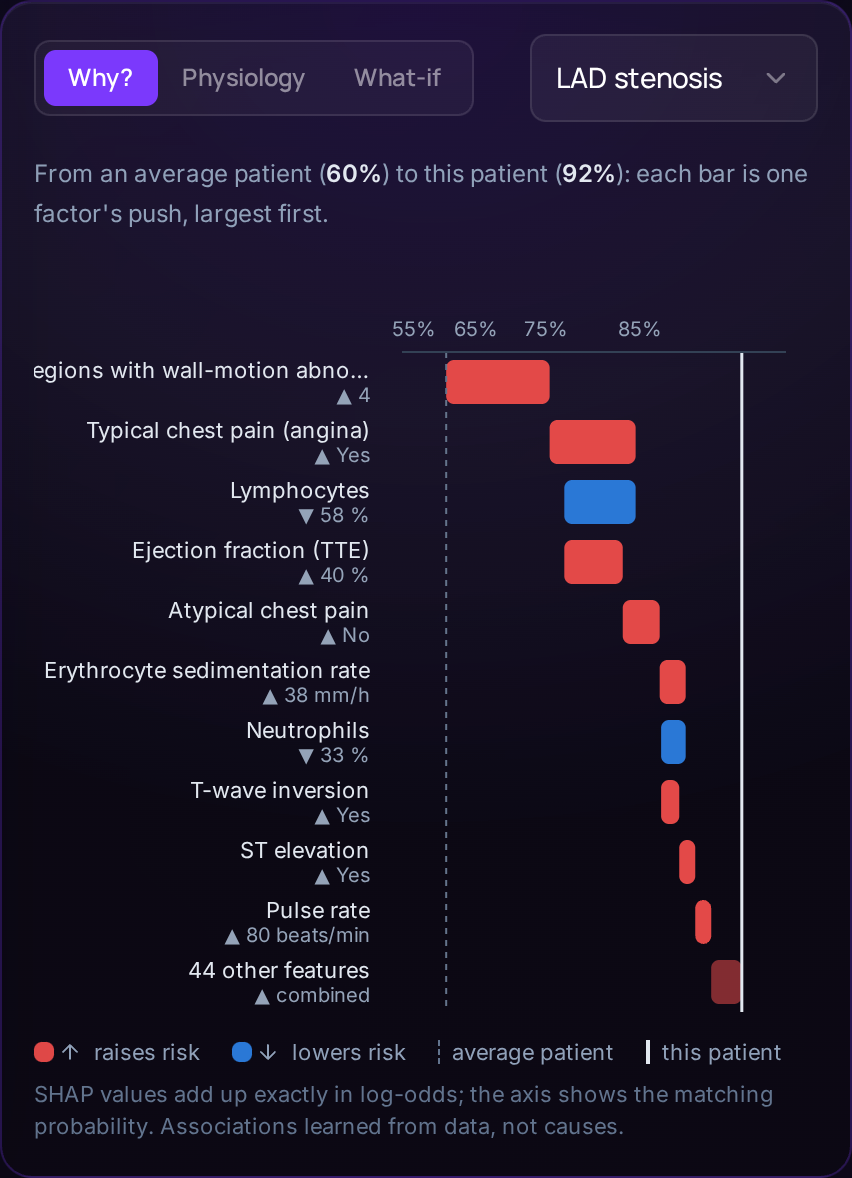
Why this prediction? Exact SHAP waterfall from the average patient (60%) to this patient (92%).
-
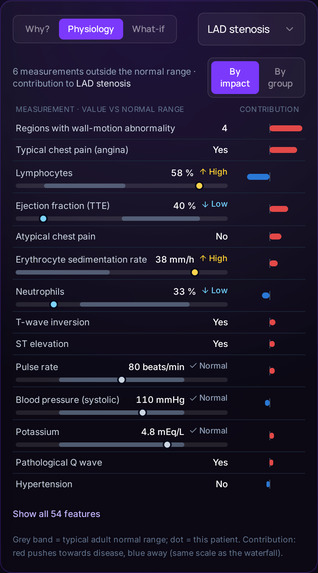
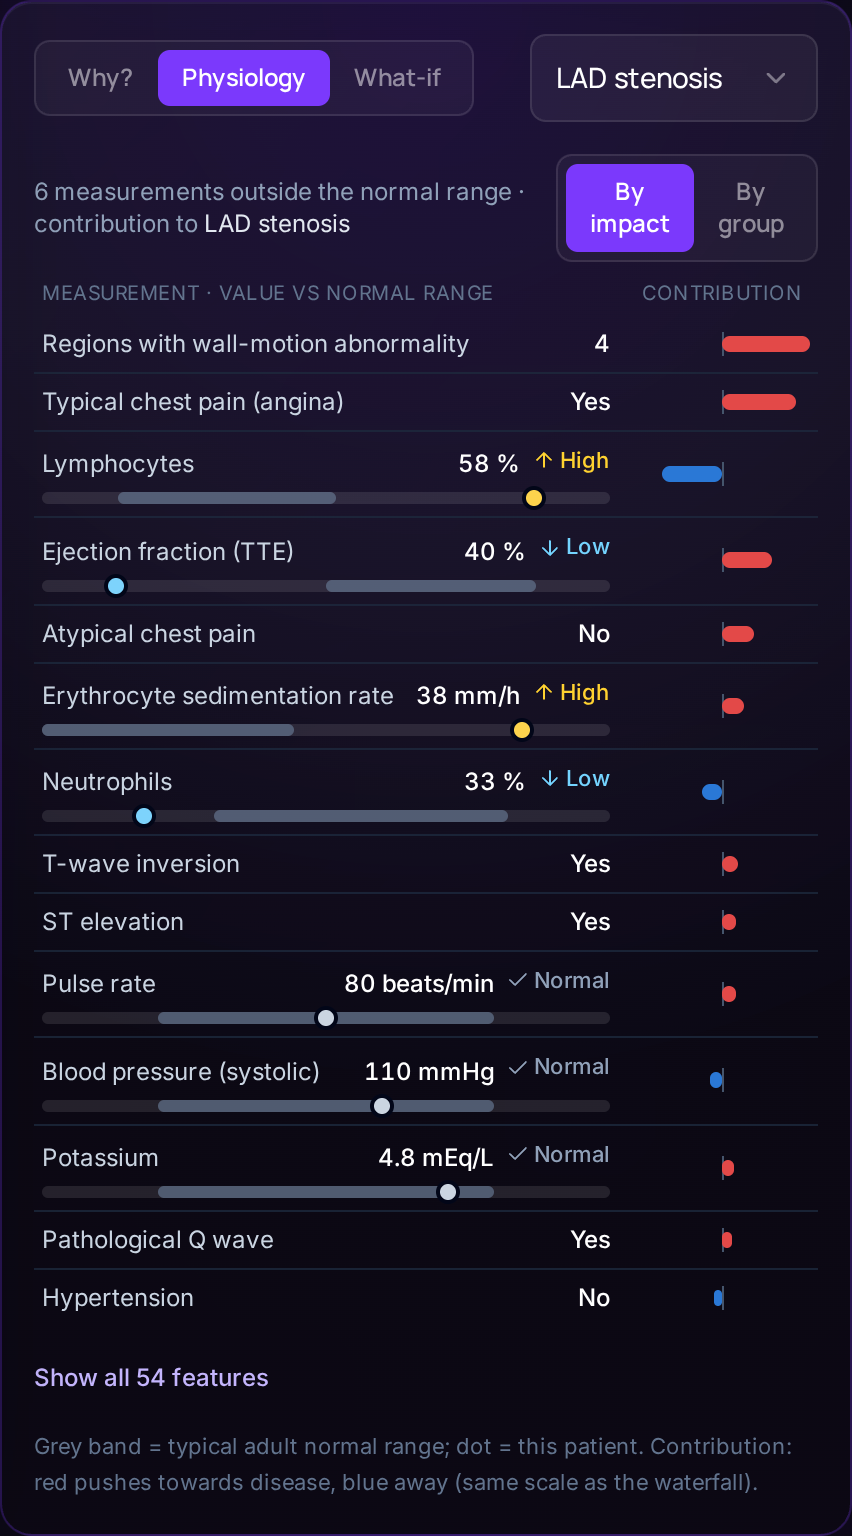
Every measurement against its normal range, beside its contribution to the prediction.
-
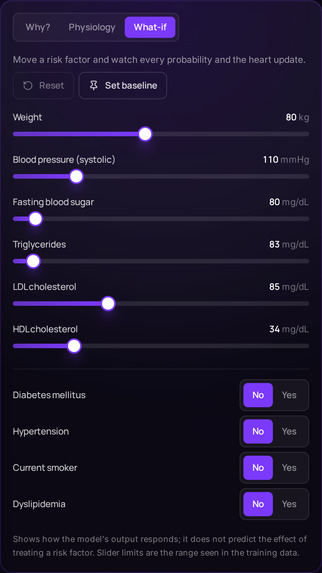
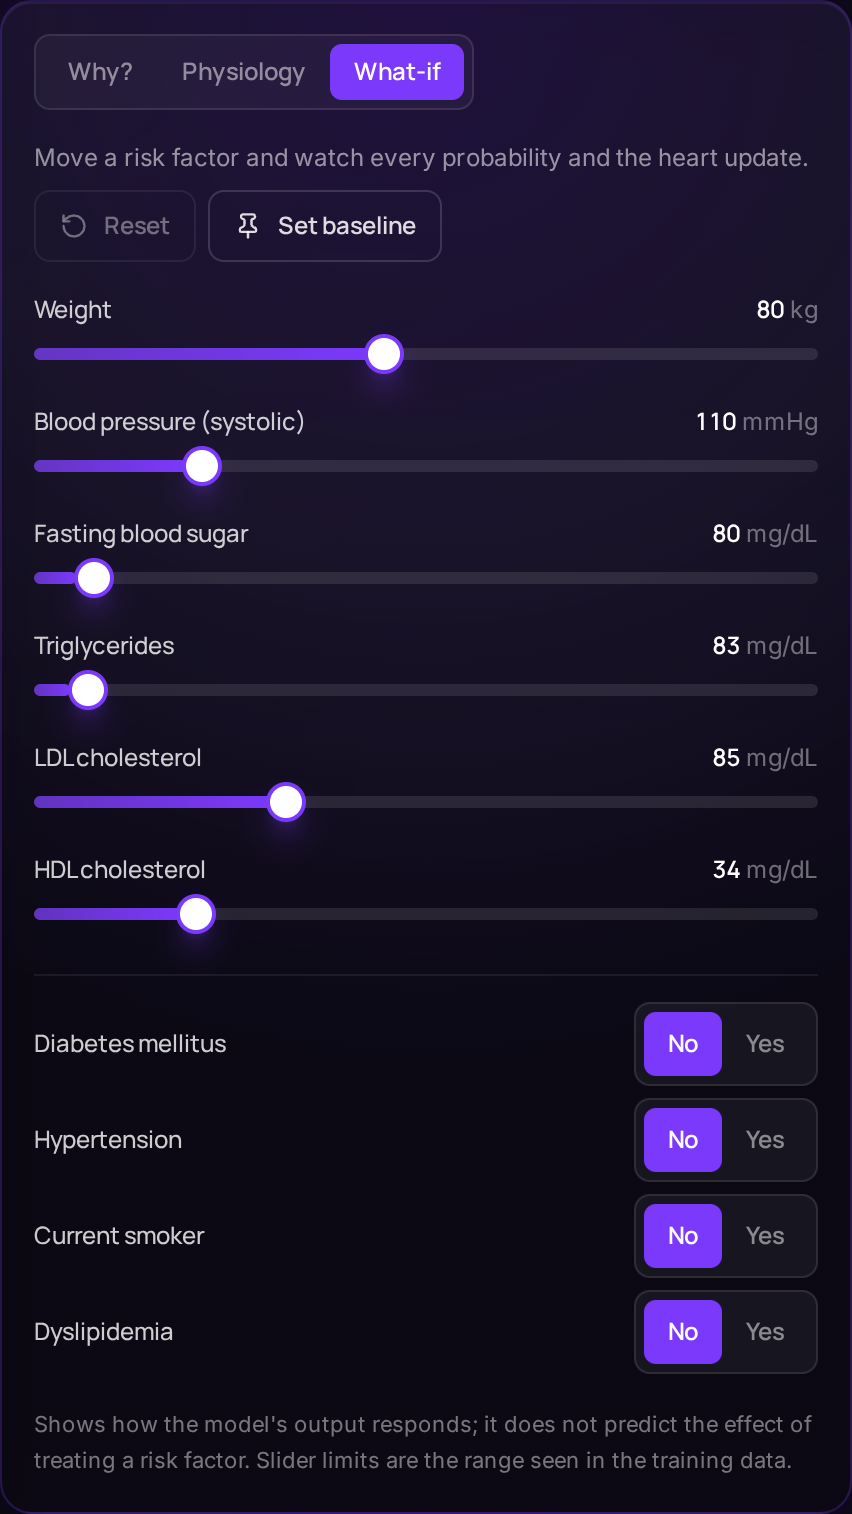
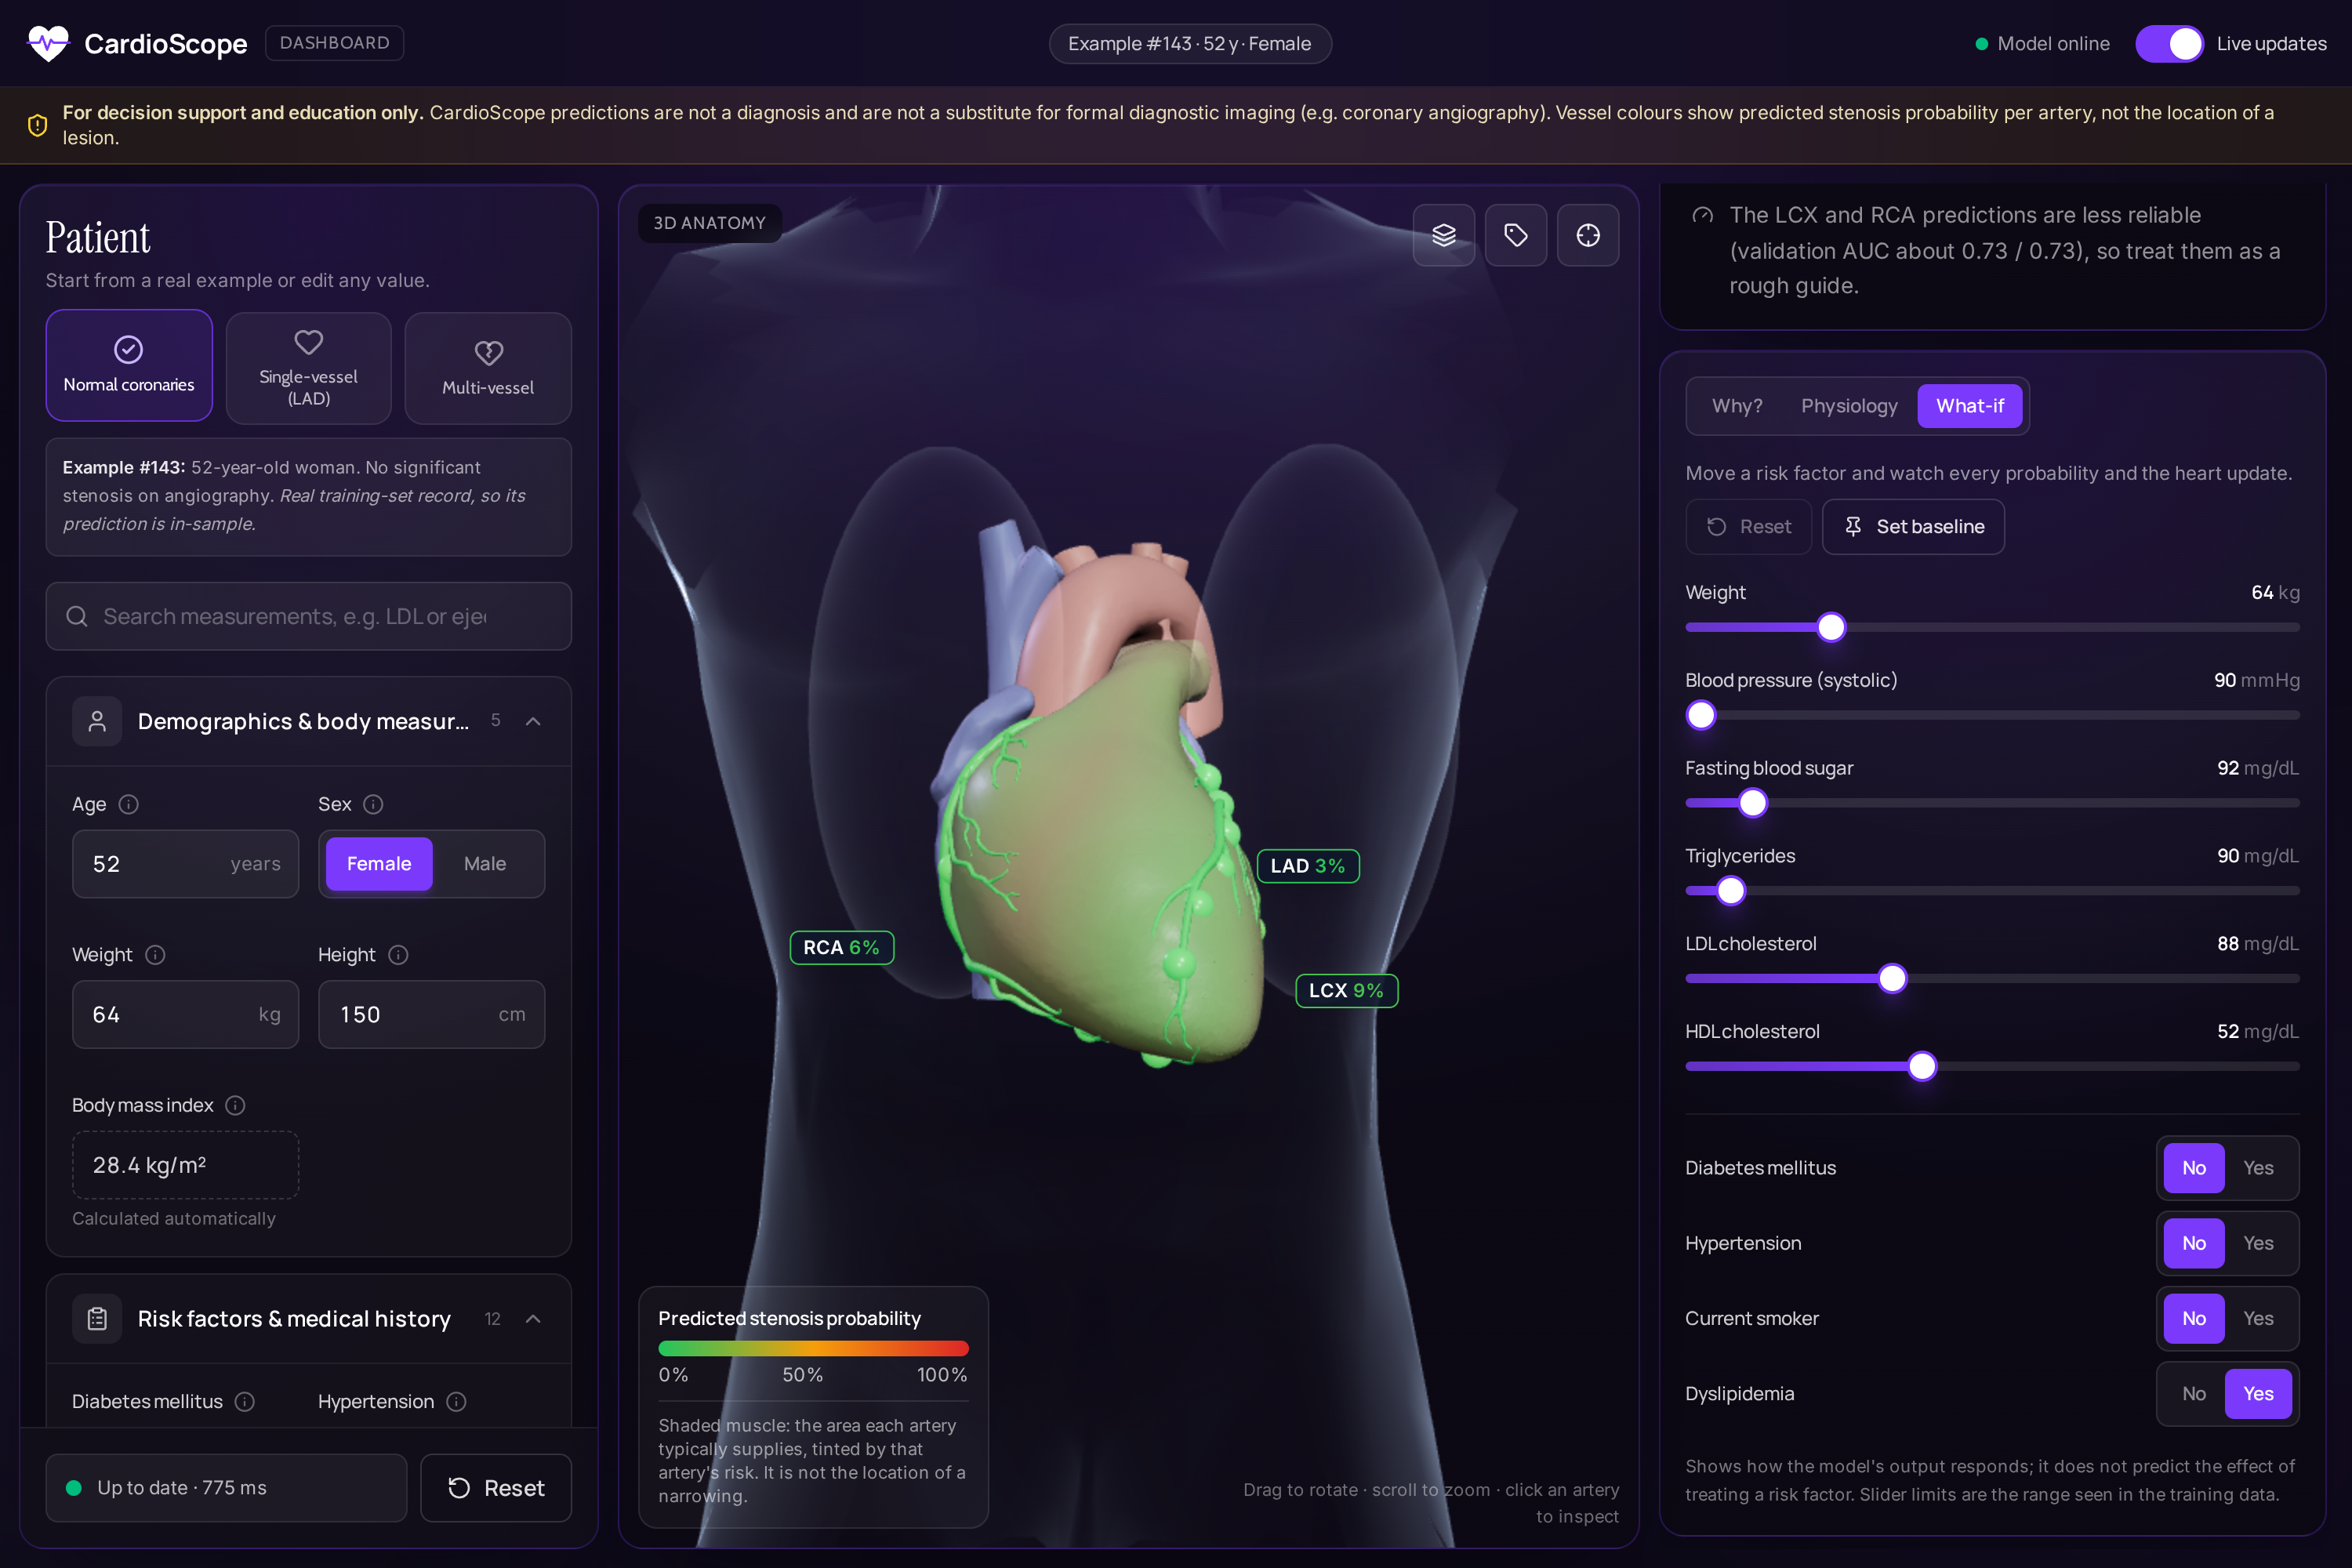
What-if sliders: change a value and the probabilities, explanations and 3D colours update in under a second.
-
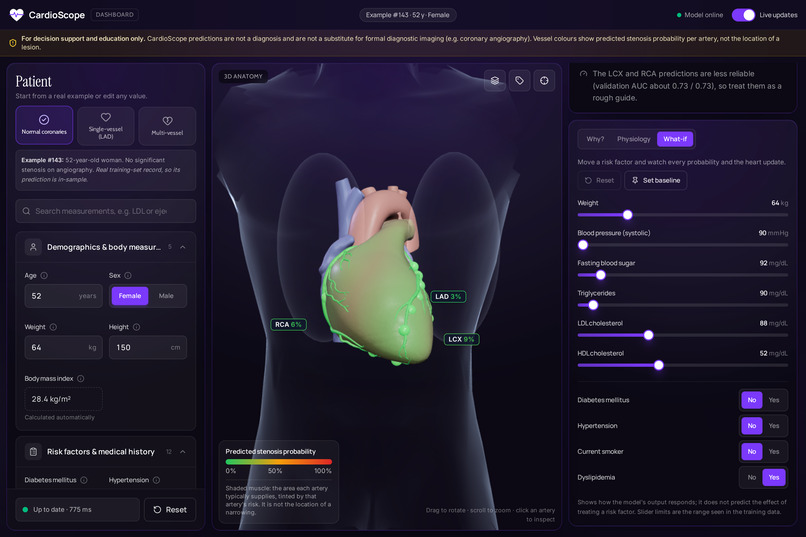
Normal coronaries: low risk everywhere, all green.
-
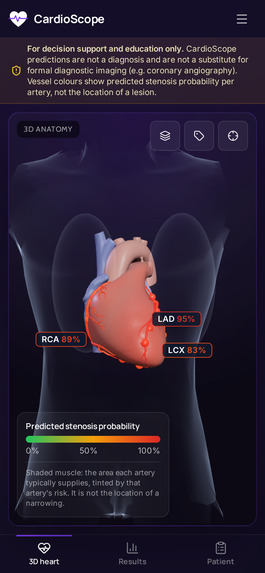
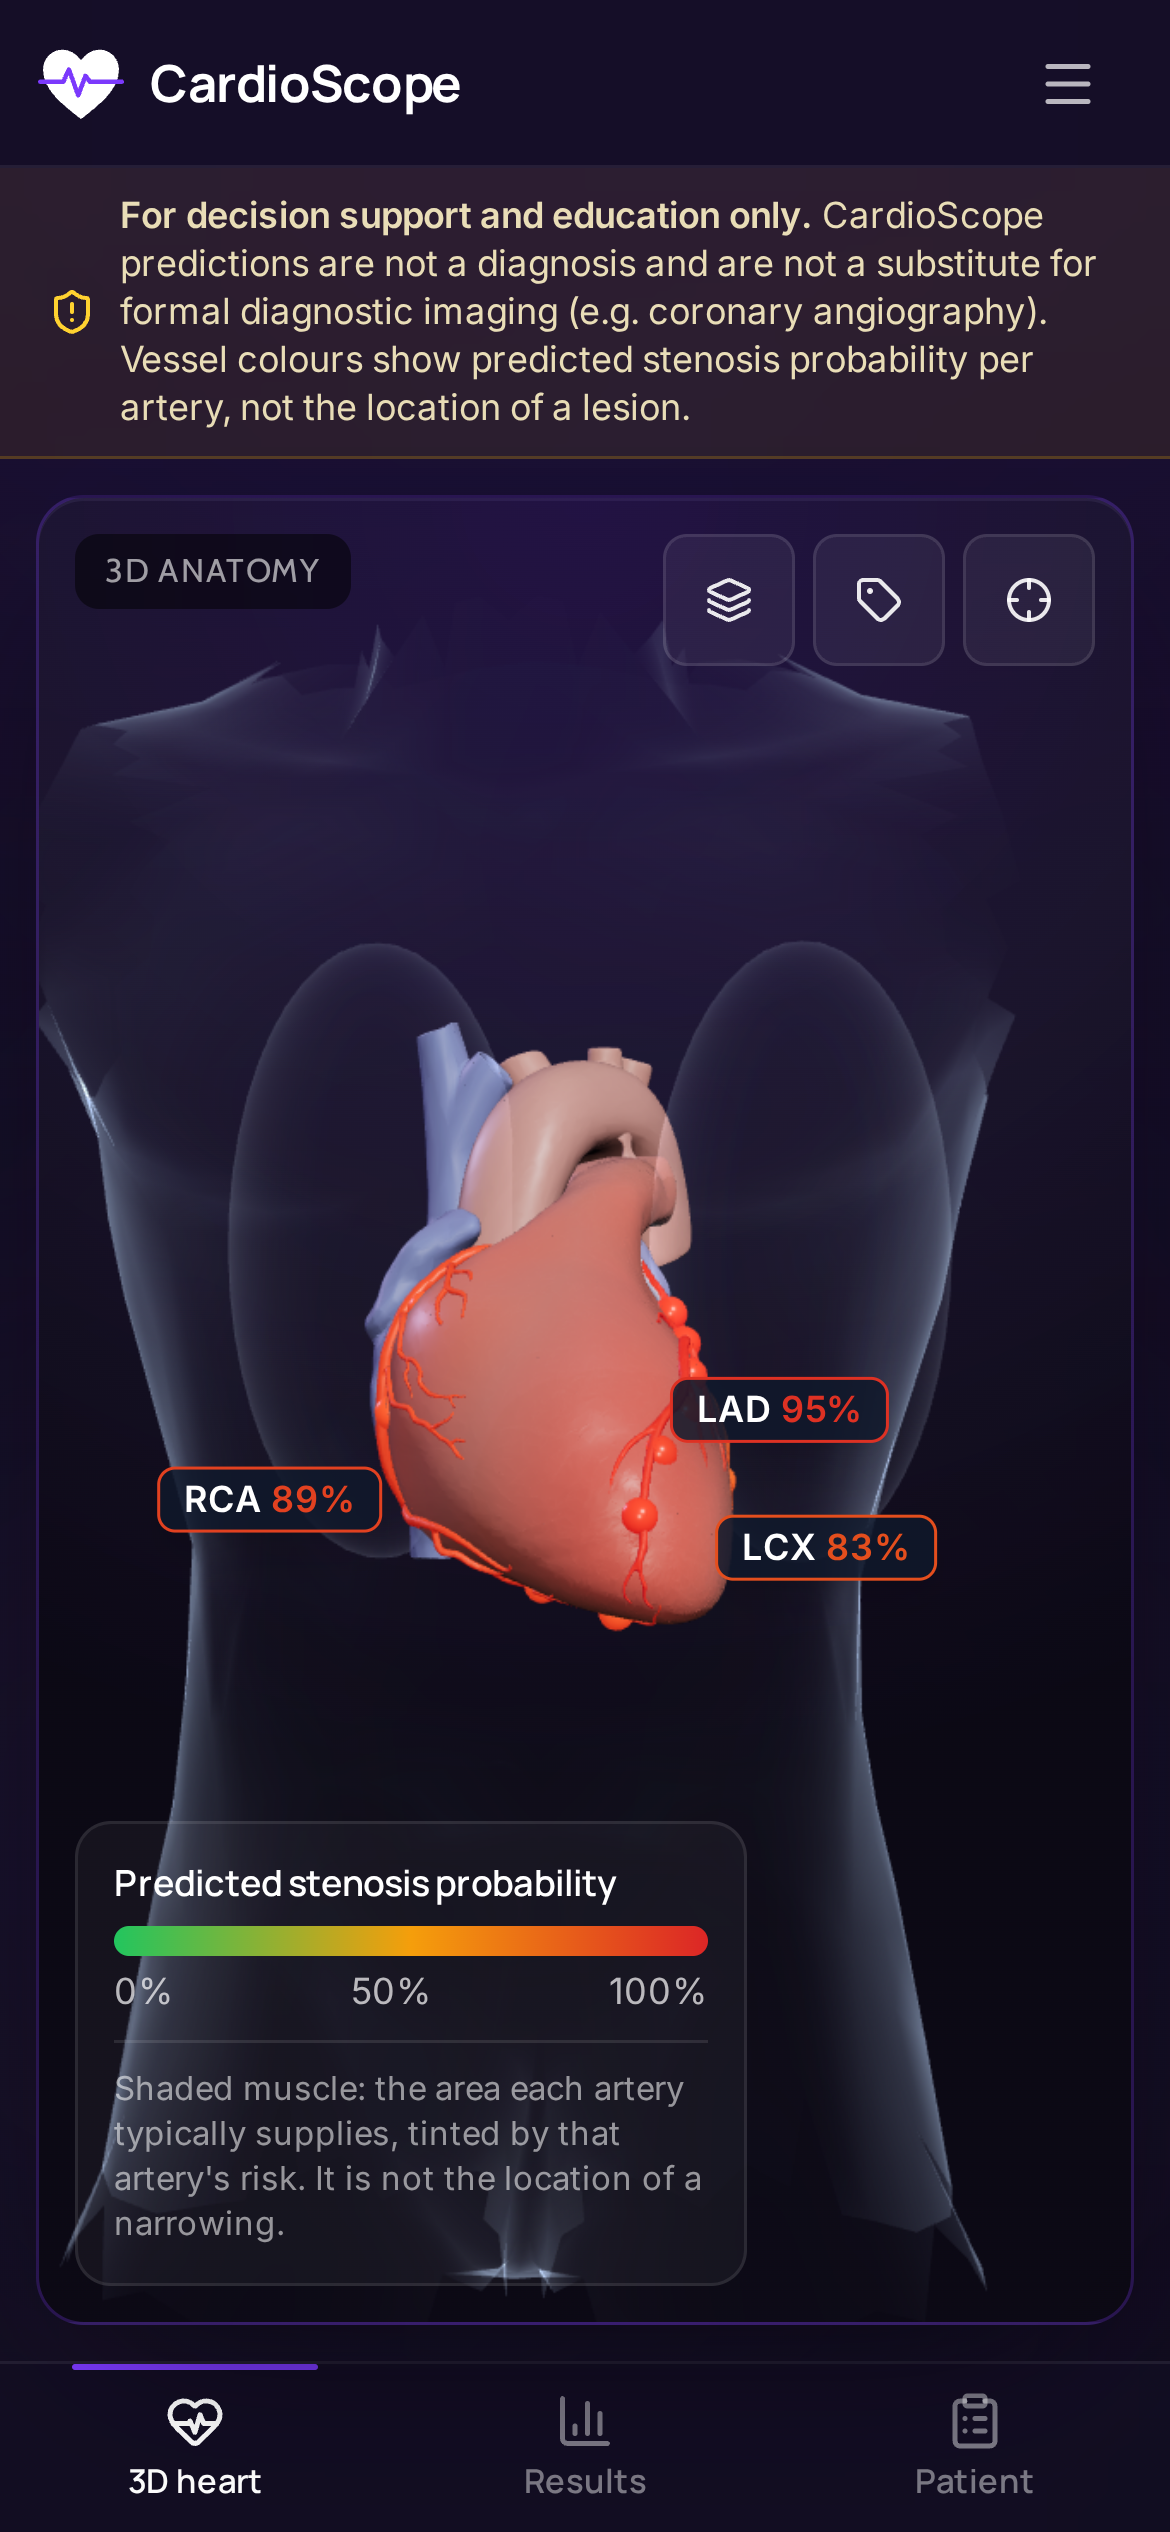
Works on phones too.
-
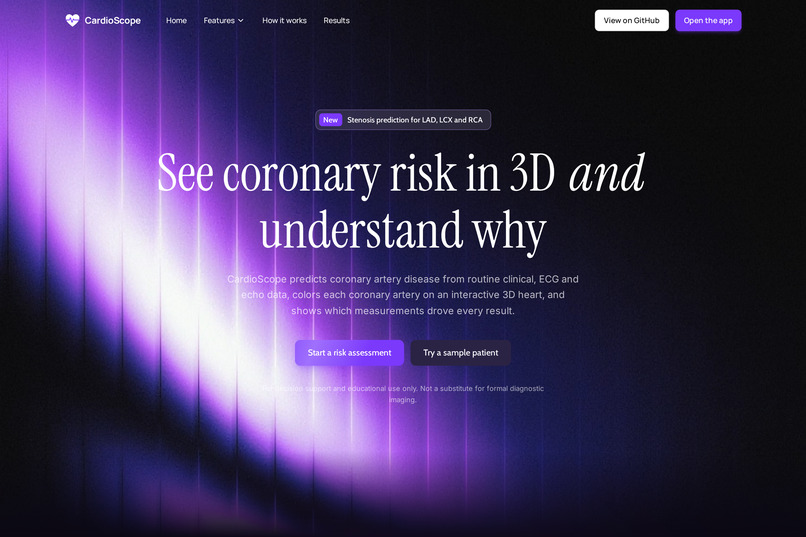
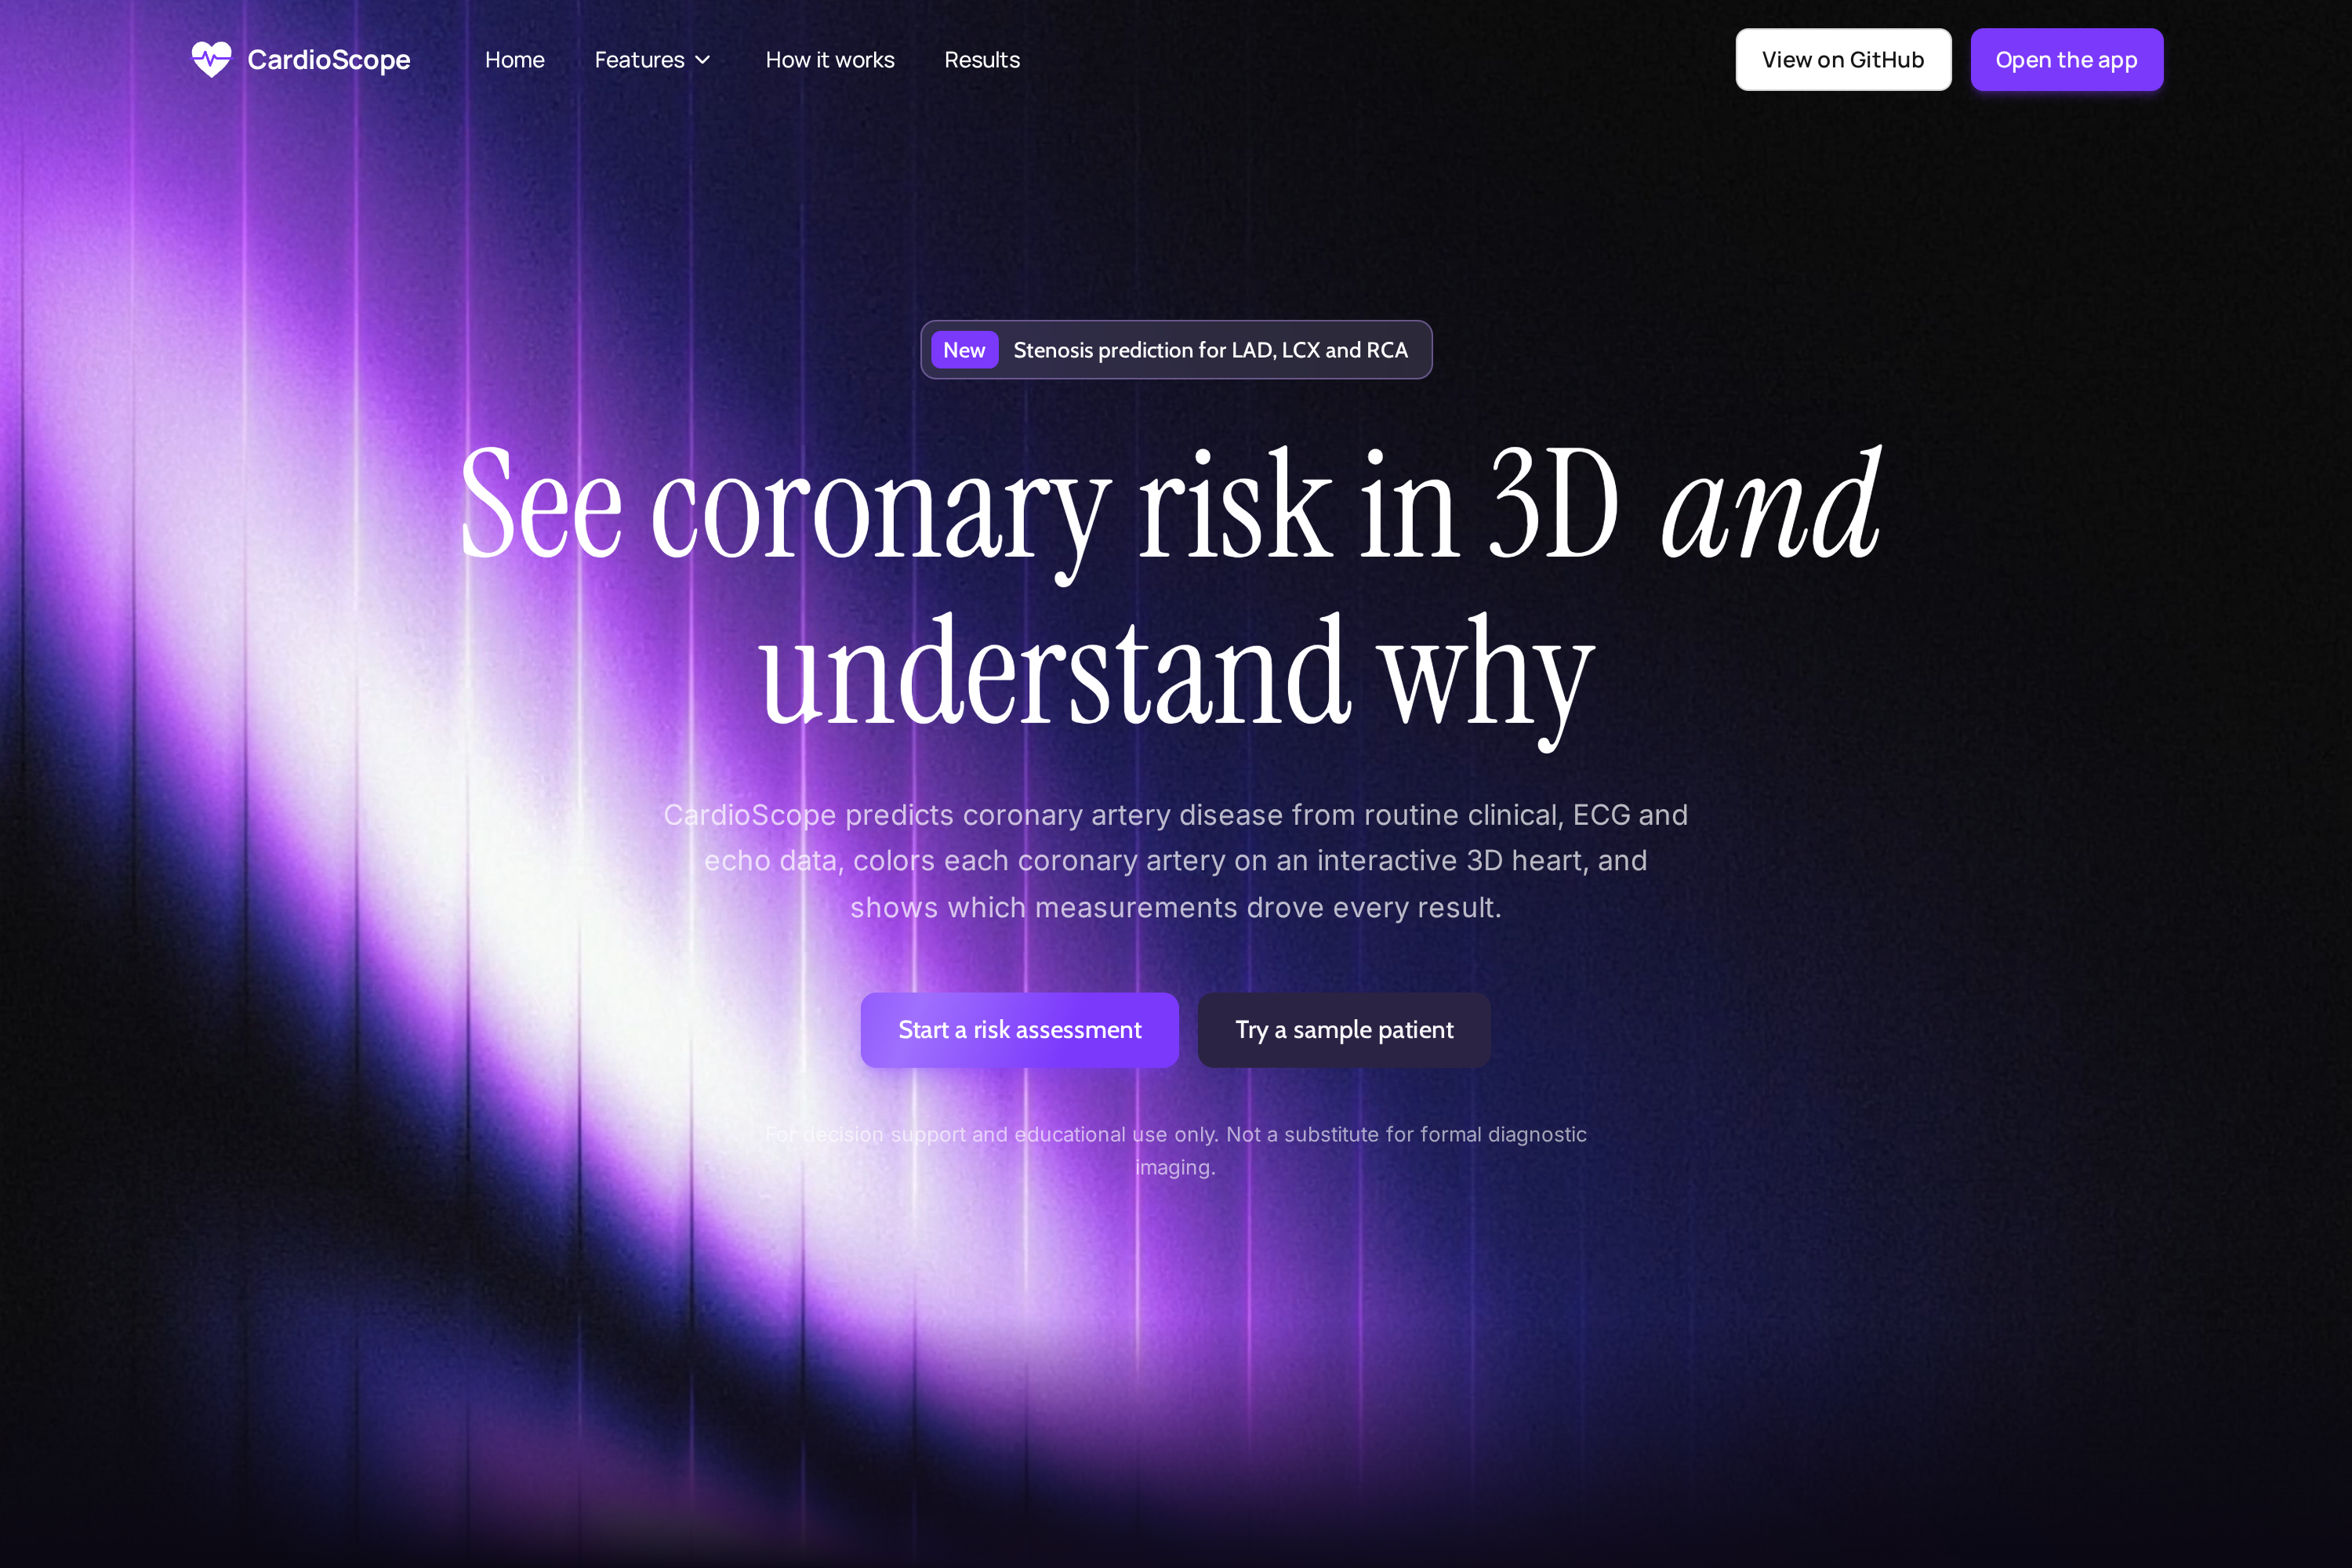
Landing page.
-
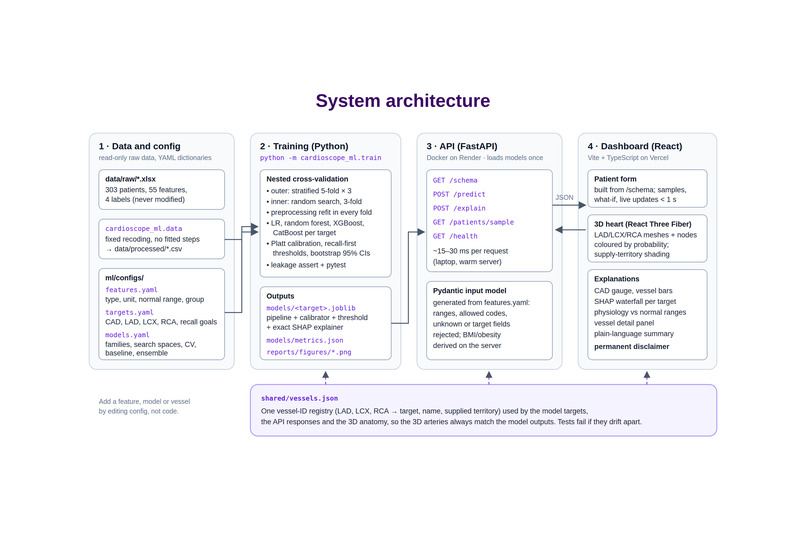
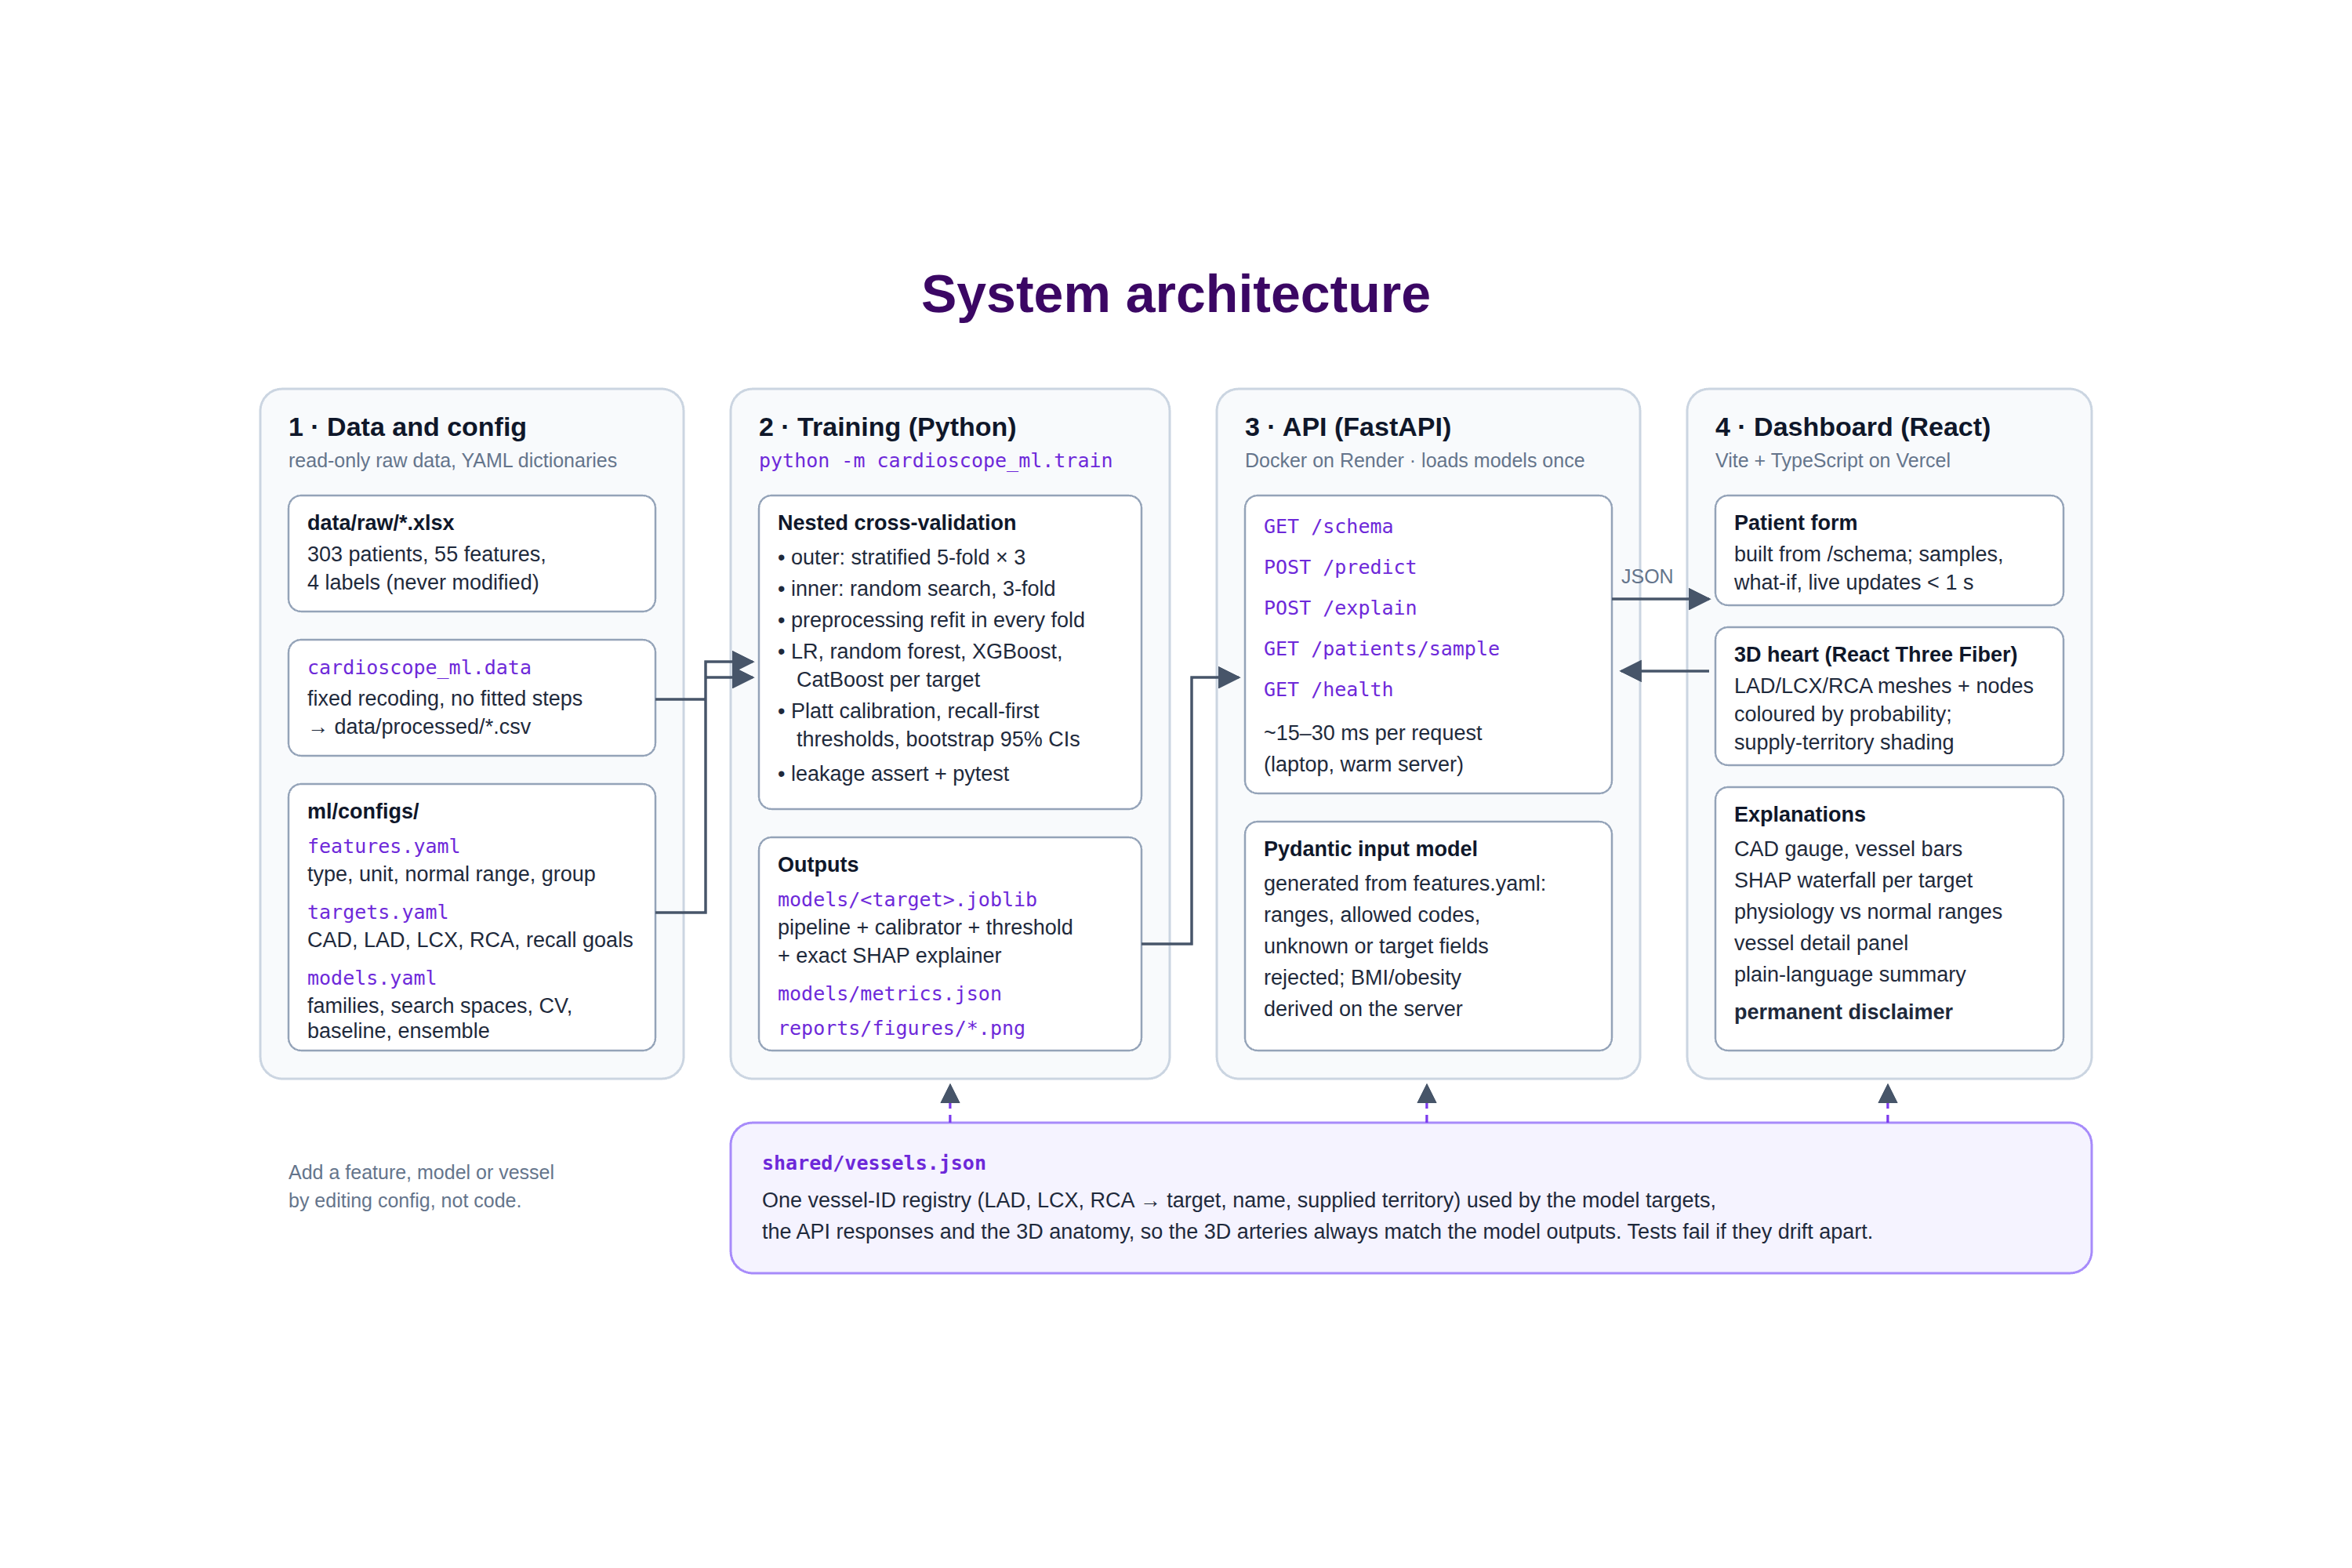
Architecture: one config-driven pipeline from data to 3D.
-
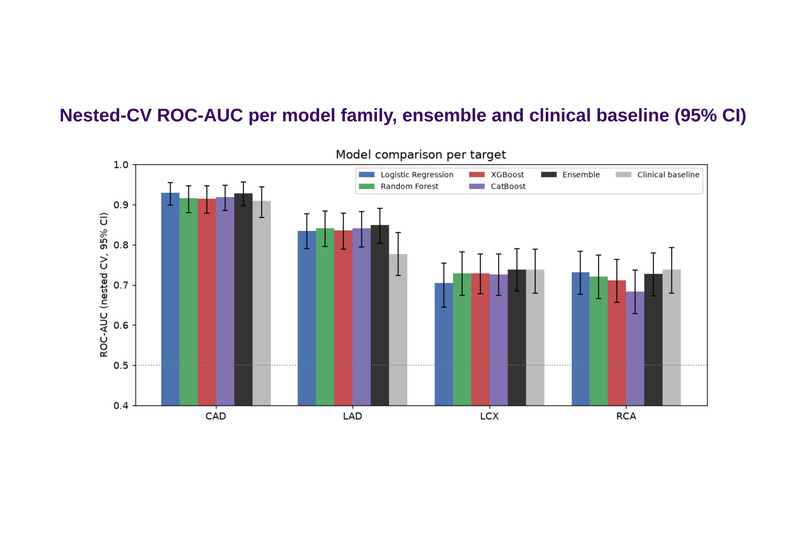
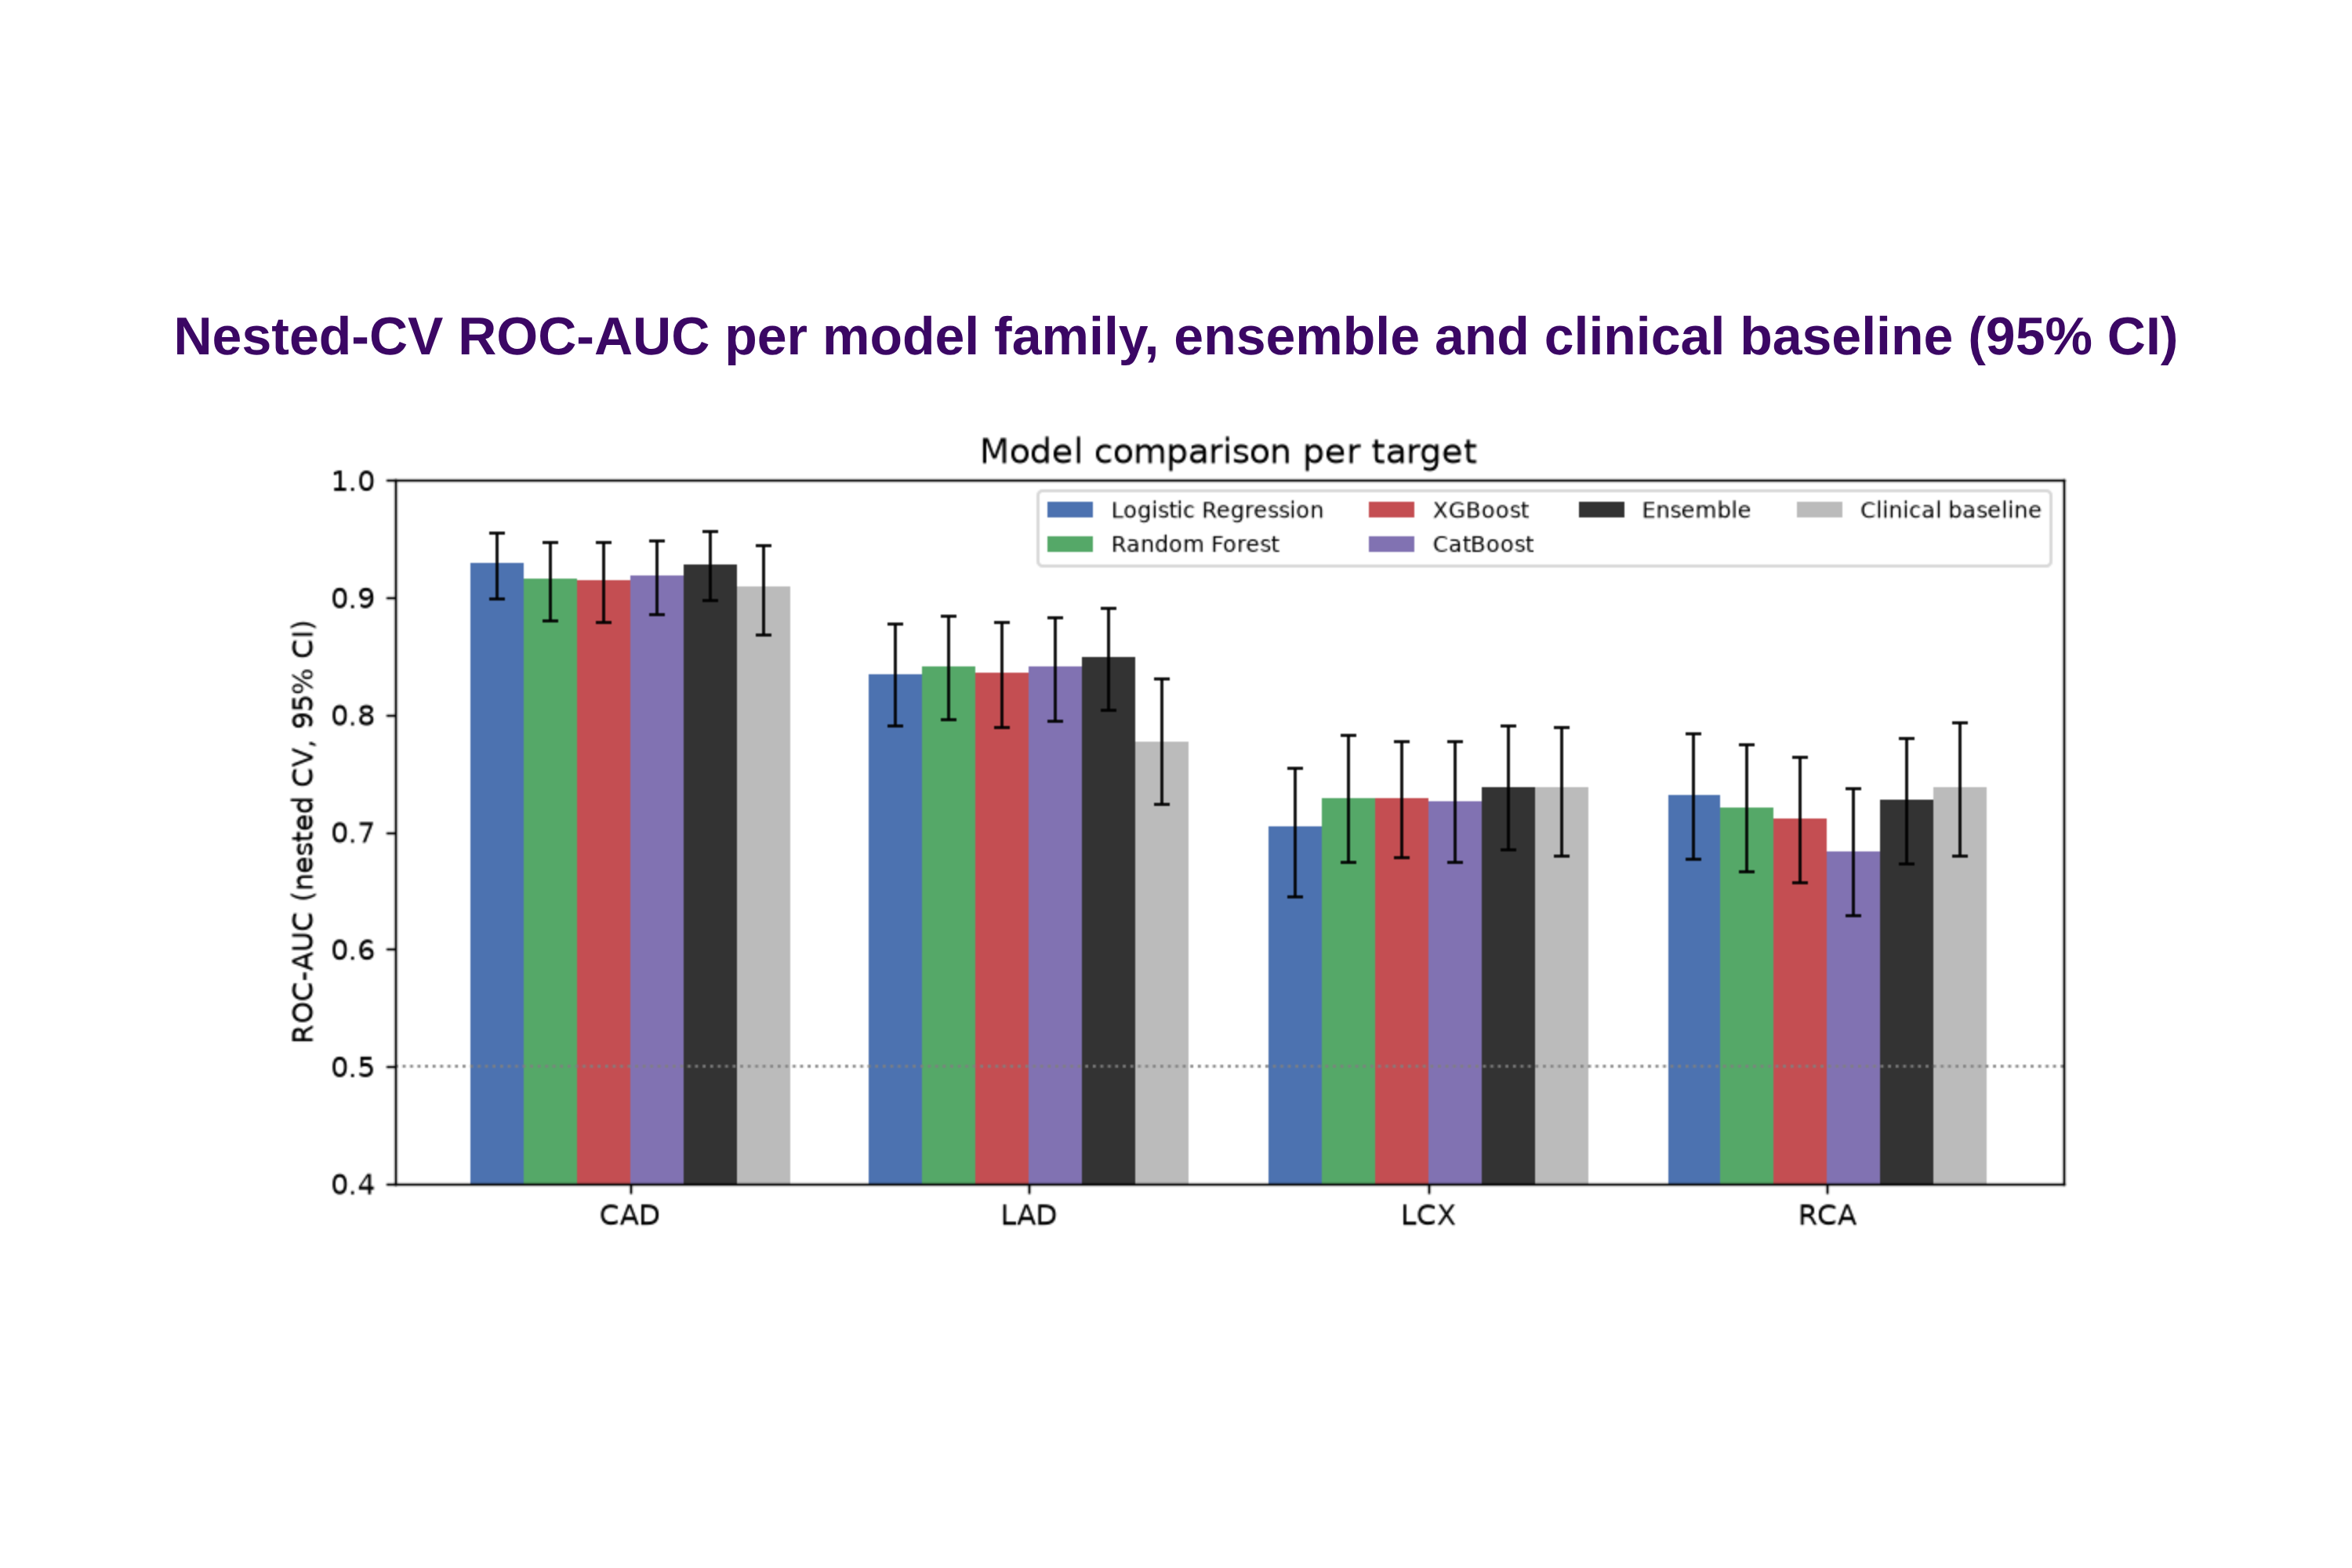
Nested-CV ROC-AUC per model, with ensemble and bedside baseline (95% CI).
-
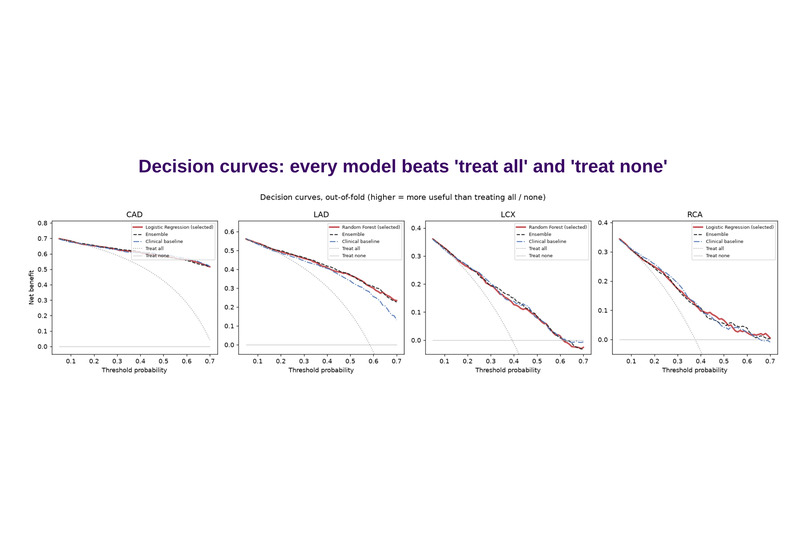
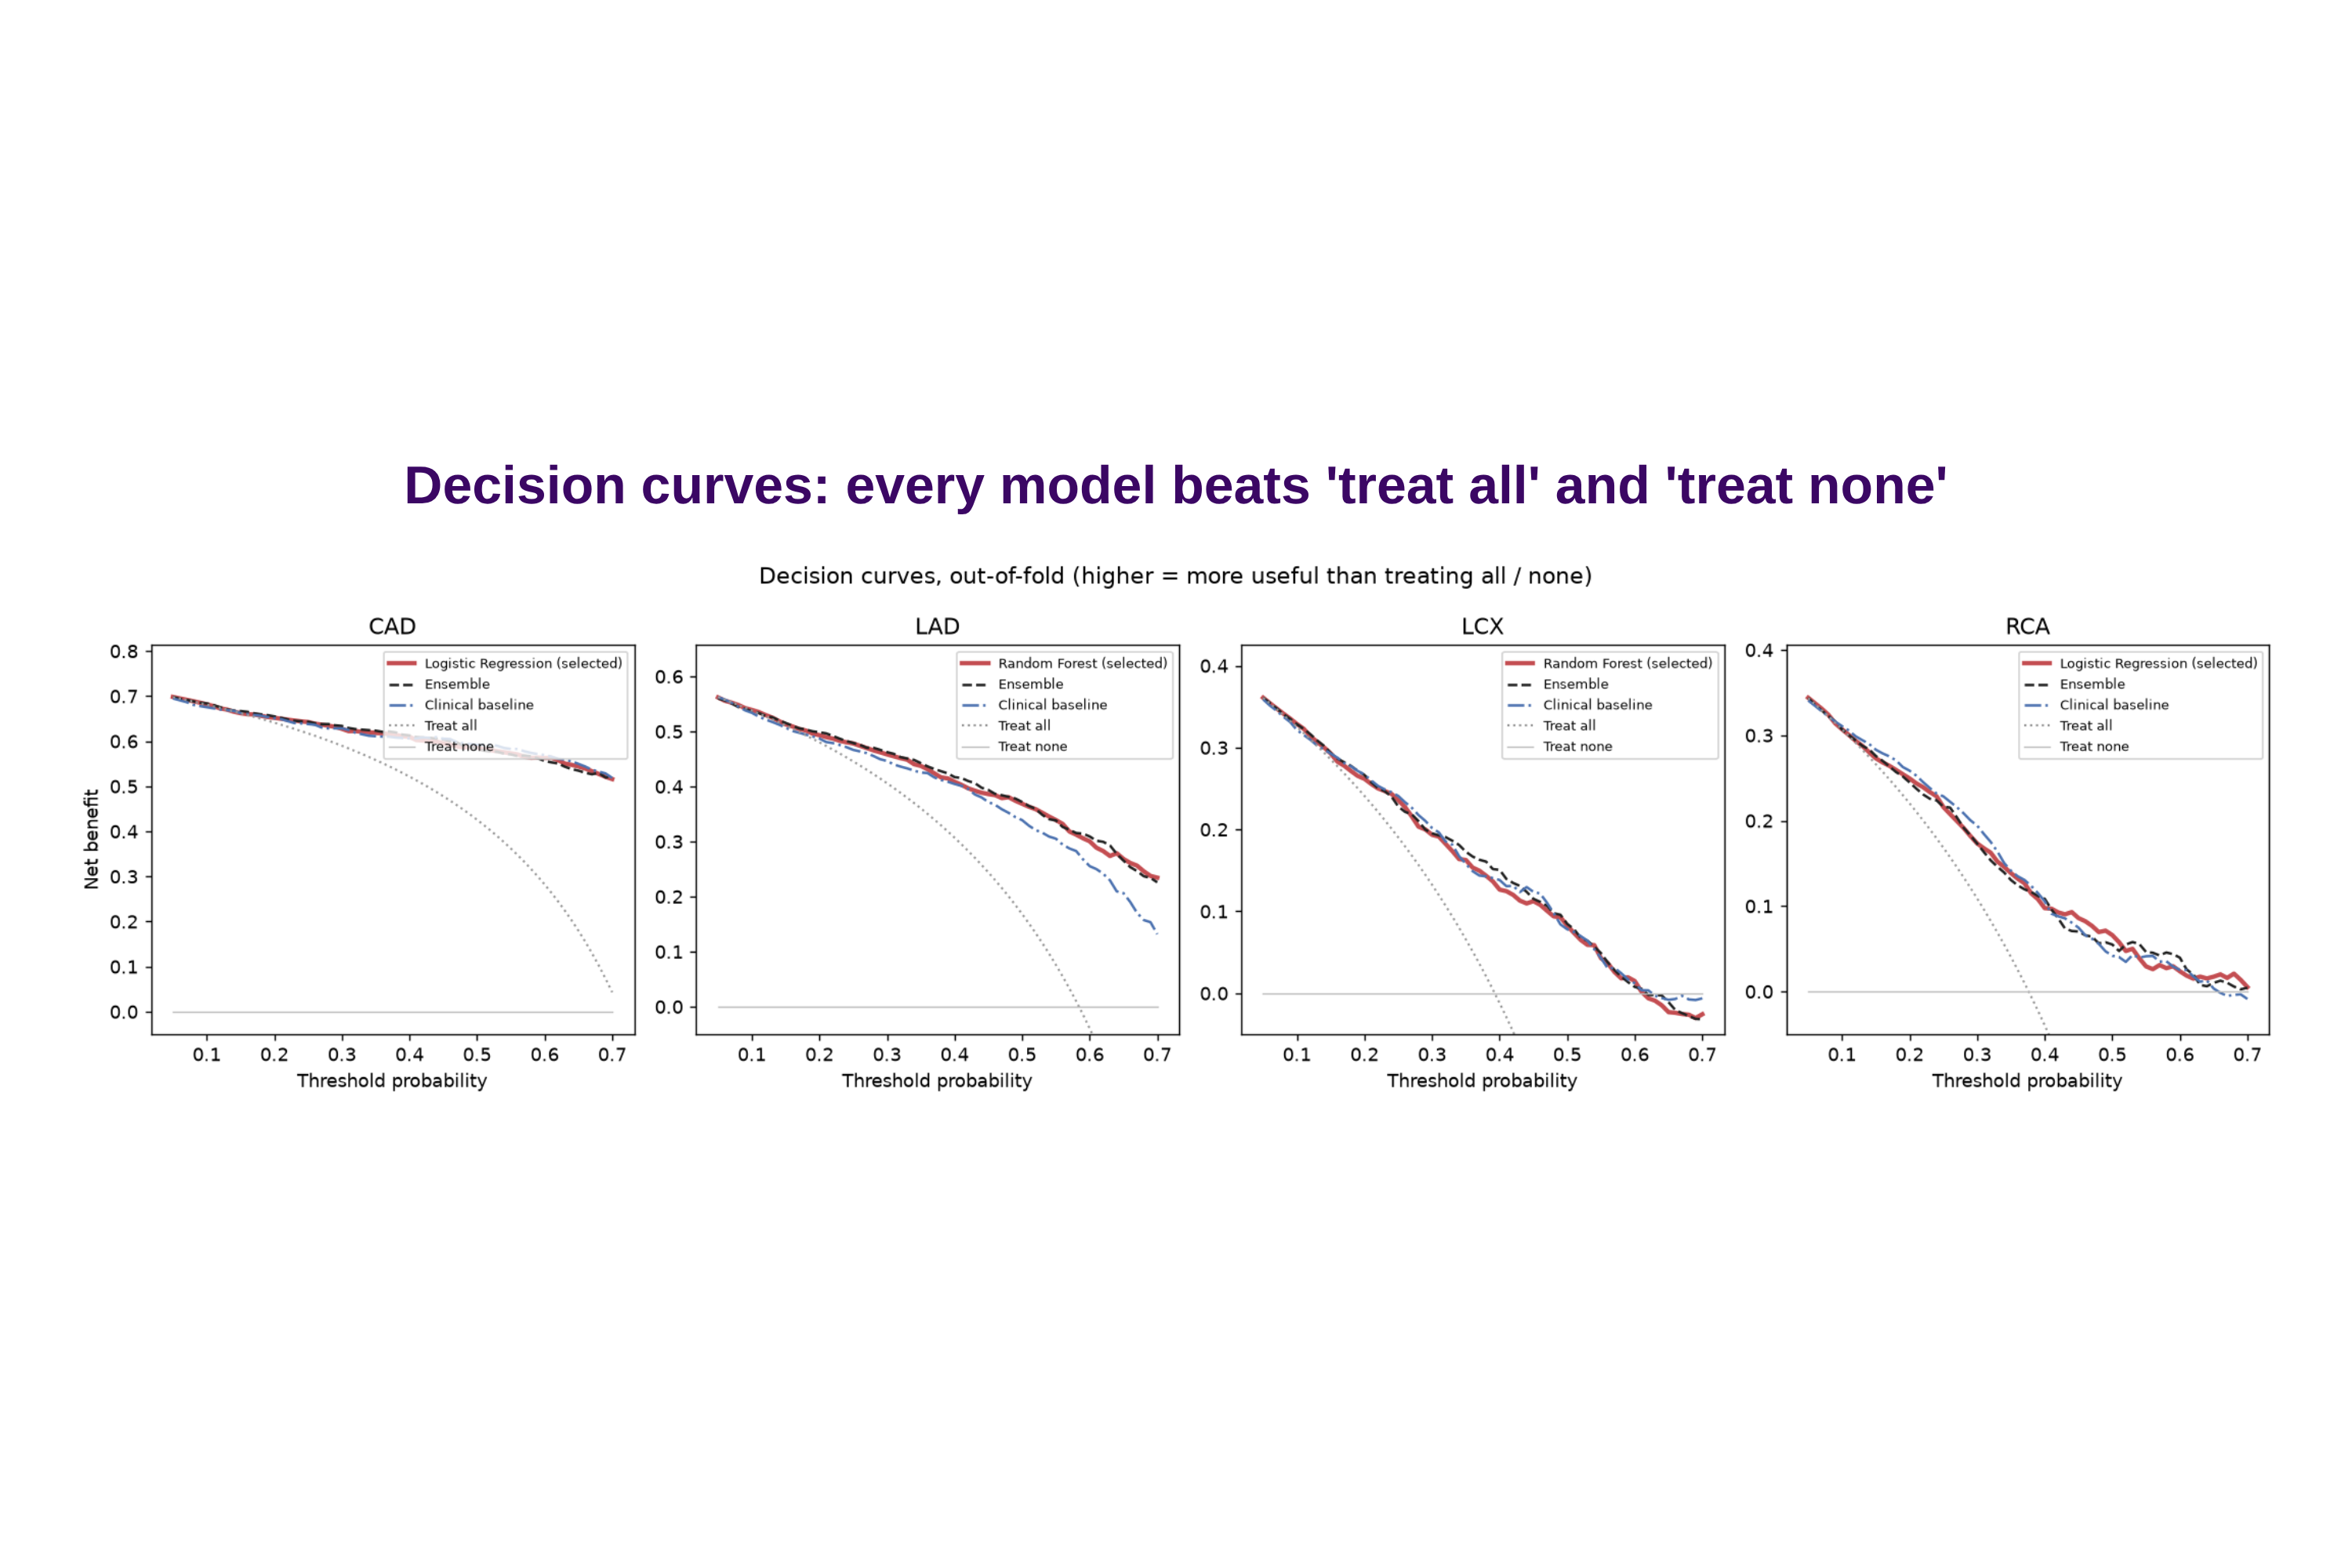
Decision curves: every model beats “treat all” and “treat none”.
Tagline
See coronary risk in 3D and understand why: per-artery stenosis prediction from routine clinical data, mapped onto an interactive heart.
Inspiration
Cardiovascular disease is still a leading cause of death. Risk models usually end in a single percentage, which tells a clinician or a patient little about where the problem may be or why the model thinks so. We wanted a tool that turns routine clinical data into an answer you can see and question.
What it does
CardioScope takes a patient's demographics, examination, ECG, lab and echocardiography values and predicts:
- the probability of overall coronary artery disease (CAD);
- the probability of significant stenosis in each of the three main arteries: LAD, LCX and RCA.
How the results are shown:
- Interactive 3D heart: each artery is coloured by its probability, from green through amber
to red, inside a transparent torso.
- The heart muscle each artery supplies is tinted with the same risk colour.
- You can rotate, zoom and click an artery to fly to it and see its details.
- Clinical dashboard:
- CAD gauge and per-vessel bars;
- an exact SHAP waterfall showing why the model predicted this risk;
- a physiology panel showing every measurement against its normal range, beside its contribution;
- a vessel detail panel;
- an "In plain words" summary.
- Live updates: editing any value or moving a what-if slider updates the probabilities, the explanations and the 3D colours in under a second.
- Example patients: one click loads real normal, single-vessel and multi-vessel patients.
- Disclaimer: a permanent banner says it is for decision support and education only, not a substitute for angiography. We predict per-vessel status, not lesion location.
How we built it
Data:
- The Extension of Z-Alizadeh Sani dataset (UCI): 303 patients, 54 model features.
features.yamldescribes every feature: type, unit, normal range and group. The same file drives training, API validation and the dashboard form.
Machine learning (Python, scikit-learn, XGBoost, CatBoost):
- For each of the four targets we compare logistic regression, random forest, XGBoost and CatBoost.
- Nested cross-validation: repeated stratified 5-fold × 3, with hyper-parameter tuning in an inner loop. All preprocessing is refit inside every fold.
- Calibration and thresholds: Platt calibration; decision thresholds tuned for recall (≥ 90 % CAD, ≥ 80 % vessels); bootstrap 95 % confidence intervals.
- Leakage guard: an automated check stops LAD/LCX/RCA/Cath from ever being inputs.
- Exact SHAP: native TreeSHAP for trees, exact linear SHAP for logistic regression.
- Extra evaluation:
- a 10-item bedside baseline;
- a pre-specified ensemble;
- decision-curve analysis;
- a subgroup check by sex, age and diabetes.
- One command trains everything, and two runs give identical results.
Backend:
- FastAPI with
/schema,/predict,/explainand/patients/sample. - The input model is generated from the feature config.
- Deployed as a Docker service on Render.
Frontend:
- React + TypeScript + React Three Fiber, deployed on Vercel.
- The heart is a sculpted CC-licensed model, split into separate LAD/LCX/RCA meshes and compressed to 438 KB.
- Rendering happens on demand, so it runs smoothly on an ordinary laptop with no GPU.
- One shared
vessels.jsonkeeps the 3D arteries, API and model outputs consistent.
Quality: 111 automated tests (ML, API, frontend) run in GitHub Actions on every push.
Results (nested CV, mean [95 % CI])
| Target | ROC-AUC |
|---|---|
| Overall CAD | 0.93 [0.90–0.96] |
| LAD | 0.84 [0.80–0.88] |
| LCX | 0.73 [0.67–0.78] |
| RCA | 0.73 [0.68–0.78] |
- Every model beats "treat all" and "treat none" in decision-curve analysis.
- For LAD the full model clearly beats a bedside baseline (+0.064 AUC).
- For LCX and RCA it does not, and we say so.
Challenges we ran into
- Honest validation on only 303 patients. We used nested CV, paired comparisons and bootstrap CIs instead of chasing a single high score.
- Mapping risk to anatomy without overclaiming. The data gives per-vessel status, not lesion position, so the 3D view colours whole arteries and their supply territories. It never shows a "lesion spot".
- A calibration solver that could diverge on spread-out scores. We found it, fixed it with a line search and added a regression test.
- Security software: Windows Smart App Control blocked scikit-learn on our machine, so training moved to Linux (WSL), which also matches the deployed server.
Accomplishments that we're proud of
- Explanations are exact: SHAP contributions add up to each displayed probability.
- One config-driven pipeline from data to 3D. Adding a feature, model or vessel is a config change.
- Under-a-second live what-if updates on a free deployment.
What we learned
On small clinical datasets, simple well-calibrated models are as good as complex ones. Honest uncertainty (CIs, reliability notes, subgroup gaps) builds more trust than a single big number.
What's next for CardioScope
- External validation on a second hospital's data, under ethics approval and with clinical partners.
- Vessel-specific inputs, e.g. coronary CT or perfusion imaging, to improve LCX/RCA.
- Patient-specific anatomy.


Log in or sign up for Devpost to join the conversation.