-
-
-
-
-
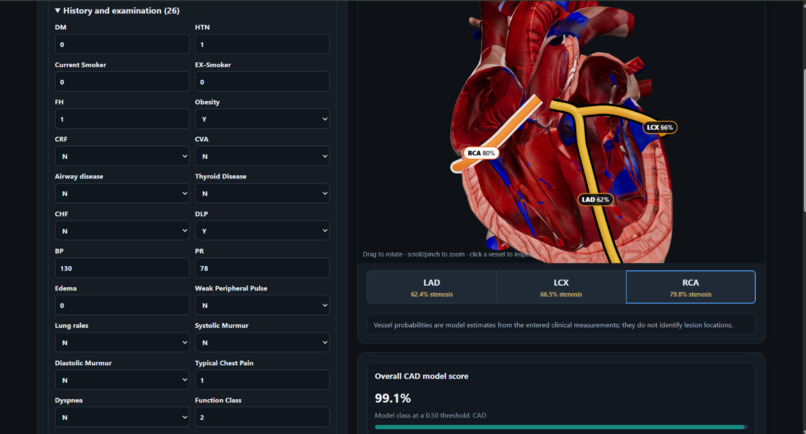
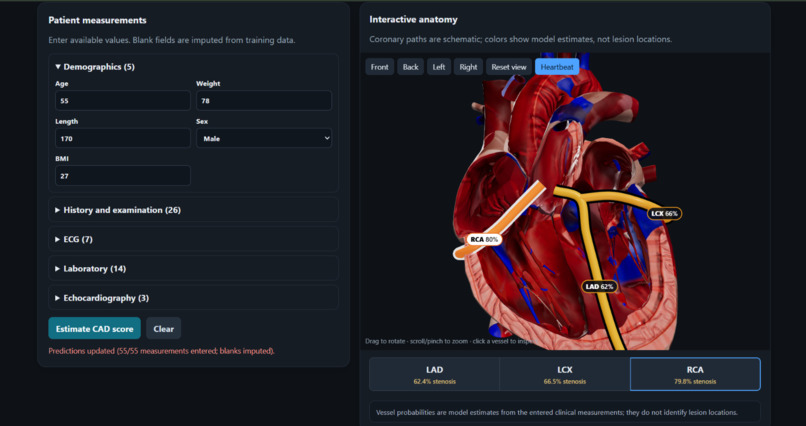
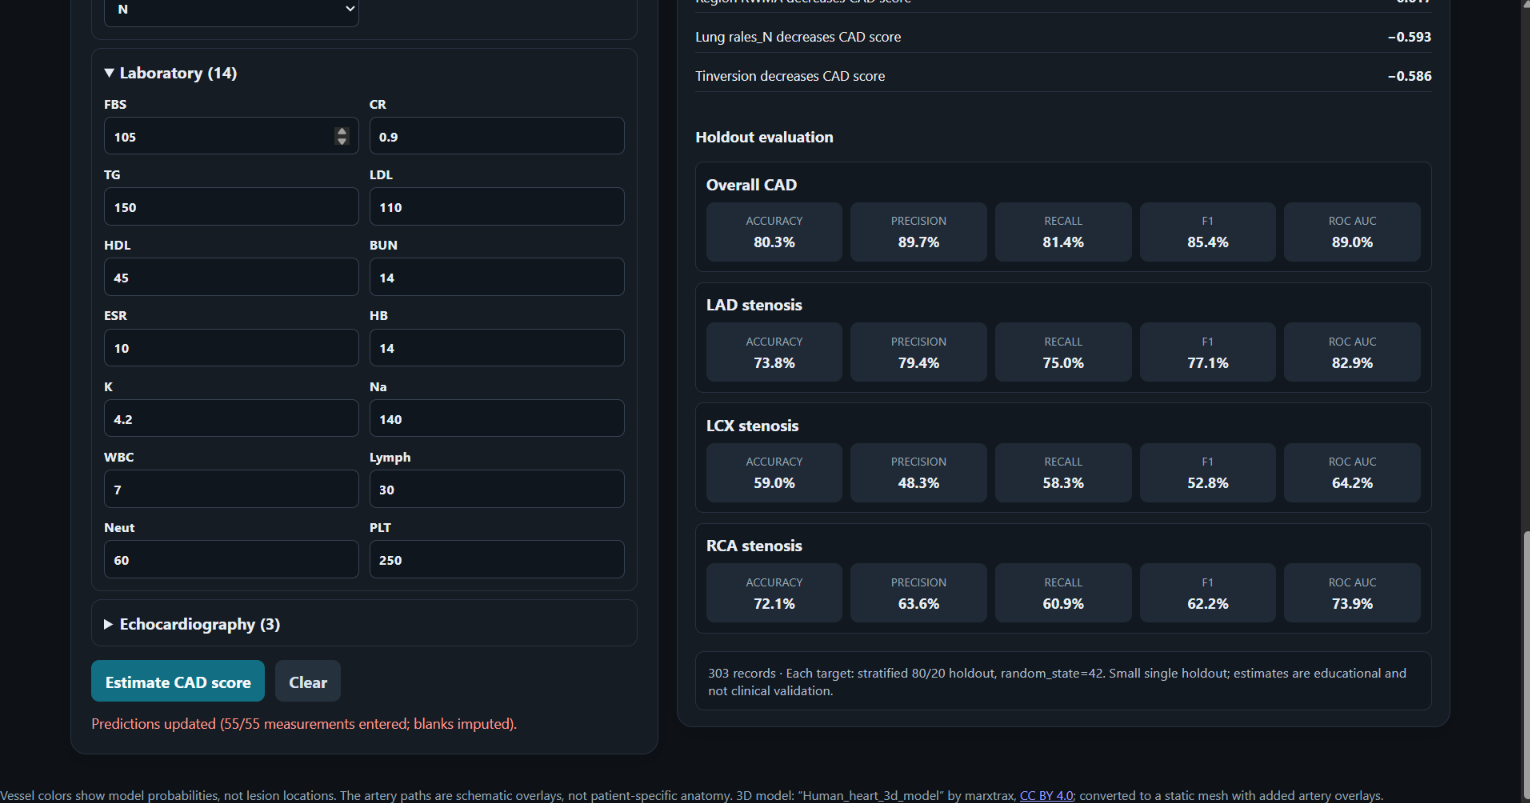
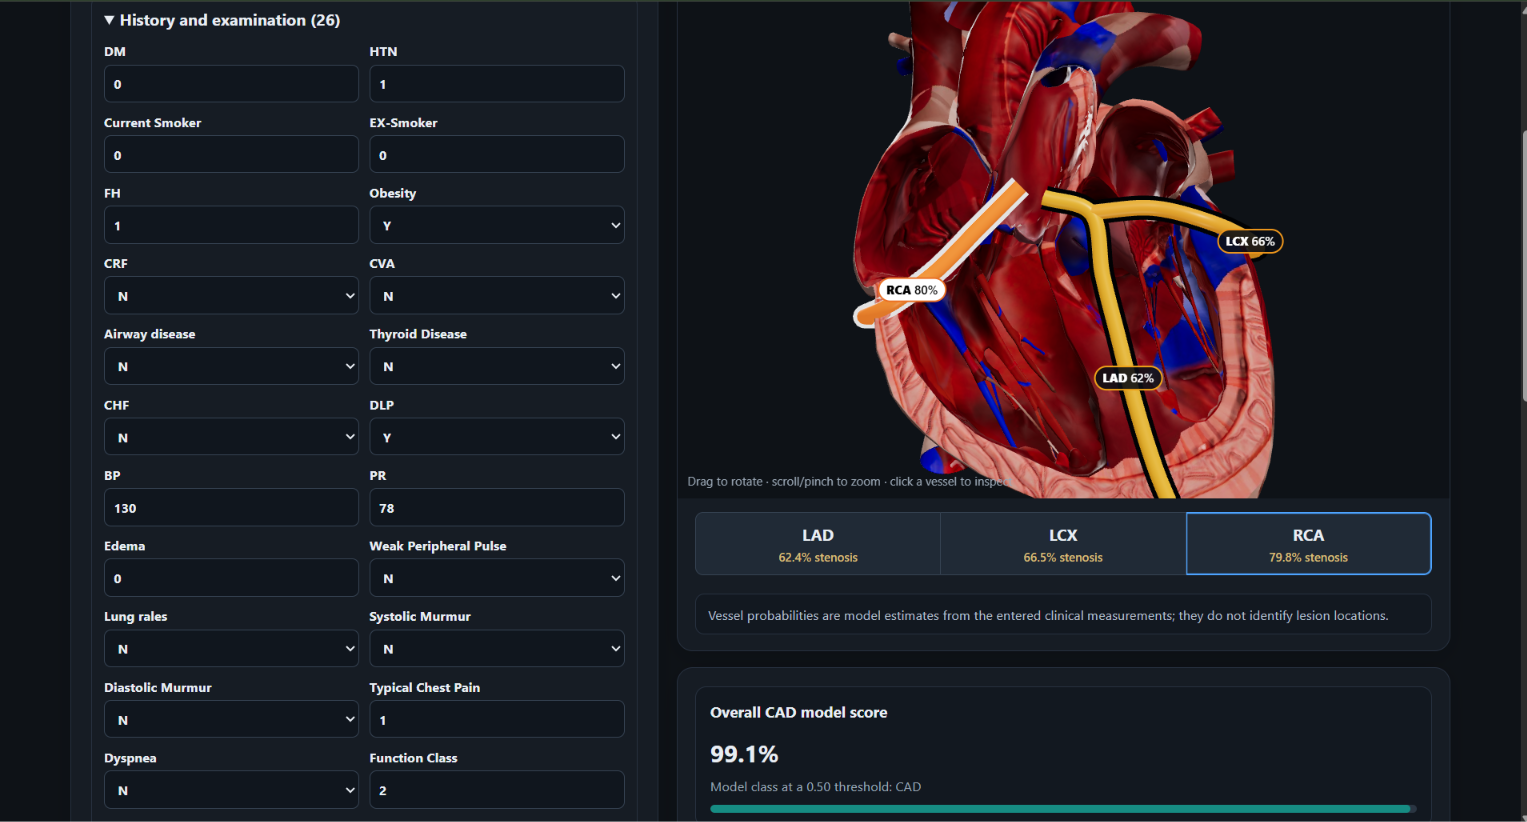
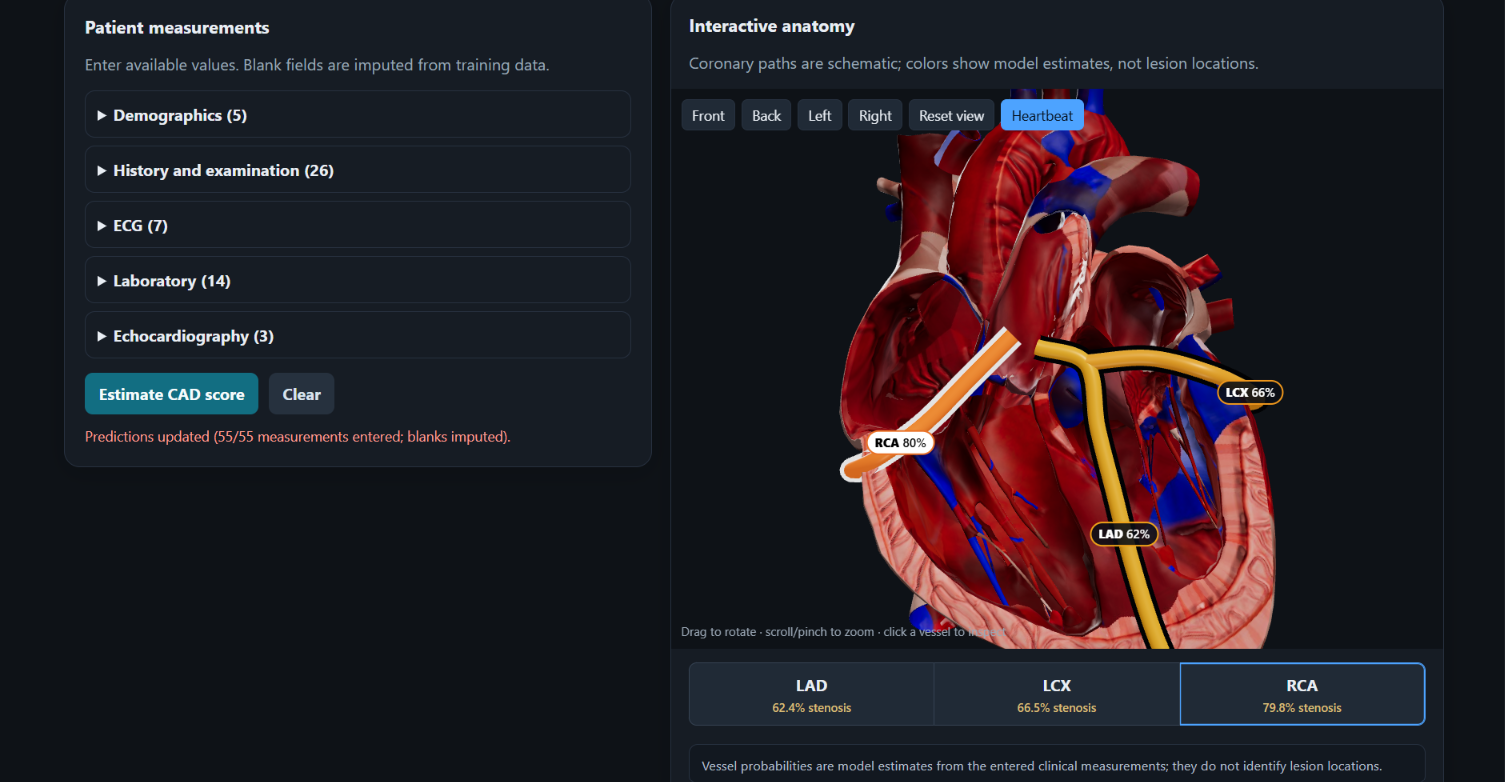
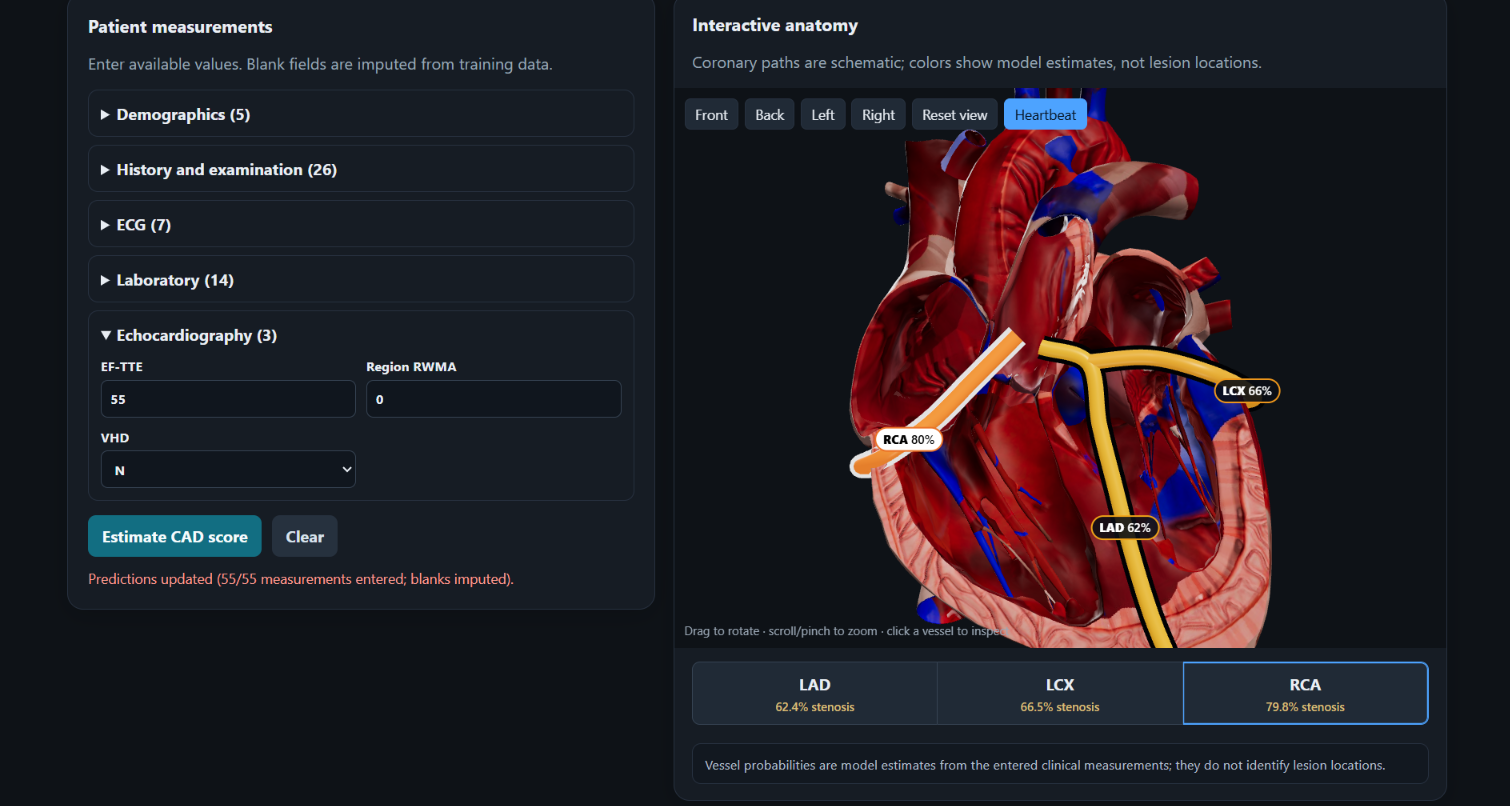
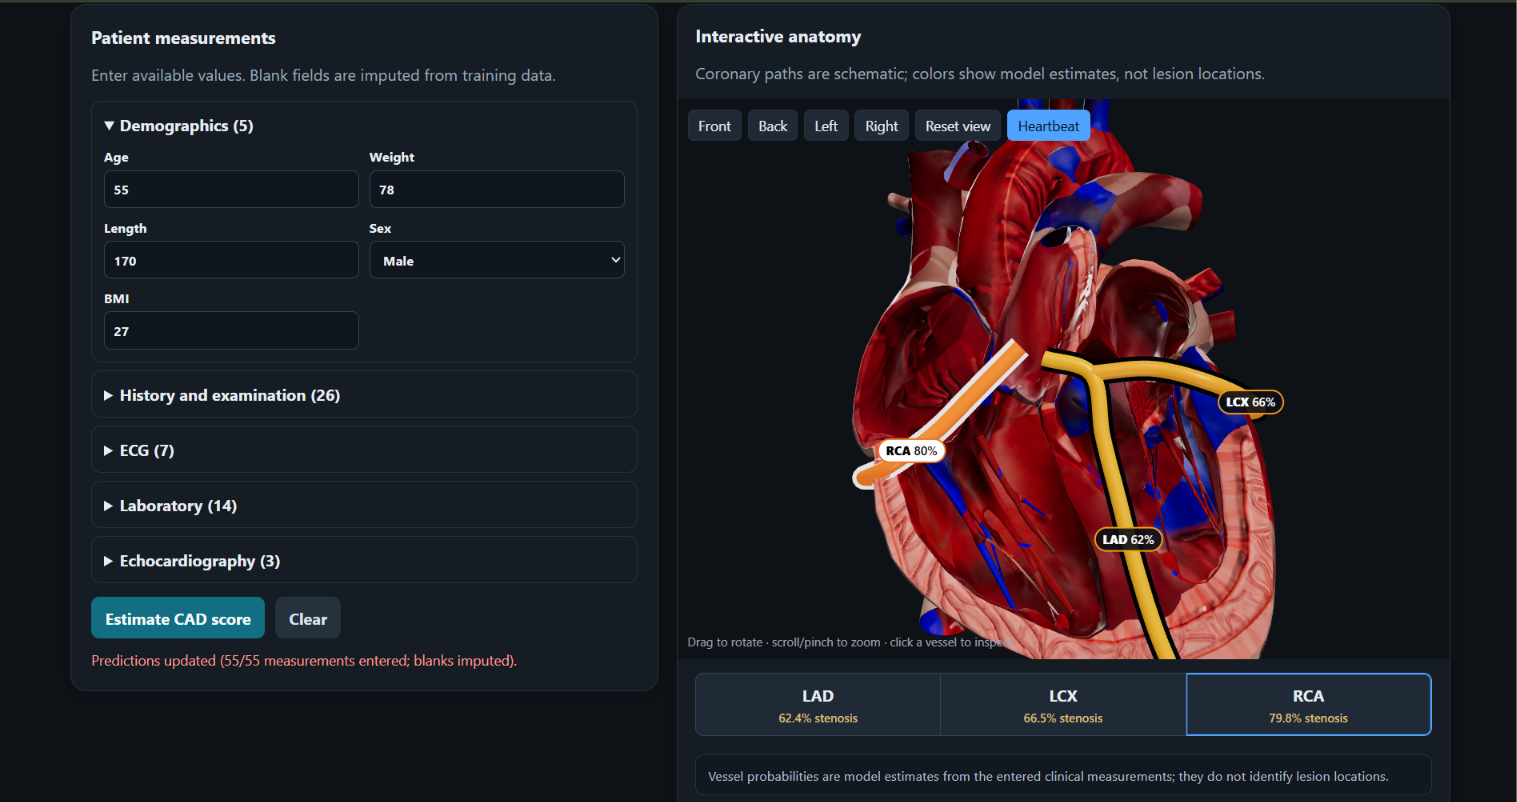
after given values result shown with an iterative 3D model
-
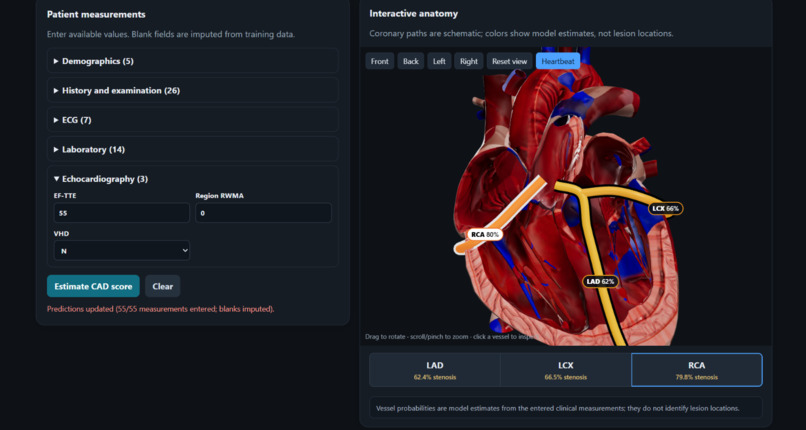
-
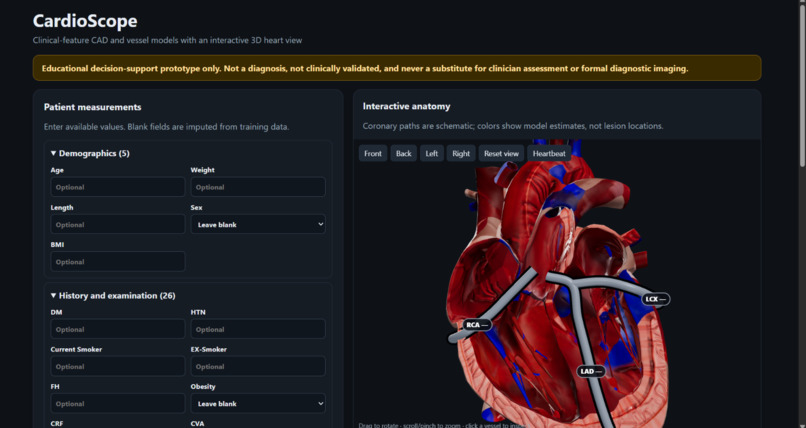
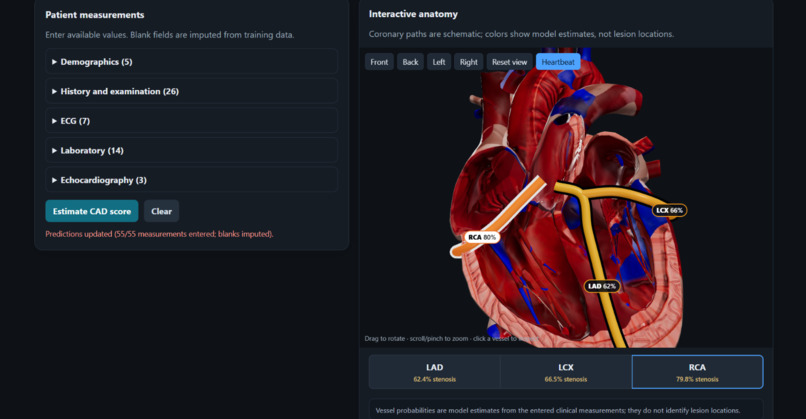
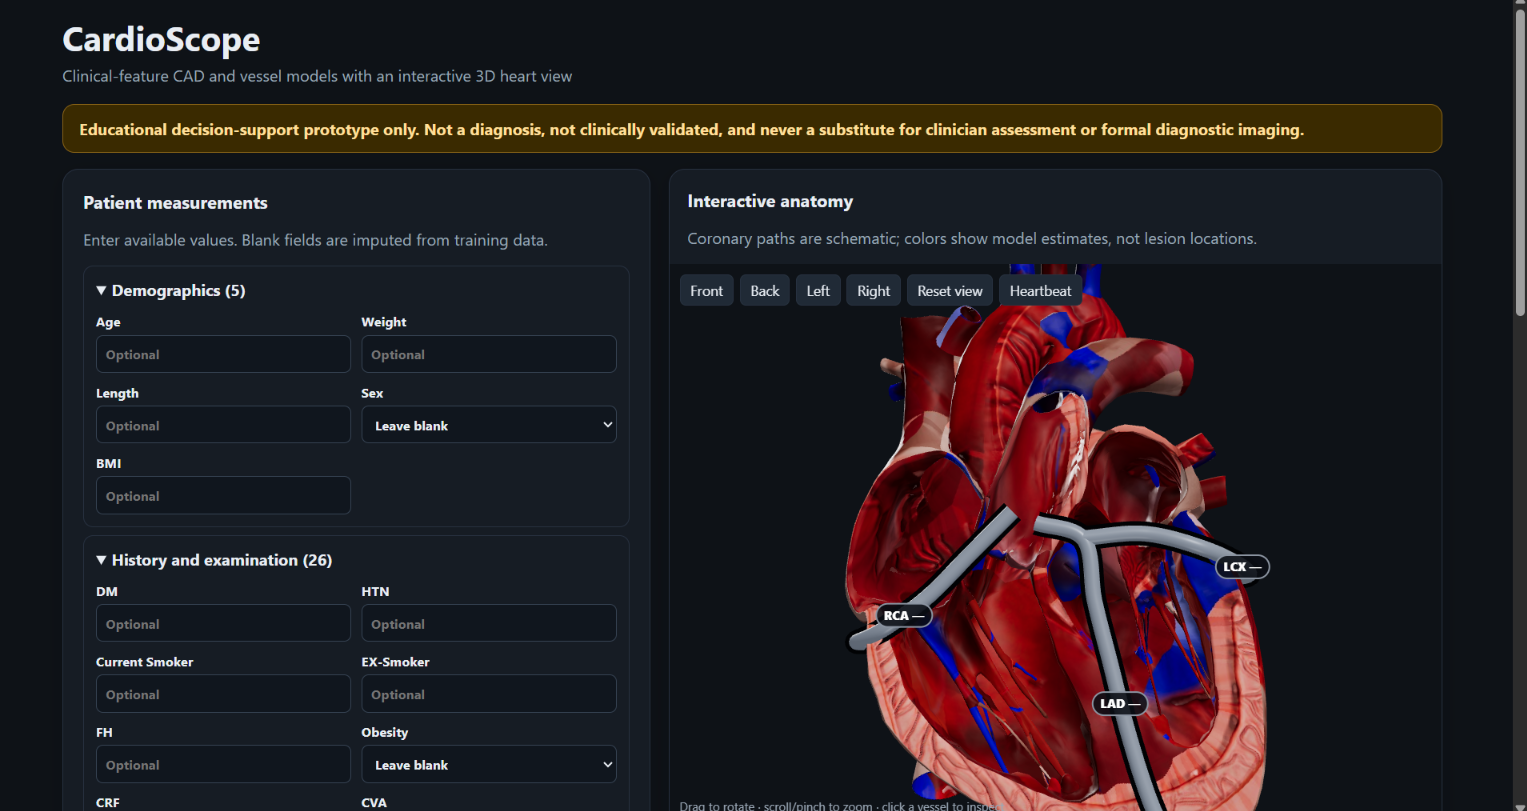
no values given
-
Inspiration
I found this hackathon while browsing Unstop and was drawn to its topics and real-world focus. I chose to explore how machine learning could make clinical data easier to understand through CardioScope.
How I built it
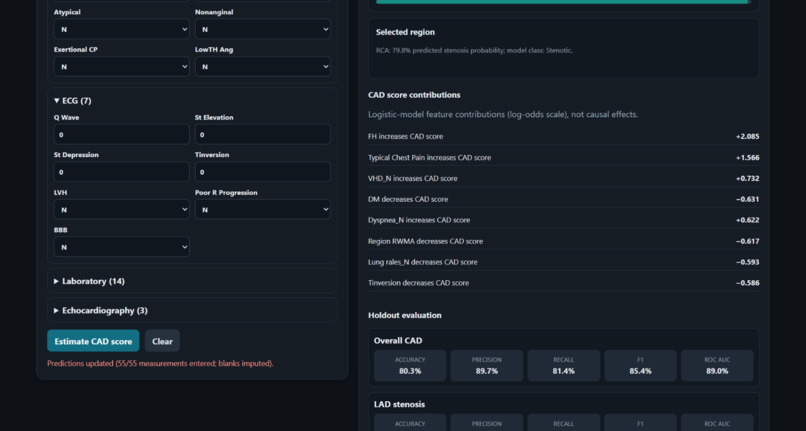
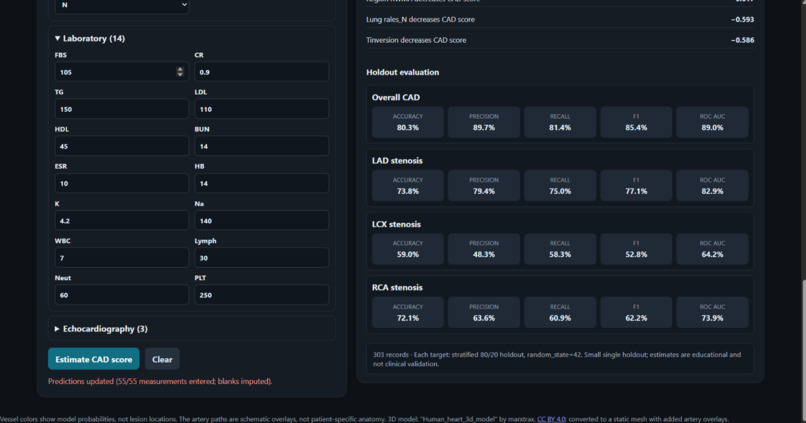
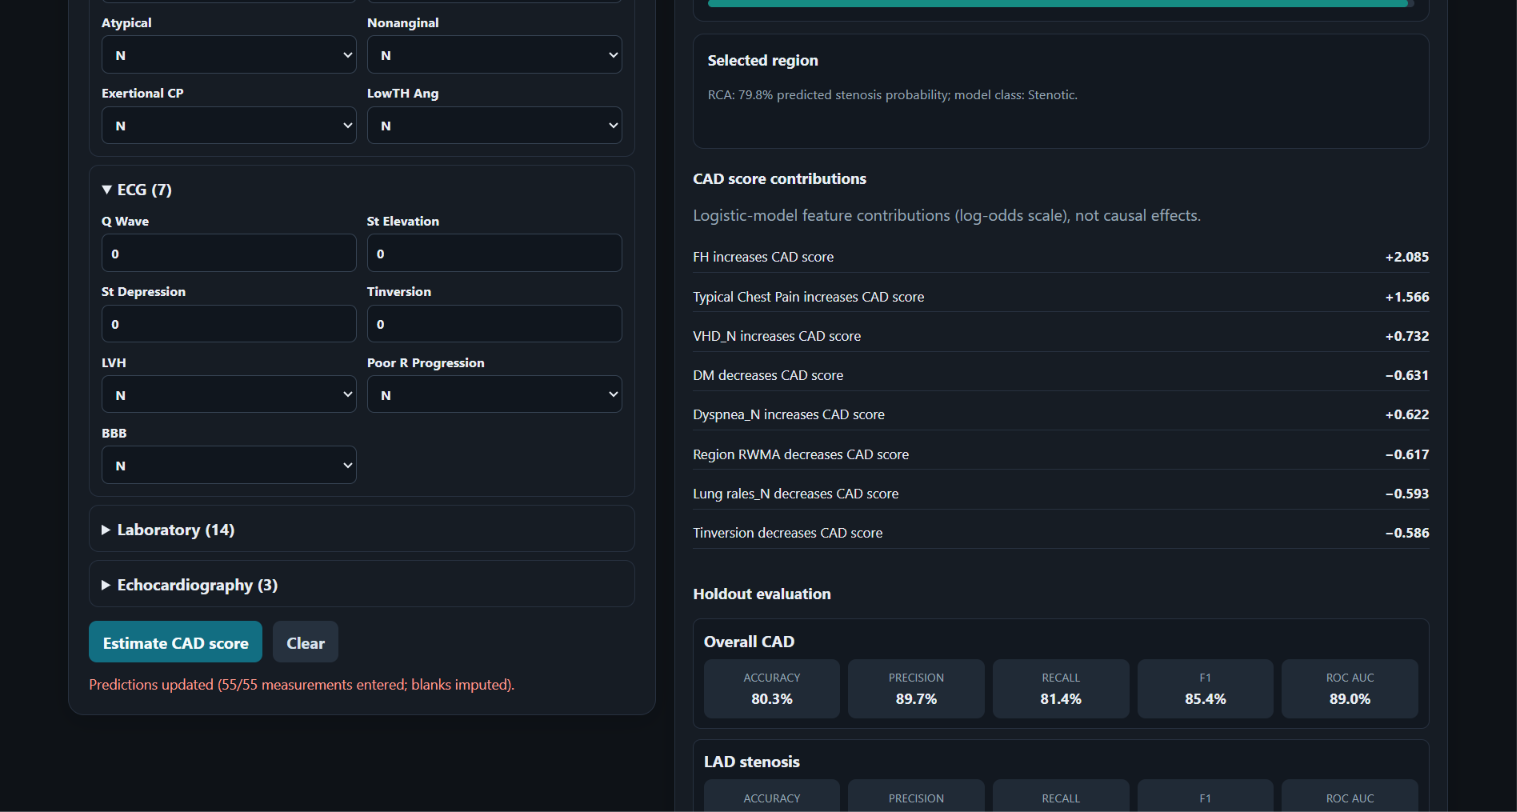
I built a web dashboard that accepts clinical measurements and displays model estimates for CAD and three coronary vessels: LAD, LCX, and RCA. It also includes an interactive 3D heart visualization and a list of input features that contributed to the CAD estimate. GitHub Copilot helped prepare the code, and Claude helped edit the schematic artery overlays.
What I learned
I learned how to connect a machine-learning workflow to a web application, preprocess clinical data, evaluate classification models, and present model outputs in an interactive interface. I also learned to communicate limitations clearly: CardioScope is an educational prototype, and its estimates are not a diagnosis.
Challenges
One challenge was connecting the prediction service, dashboard, and 3D viewer into one working experience. I also had to prevent target leakage during model training and make sure the 3D arteries were clearly presented as schematic overlays rather than patient-specific anatomy.
Built With
- css
- fastapi
- github-copilot
- html
- javascript
- pandas
- python
- scikit-learn
- three.js-/-react-three-fiber

Log in or sign up for Devpost to join the conversation.