-
-
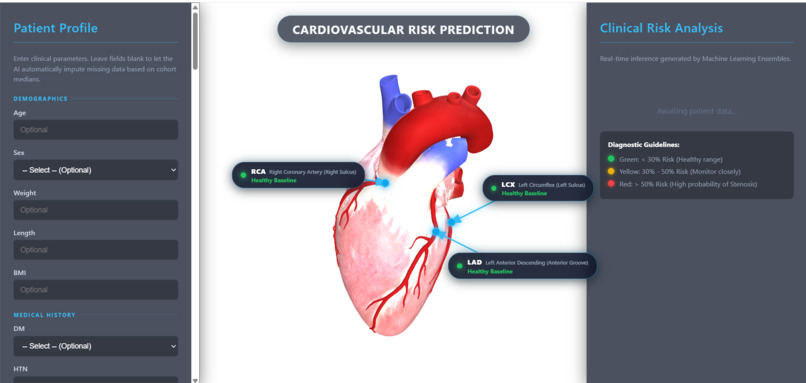
webpage
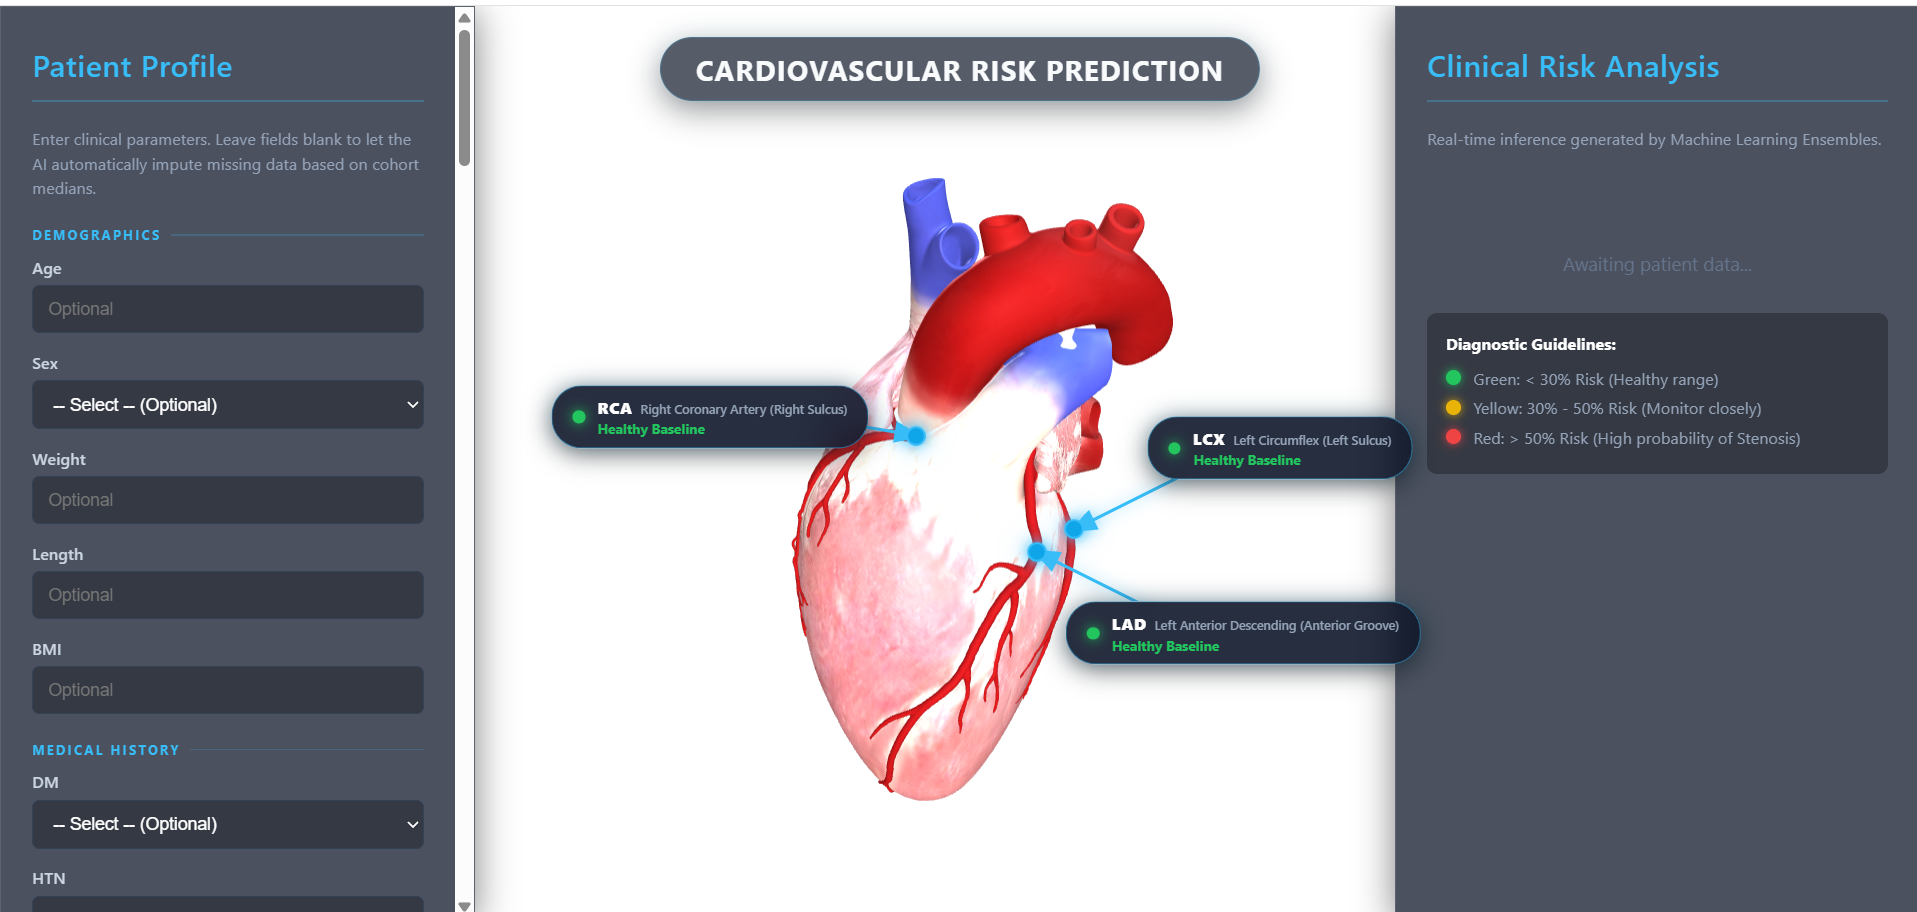
Inspiration
Traditional cardiovascular assessments (like Framingham or ASCVD) output an abstract 10-year percentage that fails to answer the most urgent clinical question: Where is the blockage? A stenosis in the Left Anterior Descending (LAD) artery carries vastly different surgical urgency than one in the Right Coronary Artery (RCA). We built CardioRisk 3D to bridge the gap between predictive machine learning and spatial anatomical intuition, transforming dry probability metrics into real-time 3D spatial mapping.
What it does
• Multi-Vessel Risk Prediction: Takes patient demographics, vitals, ECG, echo, and lab results to predict overall Coronary Artery Disease (CAD) risk along with individual stenosis probabilities for the three main coronary arteries: LAD, LCX, and RCA. • Interactive 3D Anatomical Mapping: Renders a 3D anatomical heart in real-time. Pulsing beacon pins mark exact anatomical sulci, connected via dynamic SVG leader vectors to floating risk badges. • Clinical Triage & Actionable Insights: Color-codes risk into clear clinical tiers (<30% Normal, 30–60% Borderline, >60% High Risk) and generates tailored diagnostic recommendations (e.g., immediate invasive coronary angiography vs. stress testing).
How we built it
• Machine Learning Core: Trained on the Z-Alizadeh Sani clinical cohort (N = 303, 54 features). Employs balanced Random Forest ensembles and regularized classifiers with Platt Sigmoid Calibration to convert raw model margins into true posterior probabilities. • Backend API: Built with FastAPI and Pydantic to validate clinical inputs and serve asynchronous predictions in under 20 ms. • Frontend & 3D Engine: Built with Three.js (WebGL) using physically based rendering (PBR) and dynamic camera projection matrices (𝐏{NDC} = 𝐊 · 𝐕 · 𝐌 · 𝐏{world}) to track floating UI badges across 360° user rotation.
Challenges we ran into
• GLTF Coordinate Rotation Inversion: The root 3D CAD mesh carried an internal -90° transform matrix that caused pins anchored in world space to drift off during user orbit. We resolved this by parenting anchor nodes directly to the cardiac mesh surface hierarchy (SubTool-0). • Preserving Photorealistic Textures: Attempting to color-code risk by modifying raw vertex buffers degraded the textures (turning coronary veins an uninterpretable muddy yellow). We pivoted to a non-invasive HUD layer with pulsing beacon pins and floating cards, keeping the anatomical textures 100% natural. • Data Sparsity in Secondary Arteries: Secondary vessel labels (LCX/RCA) had higher noise than primary CAD labels, which we solved using Stratified 5- Fold cross-validation and L2 regularization to prevent overfitting
Accomplishments that we're proud of
• Diagnostic Performance: Achieved an 0.876 ROC-AUC and 88.52% accuracy for overall CAD diagnosis on unseen test sets. • Seamless 60 FPS 2D/3D Synchronization: Real-time mathematical vector tracking that keeps SVG leader lines locked onto anatomical coordinates with zero visual jitter. • True Clinical Usability: Designed an intuitive, dark glassmorphic dashboard with instant 1-click patient presets that any cardiologist or med student can use immediately.
What we learned
• Calibration Over Raw Accuracy: In clinical decision support, calibrated probabilities (P(Y = 1 | f(x))) are vital—overconfident false certainty can lead to incorrect triage. • Coordinate Transformation Pipelines: Deepened our mastery of WebGL view-projection pipelines and matrix math required to bridge 3D spatial graphics with 2D responsive HTML/SVG overlays.
Built With
- 3d-graphics
- backend
- css3
- data
- data-science
- frontend
- html5
- javascript
- logistic-regression
- machine-learning
- numpy
- pnadas
- random-forest
- webgl

Log in or sign up for Devpost to join the conversation.