-
-
importance
-
roc_calibration
Cardio Risk 3D — Making Cardiovascular Risk Visible
Inspiration
Cardiovascular disease risk is often communicated through numbers, reports, and clinical measurements. While these are essential for medical decision-making, understanding how a predicted risk relates to the heart's anatomy can be difficult.
We wanted to explore a different approach: what if cardiovascular risk could be seen, explored, and understood on an interactive 3D heart instead of being limited to percentages on a dashboard?
This idea led us to build Cardio Risk 3D for the Multimodal AI Hackathon 2026 at IIT Mandi. Our goal was to bring together machine learning, explainable AI, and 3D visualization to make cardiovascular risk estimates more interpretable and interactive.
What We Built
Cardio Risk 3D is an interactive cardiovascular risk prediction and visualization system. It estimates the probability of coronary artery disease (CAD) and the likelihood of significant stenosis in three major coronary arteries: the Left Anterior Descending (LAD), Left Circumflex (LCX), and Right Coronary Artery (RCA).
Users can enter clinical information, including demographic details, examination findings, ECG measurements, laboratory results, and echocardiographic findings. The system processes these inputs and displays the predicted probabilities alongside an interactive 3D heart.
Each coronary artery is coloured according to its predicted risk, allowing users to rotate, zoom, and explore the anatomy. Changing an input updates the predictions and the corresponding visual representation, making it possible to investigate how different inputs affect the model's estimates.
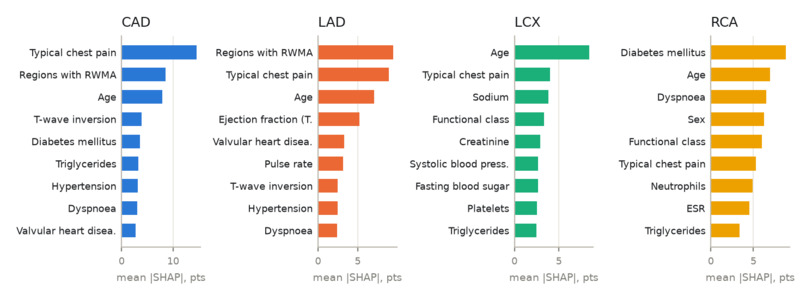
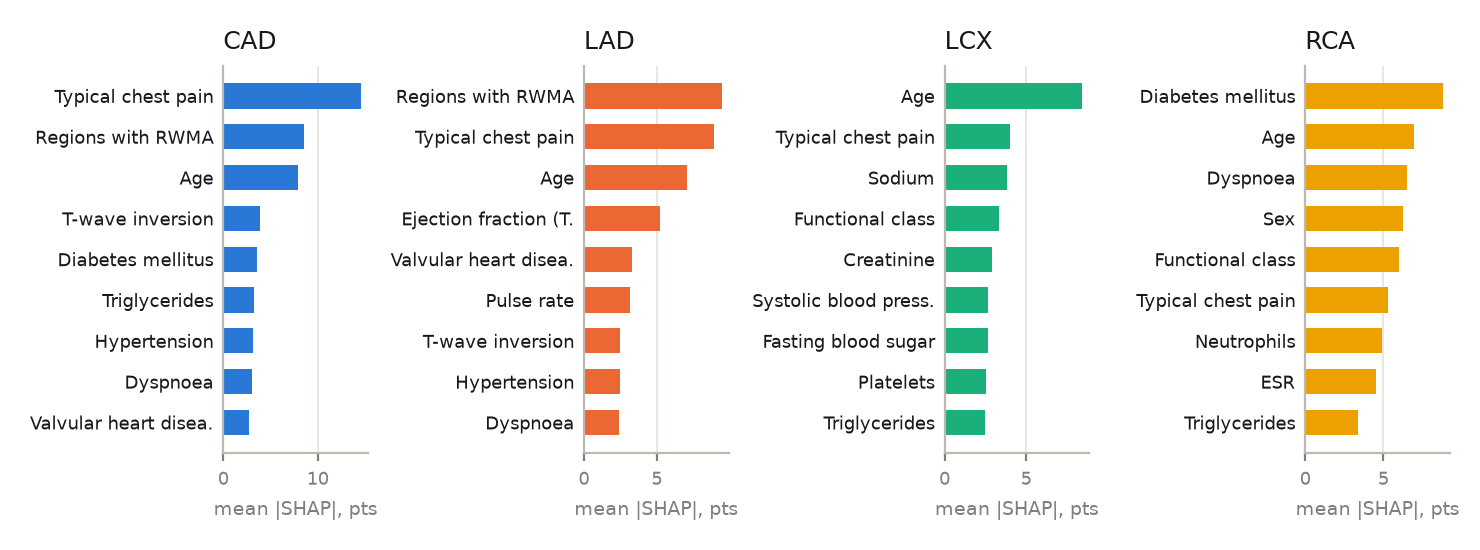
But prediction alone was not enough. We also integrated SHAP-based explanations to show how individual clinical features contribute to each estimate. The dashboard presents feature values and their contributions, helping users understand not just what the model predicts, but also why.
How We Built It
We developed the project using a Python-based machine learning backend and a React-based interactive frontend.
- Machine Learning: We trained and compared regularised logistic regression, random forest, XGBoost, RBF support vector machines, and a soft-voting ensemble. The final models use regularised logistic regression, selected using a model-selection procedure that balances performance and simplicity.
- Data Processing: We used the Z-Alizadeh Sani coronary artery disease dataset, working with a cohort of 303 patients. We implemented consistent preprocessing, feature encoding, and safeguards against target leakage.
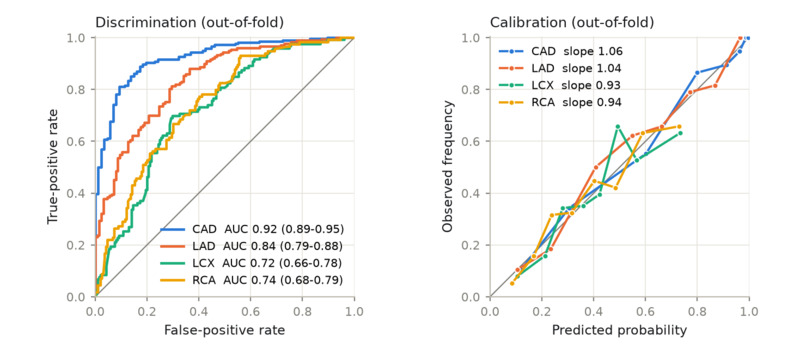
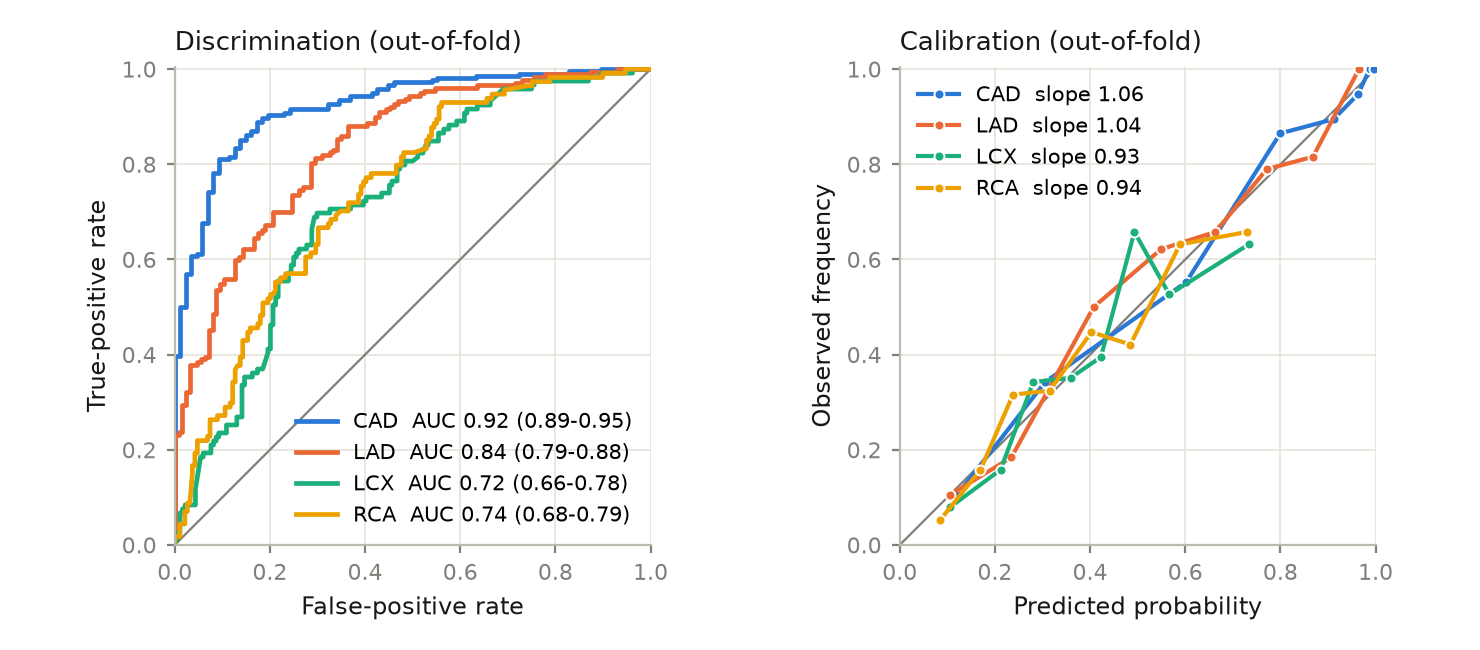
- Model Evaluation: We used repeated, stratified, nested cross-validation to evaluate the models and assess their performance using ROC-AUC, accuracy, precision, recall, F1-score, specificity, and Brier score.
- Explainable AI: We integrated SHAP contributions on the probability scale to show how clinical features influence the predictions.
- 3D Visualization: Using React Three Fiber and anatomical meshes from BodyParts3D, we created an interactive heart and torso. The major coronary arteries and associated heart-wall regions change colour based on predicted risk.
- Backend and API: We built a FastAPI backend to serve predictions, uncertainty intervals, explanations, cohort comparisons, and modifiable-factor scenarios.
- Frontend: We developed a React and TypeScript dashboard that combines clinical inputs, prediction results, anatomical visualization, and model evidence.
We also incorporated uncertainty estimates using bootstrap refits and added a coherence constraint so that a vessel's predicted stenosis probability does not exceed the overall predicted probability of CAD.
Challenges We Faced
One of our main challenges was combining machine learning outputs with an anatomically meaningful 3D visualization. The predicted probabilities needed to update the correct coronary arteries and corresponding heart-wall regions without compromising the interactive experience.
Another challenge was ensuring that the model evaluation was reliable despite the limited dataset. With only 303 patients from a single centre, careful validation was essential. We used nested cross-validation, kept preprocessing and hyperparameter tuning within the training folds, and added safeguards against target leakage.
Interpretability was equally important. We wanted the system to explain individual predictions rather than present unexplained percentages. Integrating SHAP contributions into the dashboard helped us connect the clinical measurements with the model's outputs.
Finally, we had to balance predictive performance, model complexity, uncertainty, and responsiveness. We compared multiple model families and chose simpler models for deployment based on our selection procedure rather than assuming that the most complex model would always be the best choice.
Results and What We Learned
In repeated out-of-fold evaluation, our overall CAD model achieved a mean ROC-AUC of 0.917, demonstrating promising discrimination on this dataset. Performance was weaker for individual vessel-level predictions, particularly for LCX and RCA, which reinforced the importance of reporting model limitations honestly.
Beyond model performance, this project helped us understand how different areas of AI engineering can work together. We explored the complete pipeline, from data preparation and leakage prevention to model selection, uncertainty estimation, explainability, API development, and interactive 3D rendering.
We also learned that a high-performing model is not enough on its own. Users need context, understandable explanations, and an honest representation of uncertainty and limitations.
What's Next?
Future improvements could include external validation on independent patient populations, evaluation on more diverse datasets, better handling of missing clinical inputs, and more detailed lesion-level visualization when suitable labelled data becomes available.
We would also like to investigate how the system performs in populations outside the original angiography-referred cohort before considering broader clinical applications.
Cardio Risk 3D is a decision-support and educational prototype, not a diagnostic tool. Its models are trained on a small, single-centre cohort and have not undergone external validation or regulatory review. Predictions should not replace professional clinical judgement or diagnostic imaging.
Built With
- 3d-visualization
- cross-validation
- data-visualization
- explainable-ai
- fastapi
- healthcare-ai
- machine-learning
- numpy
- pandas
- python
- react
- react-three-fiber
- rest-api
- scikit-learn
- shap
- three.js
- typescript
- xgboost


Log in or sign up for Devpost to join the conversation.