-
-
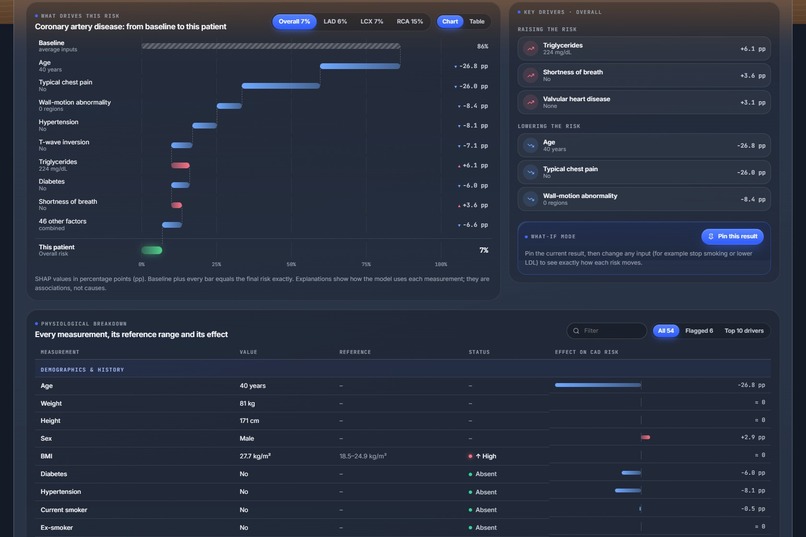
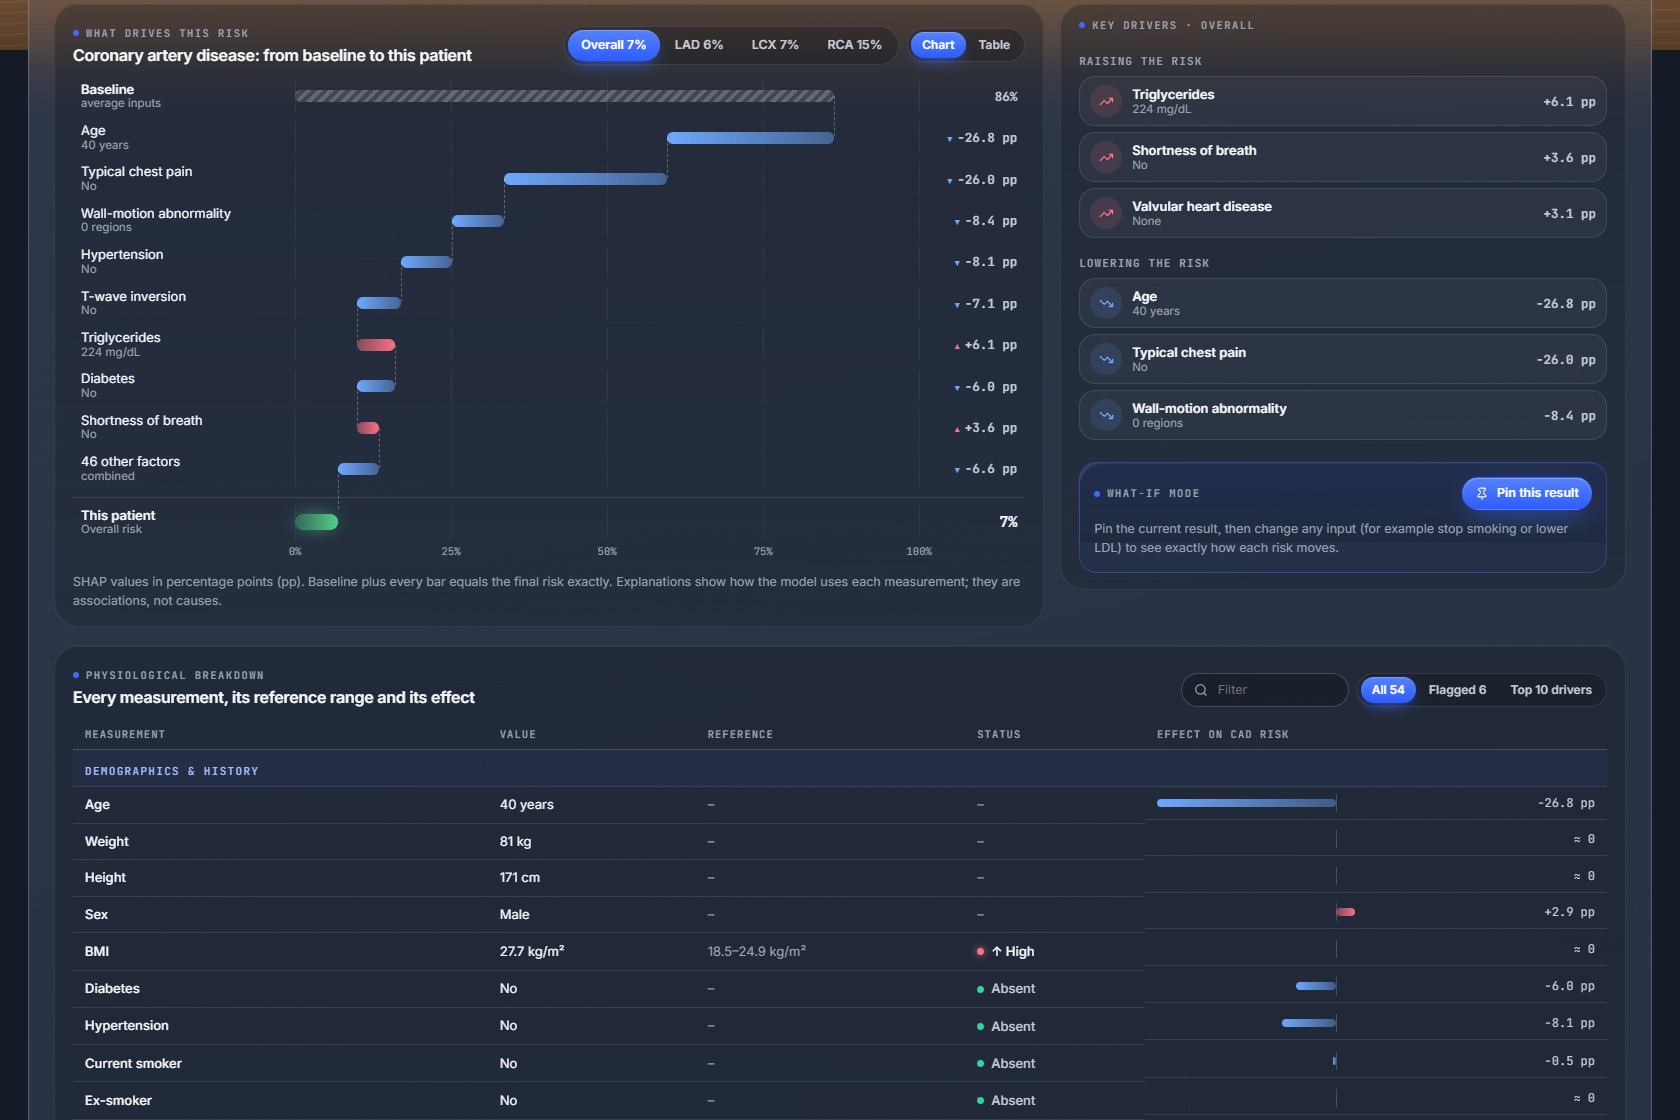
the SHAP explanation and the physiological breakdown
-
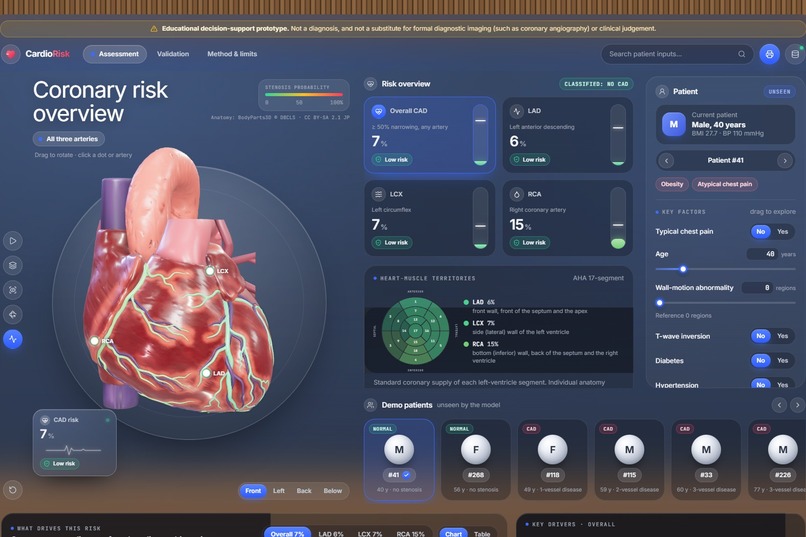
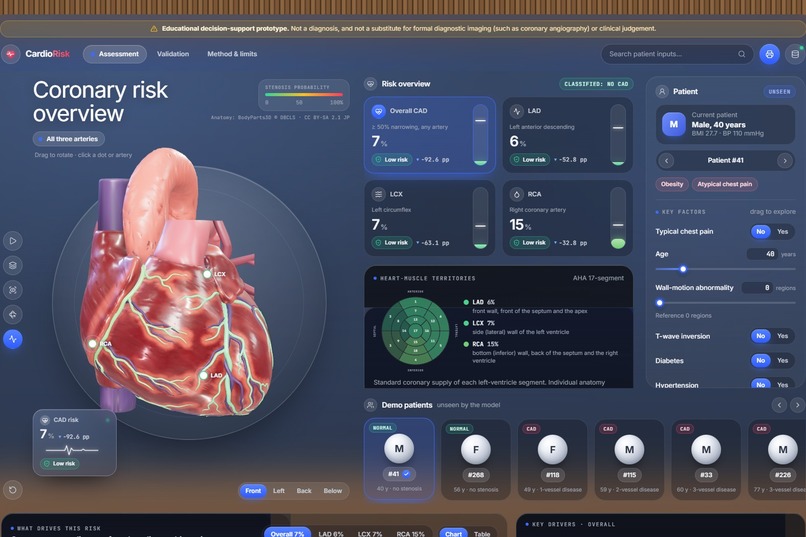
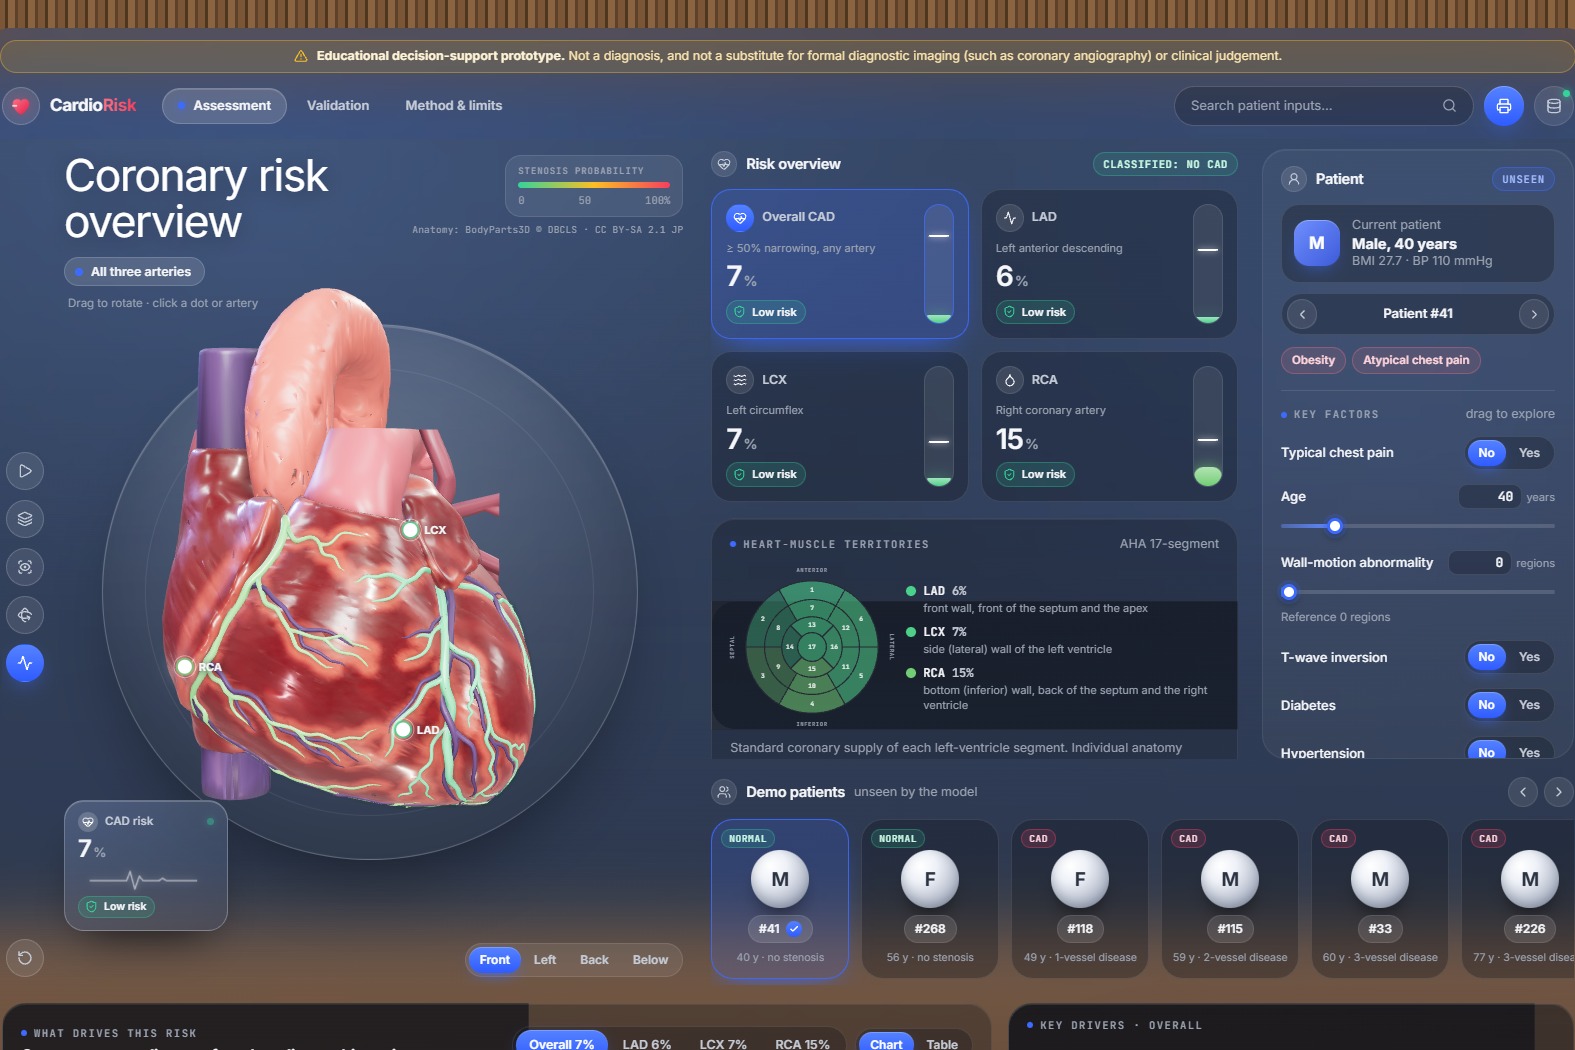
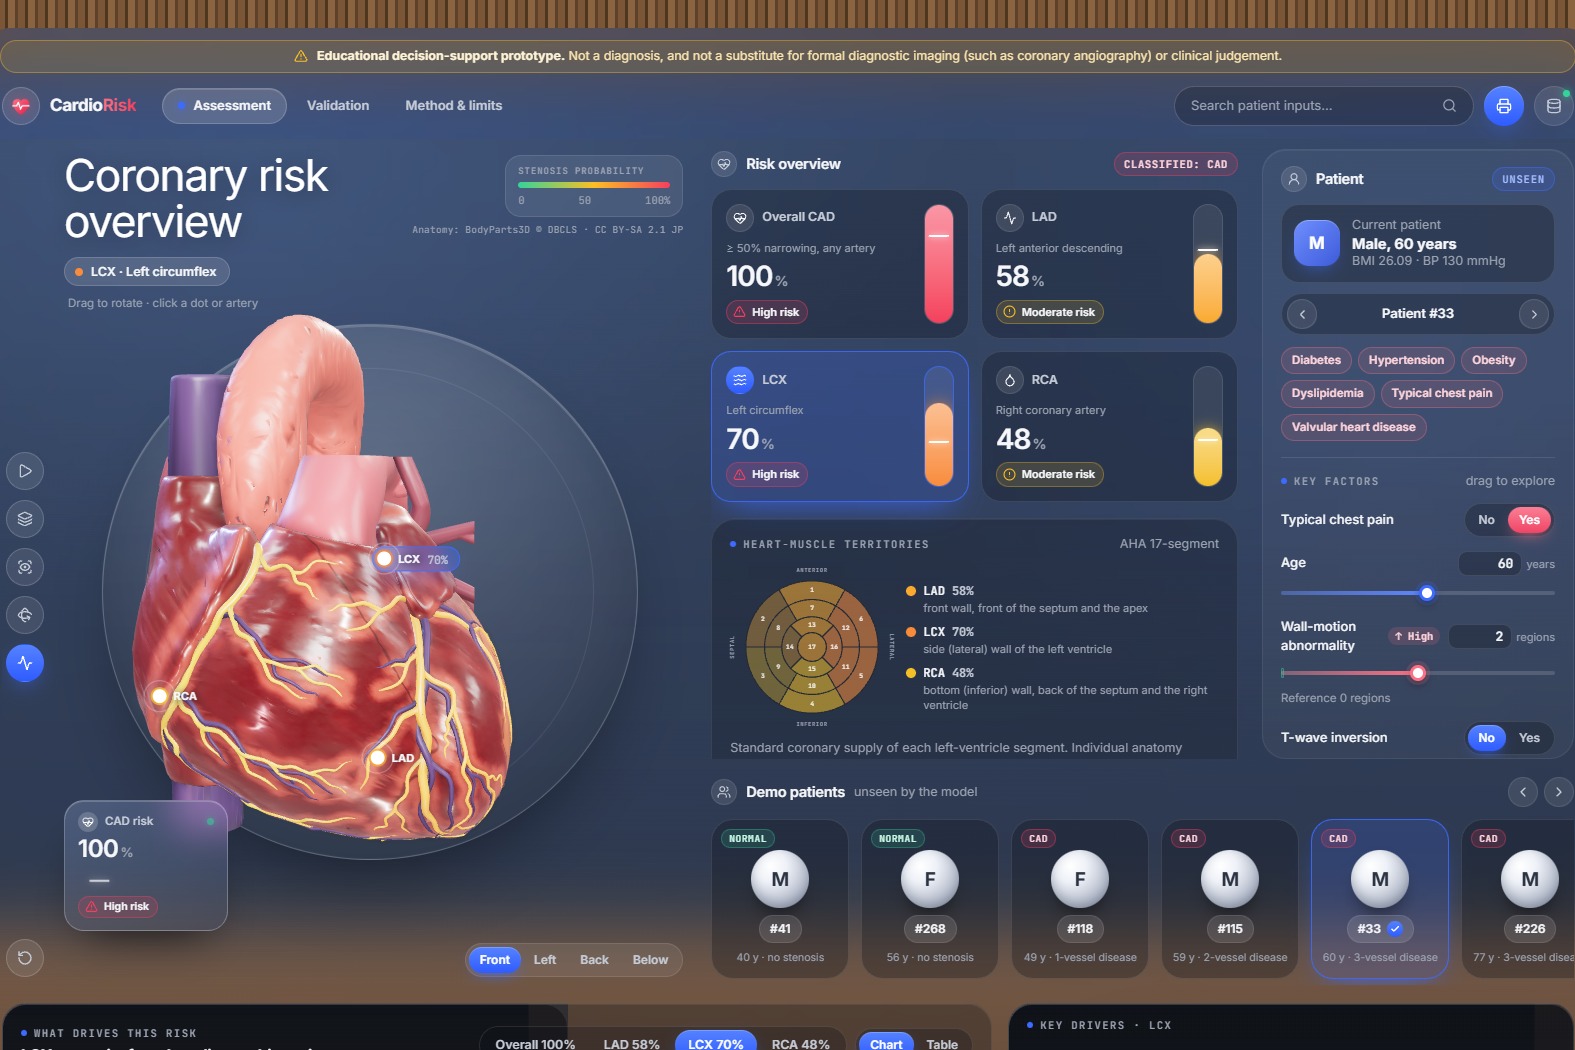
the main page with the 3D heart
-
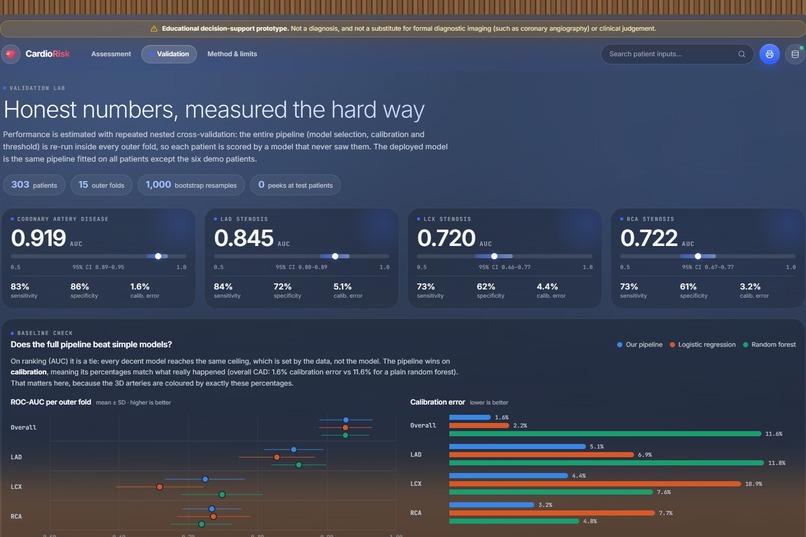
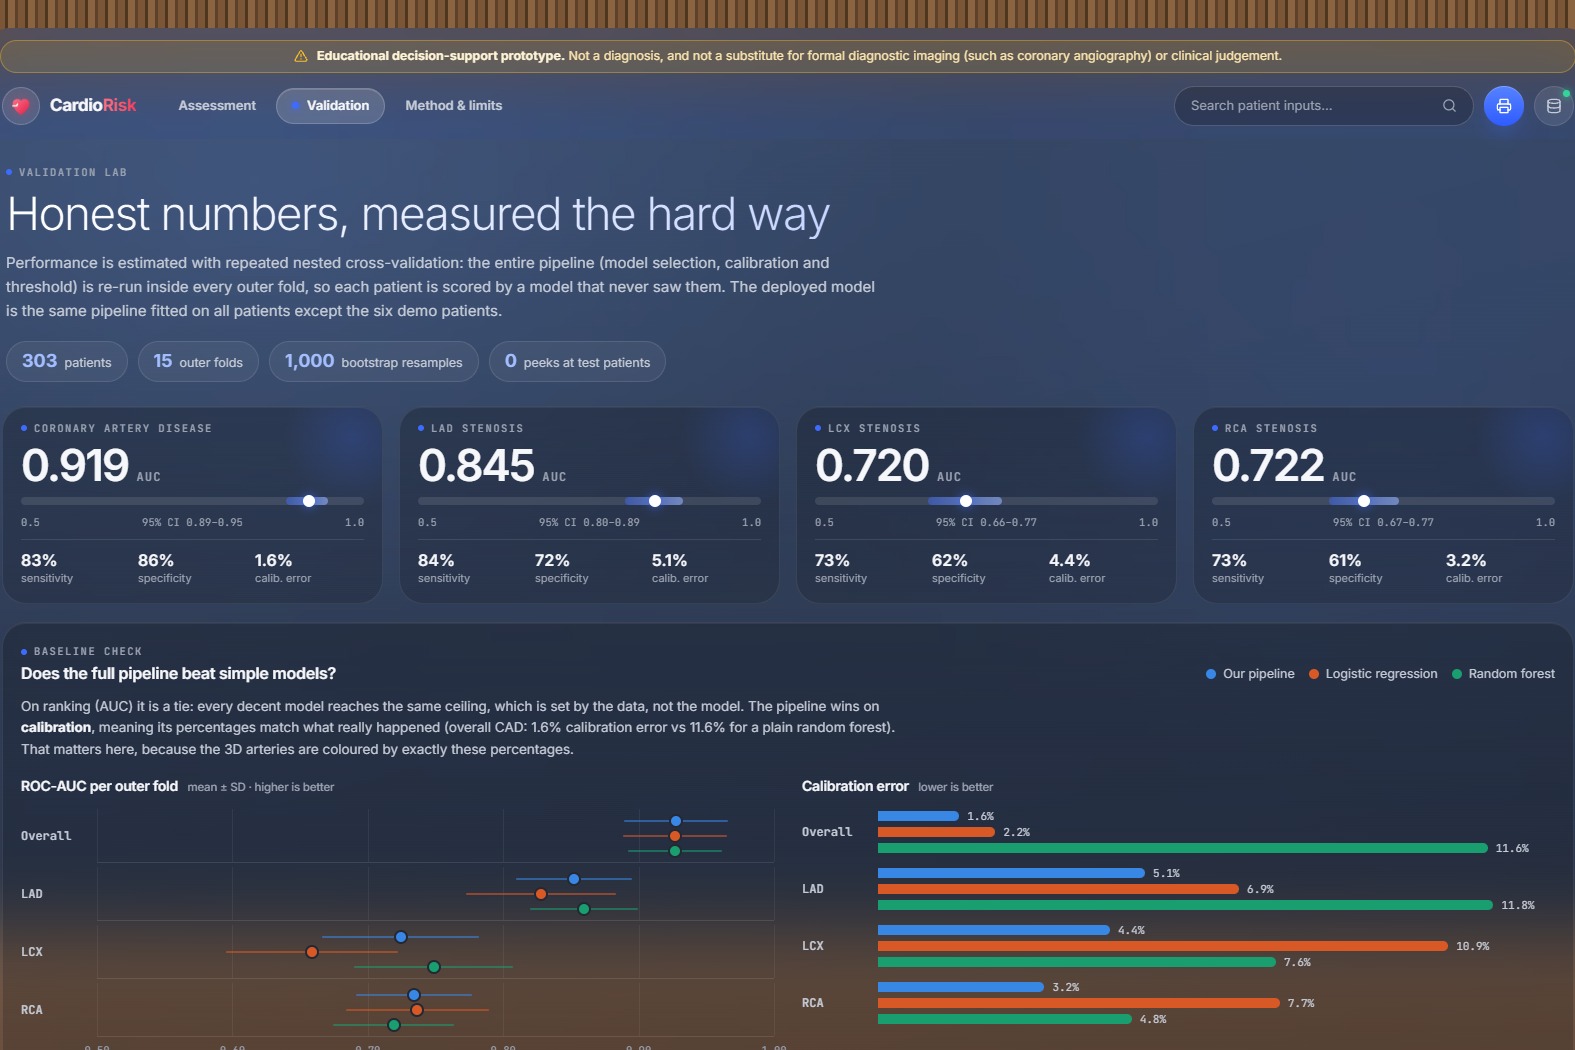
the validation results
-
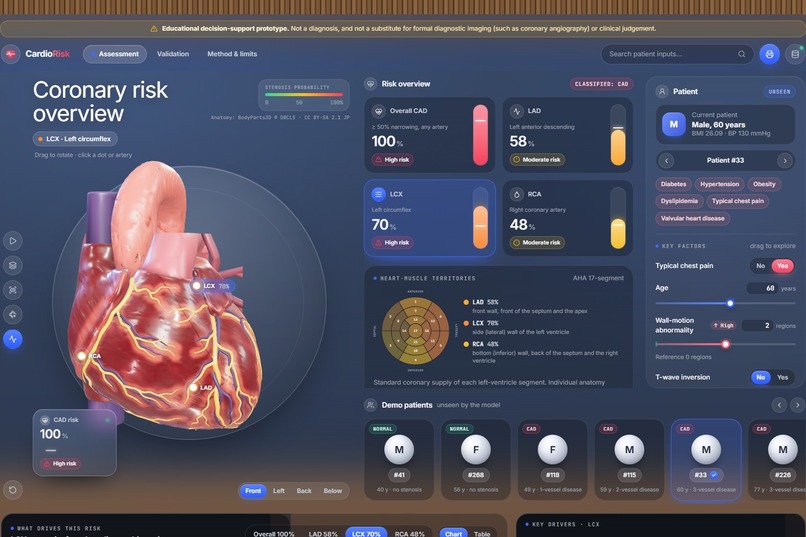
a 3-vessel-disease patient with the LCX selected
-
what-if mode showing the change in each risk

Inspiration
A risk score of "72%" tells a clinician or a patient very little about where the problem is. Coronary artery disease is diagnosed with angiography, which is invasive and expensive, yet most of the warning signs are already in routine data: history, examination, ECG, blood tests and echocardiography. We wanted to turn those routine measurements into something you can see: a real 3D heart whose arteries show their own risk, with every number explained.
What it does
CardioRisk 3D takes a patient's clinical measurements and predicts four things: the chance of overall coronary artery disease and of significant narrowing in each main artery, the LAD, LCX and RCA.
- 3D heart: real human anatomy (BodyParts3D) with the actual LAD, LCX and RCA as separate structures, each coloured by its predicted risk. Rotate, zoom, click an artery, take a guided tour, or switch to X-ray mode to see every artery through the heart wall.
- Territory map: the heart muscle is divided into the American Heart Association's 17 segments. Selecting an artery tints the muscle it supplies, linked to a standard bullseye chart.
- Explanations: every prediction is broken down with SHAP into one contribution per measurement, in percentage points, adding up exactly to the patient's risk.
- What-if mode: pin a result, change any measurement, and see how each risk moves.
- Physiological breakdown: all 54 measurements with their normal ranges, flags and effect on the risk.
- Demo patients: six patients held out of training, shown next to their real angiography result.
- Validation page: ROC curves, calibration plots, confusion matrices and every metric with 95% confidence intervals.
A visible disclaimer states it is an educational decision-support prototype, not a substitute for diagnostic imaging.
How we built it
- Data: the extended Z-Alizadeh Sani dataset (303 patients, 54 features, angiography labels for LAD, LCX and RCA). The angiography columns (LAD, LCX, RCA, Cath) are never used as inputs: training stops if one slips in, the API rejects them, and automated tests check both.
- Models: one model per target, each calibrated with Platt scaling and given its own decision threshold:
- Overall CAD: logistic regression (L1)
- LAD: random forest
- LCX: average of XGBoost and \( P(\text{CAD}) \times P(\text{LCX} \mid \text{CAD}) \)
- RCA: logistic regression (L1)
- Validation: repeated nested cross-validation (5 folds × 3 repeats outside, 5 × 2 inside). The whole selection process reruns inside every outer fold, so every reported score comes from patients the model never saw.
- Backend: Python and FastAPI serving predictions with exact, additive SHAP explanations in about 50 ms.
- Frontend: React, TypeScript and Vite, with the 3D scene in Three.js (WebGL). The heart was built from BodyParts3D meshes, with the territory map computed from the heart's own geometry and the model compressed to about 1 MB.
- Deployment: the whole app runs on Vercel as a single FastAPI function.
Results (repeated nested cross-validation, 303 patients)
- Overall CAD: ROC-AUC 0.92 (95% CI 0.89–0.95), sensitivity 83%, specificity 86%, calibration error 1.6%
- LAD: ROC-AUC 0.85 (0.80–0.89)
- LCX: ROC-AUC 0.72 (0.66–0.77)
- RCA: ROC-AUC 0.72 (0.67–0.77)
Our probabilities are also well calibrated: when the model says 70%, about 70% of those patients really have disease. That matters because the arteries are coloured by exactly these percentages.
Challenges we ran into
- A small dataset: with 303 patients, a single train/test split was too noisy. The same model scored anywhere from 0.83 upward across 100 random splits, so we moved to repeated nested cross-validation.
- LCX and RCA are hard: the data has nothing that locates a blockage, such as lead-by-lead ECG or imaging, so every model hits a ceiling around 0.72.
- Explanations that add up: combined and calibrated models needed extra work so that the SHAP contributions still sum exactly to the displayed risk.
- Anatomy on the web: turning BodyParts3D meshes into a light, clickable heart with real coronary arteries and a correct territory map.
- Deployment size: the ML libraries came to over 800 MB, so we trimmed the runtime to fit within the serverless limit.
Accomplishments that we're proud of
- An honest evaluation pipeline with no target leakage and no tuning on test patients
- A real anatomical 3D heart where each artery's colour matches its predicted risk
- Explanations that add up exactly to every prediction
- A live, public deployment anyone can try
What we learned
How much the validation method changes the numbers, why calibration matters as much as accuracy when probabilities drive a visualisation, and how to bring medical anatomy into the browser while keeping it fast on ordinary laptops.
What's next for CardioRisk 3D
- Validation on an external patient population
- Comparison against standard clinical risk scores
- "What would lower this risk?" suggestions and similar-patient views
- More anatomy, such as a translucent torso and blood-flow animation
Built With
- bodyparts3d
- catboost
- fastapi
- gltf
- joblib
- numpy
- pandas
- python
- react
- scikit-learn
- shap
- three.js
- typescript
- vercel
- vite
- webgl
- xgboost


Log in or sign up for Devpost to join the conversation.