-
-
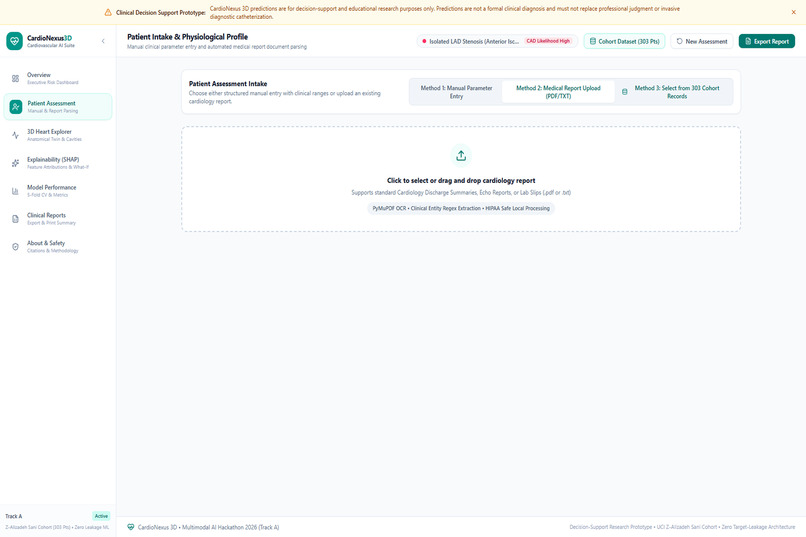
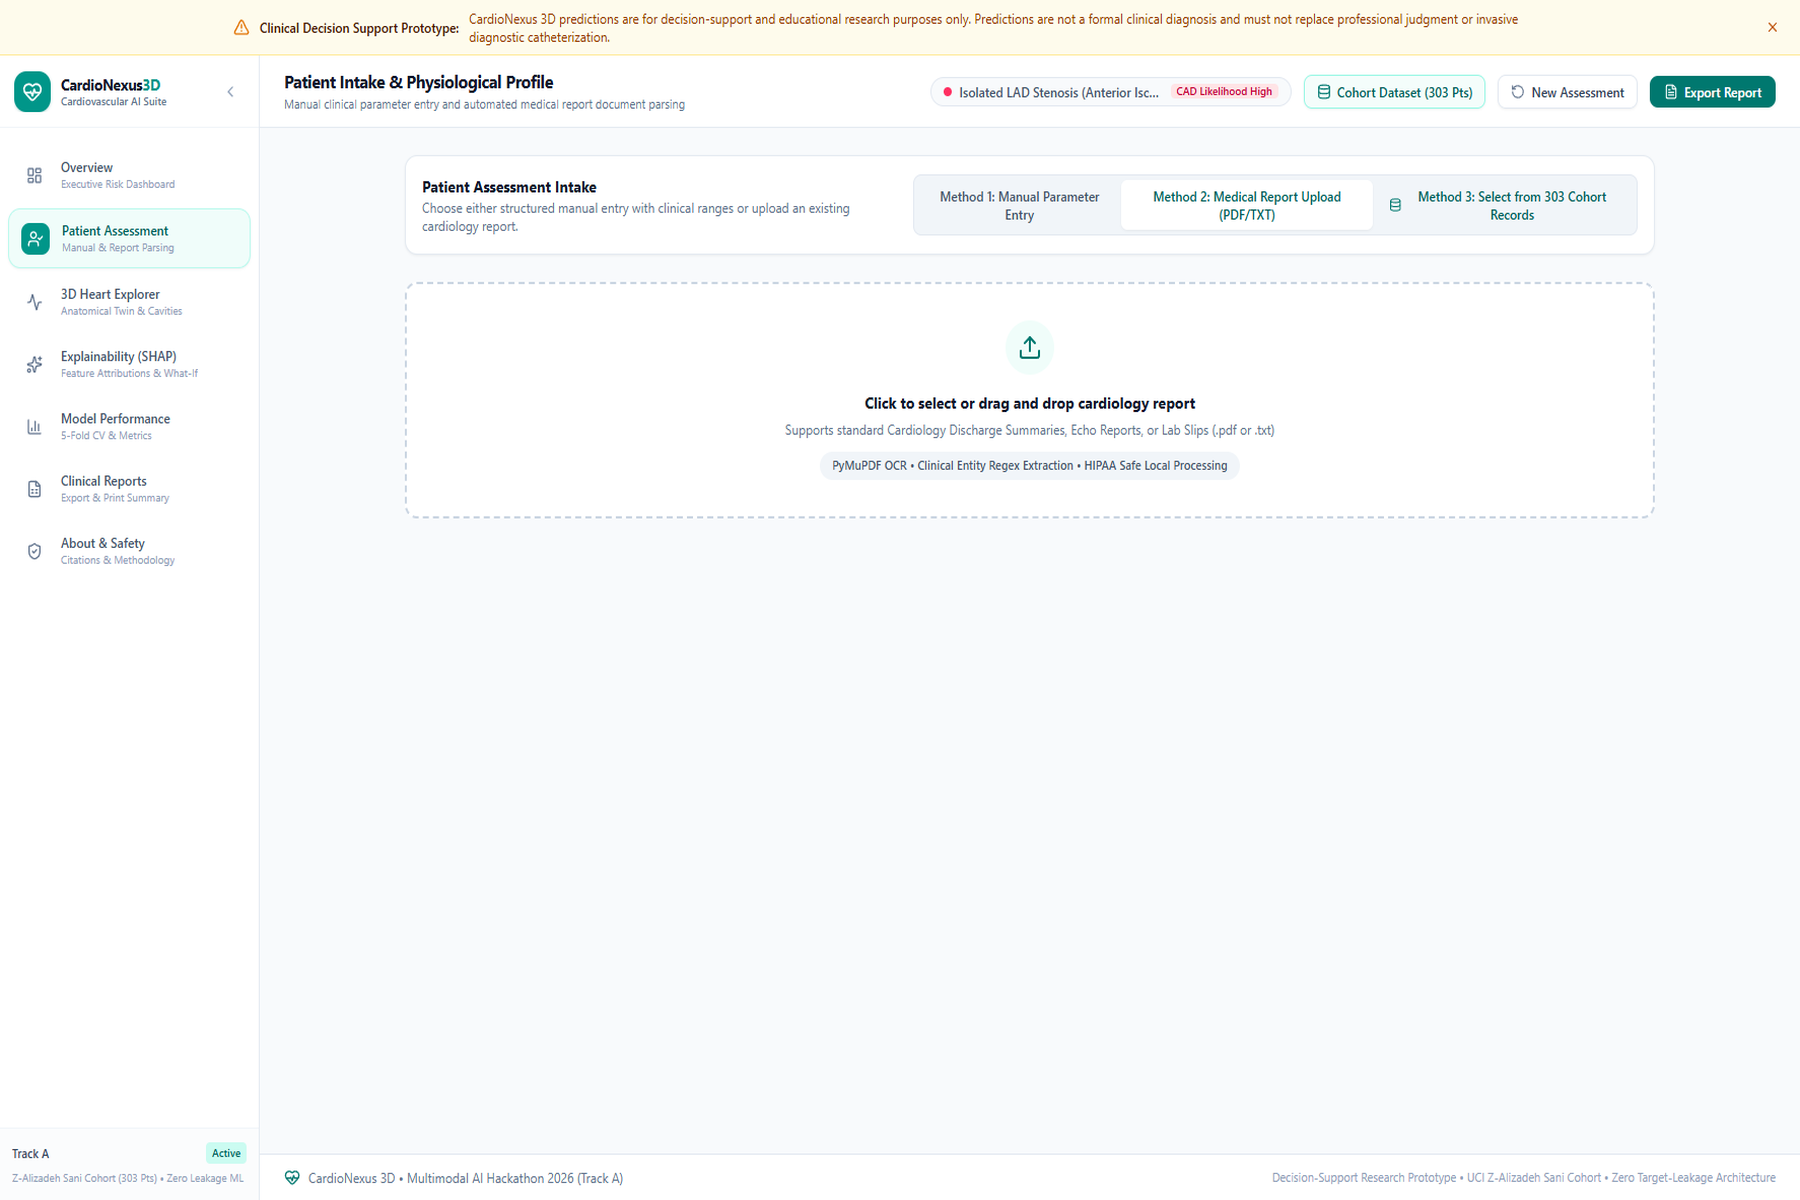
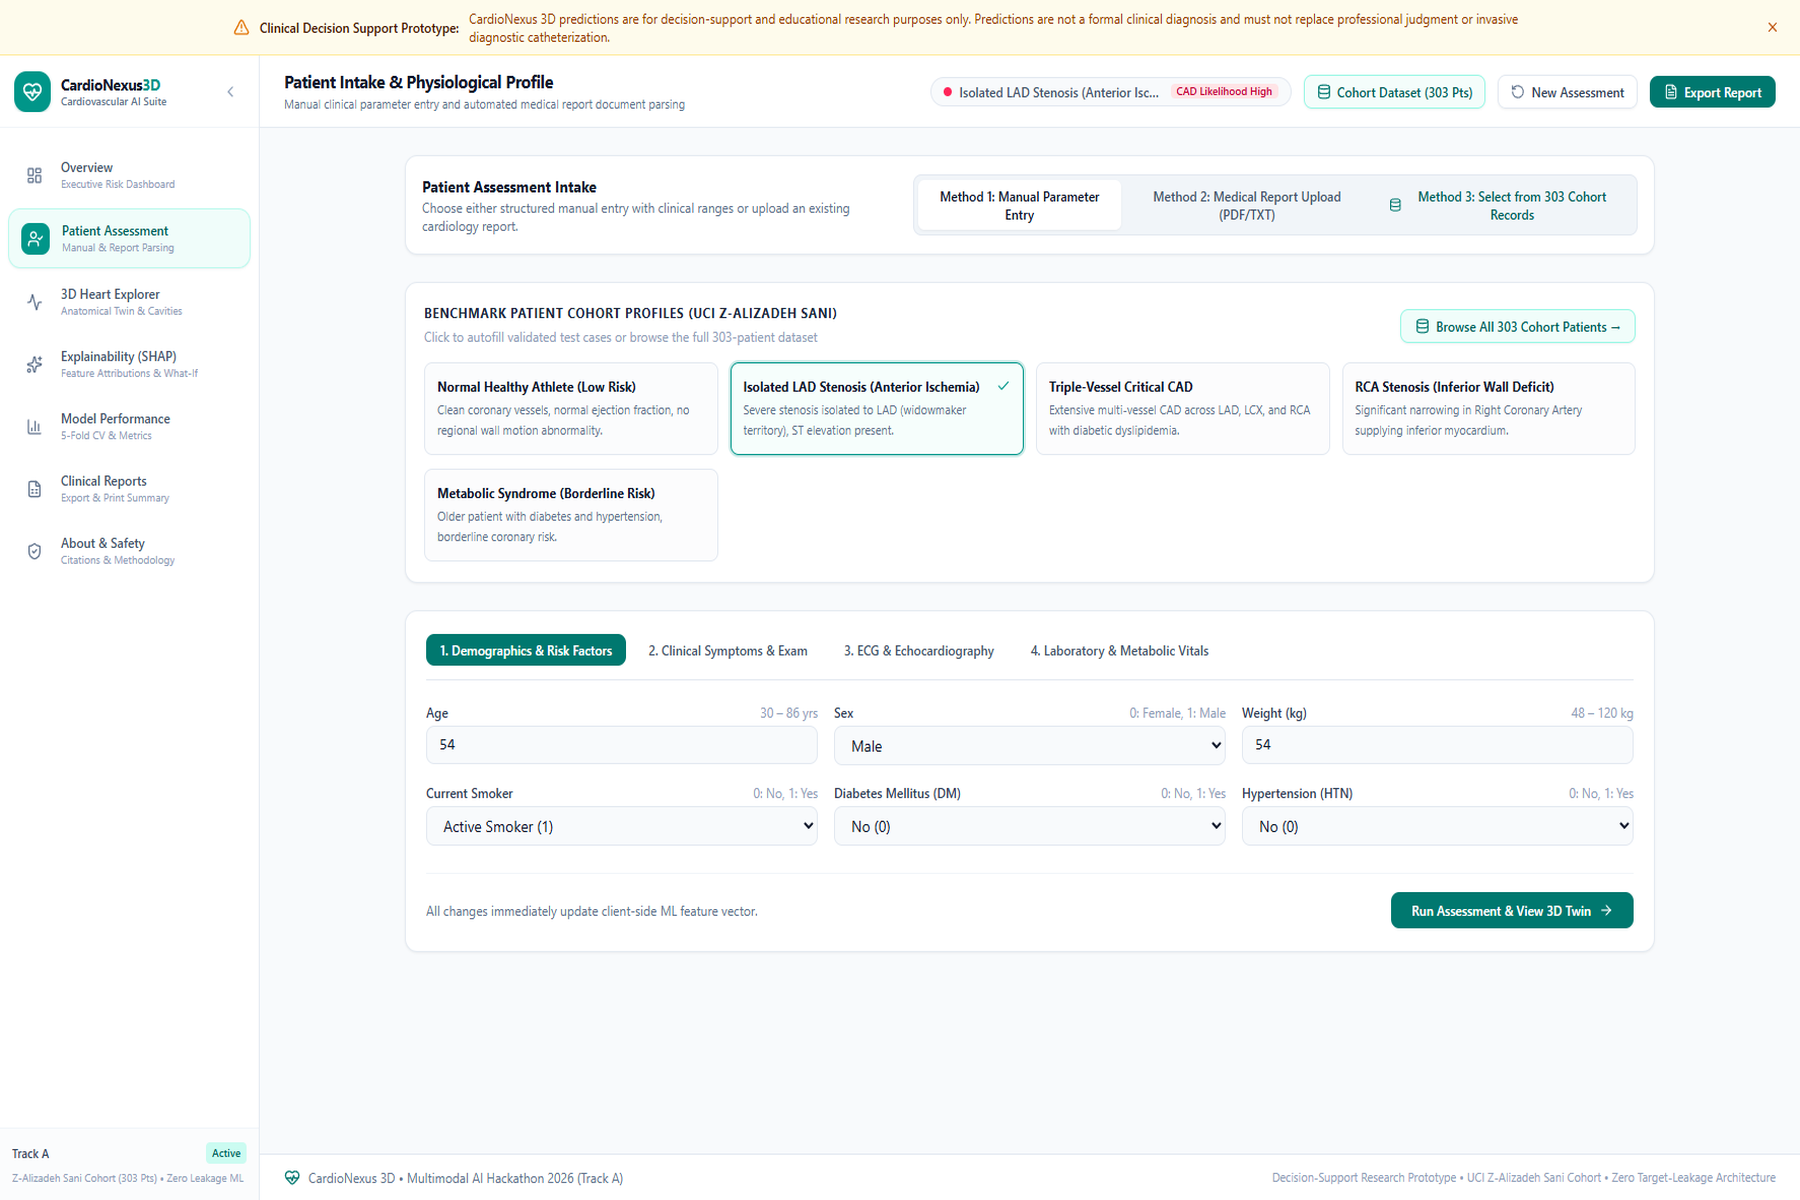
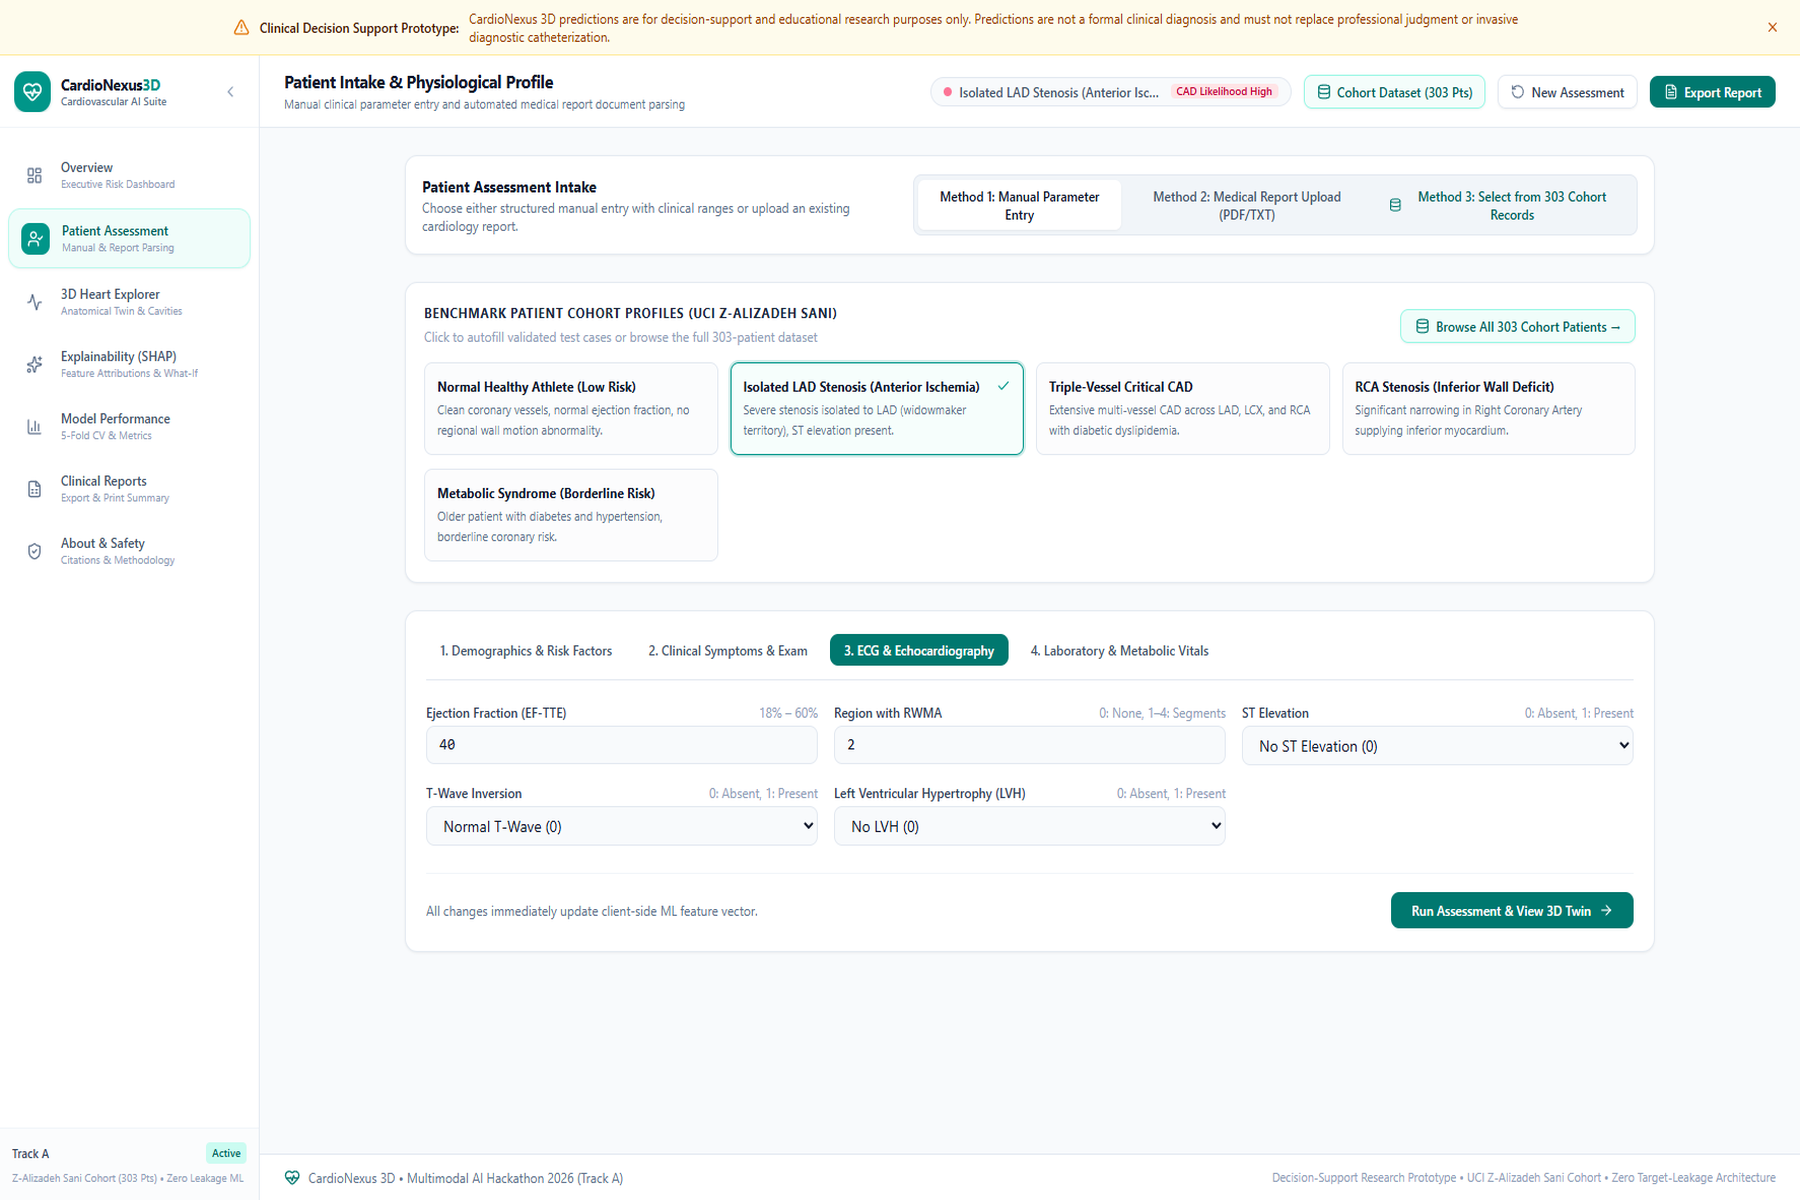
Medical Report PDF Parser
-
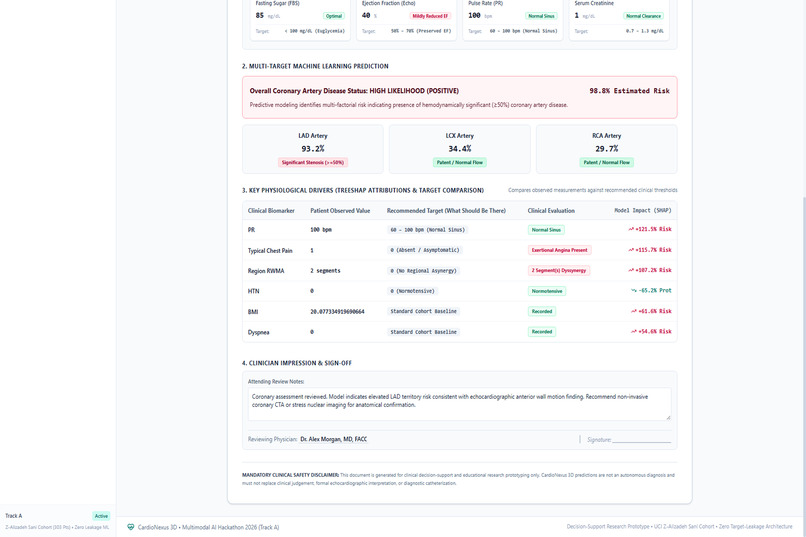
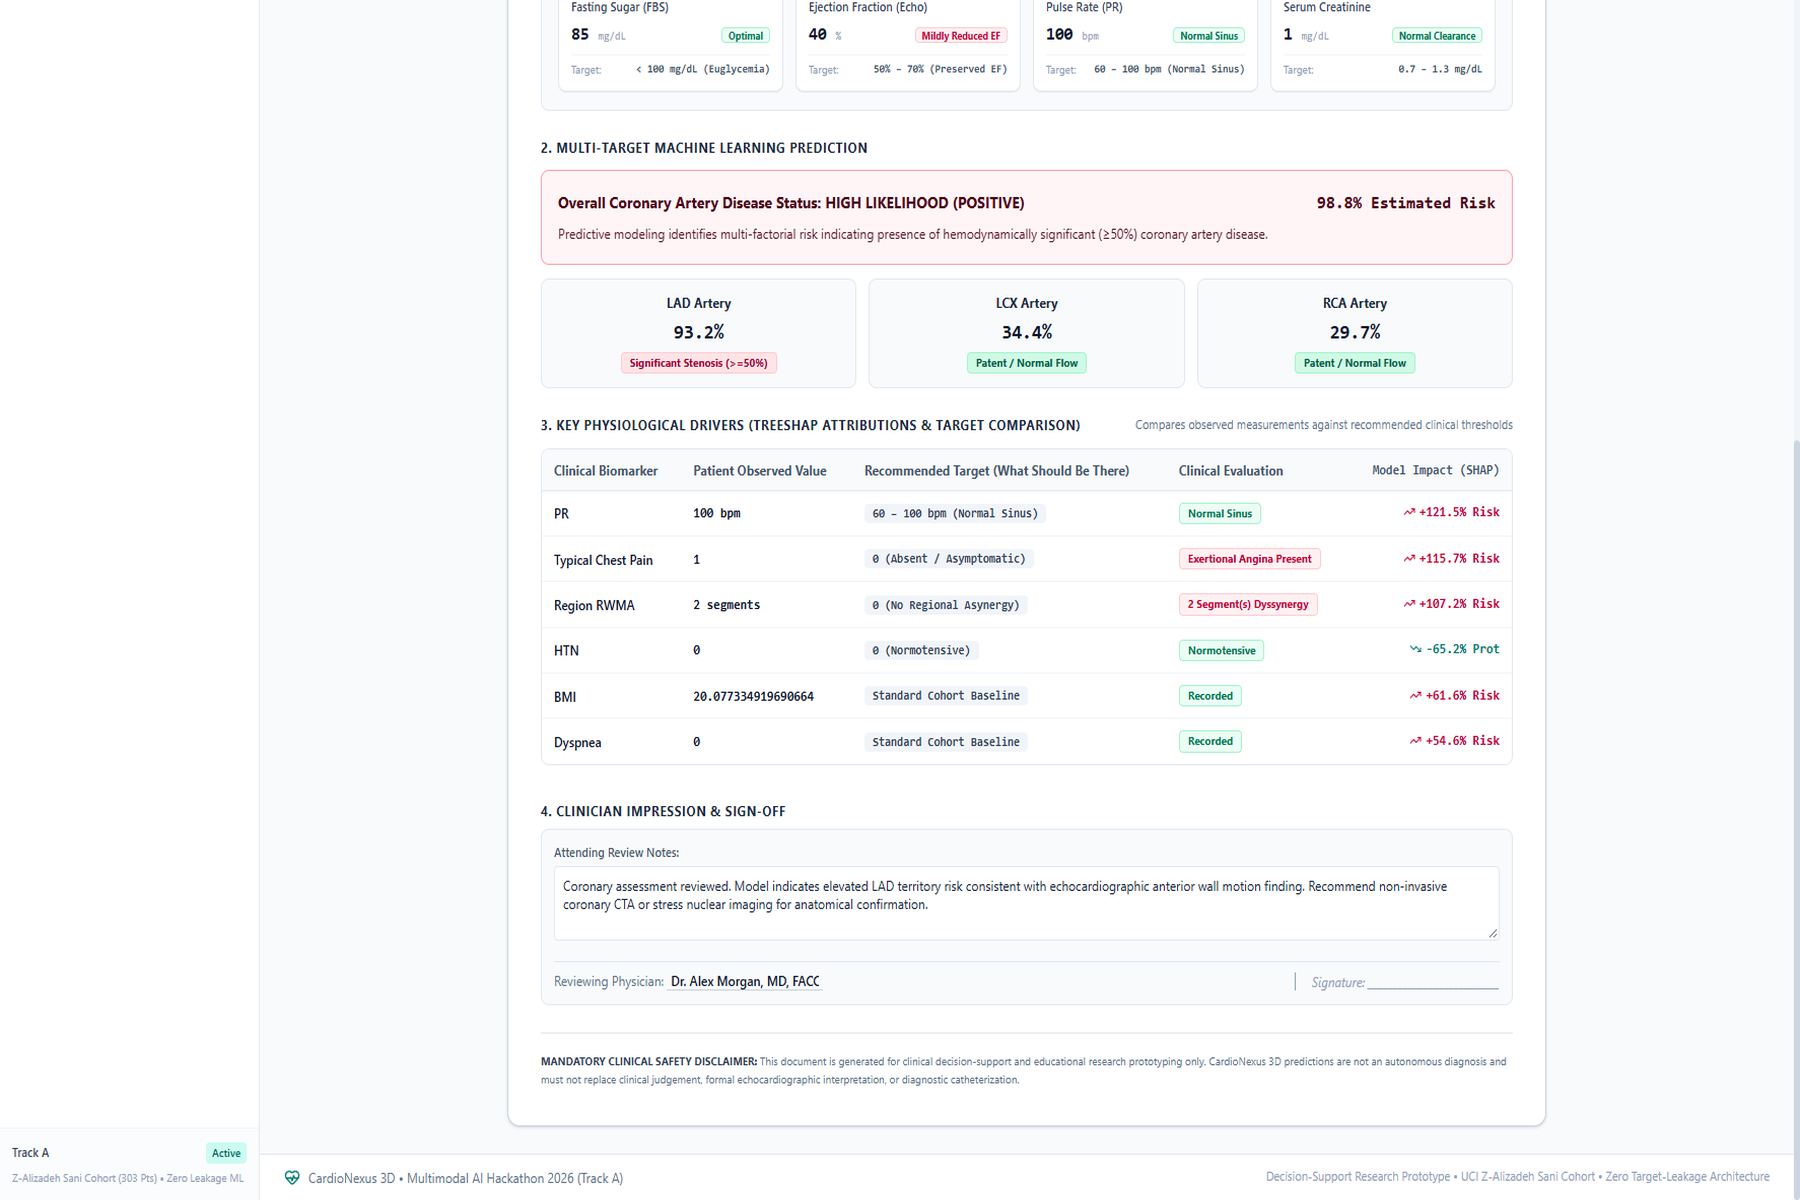
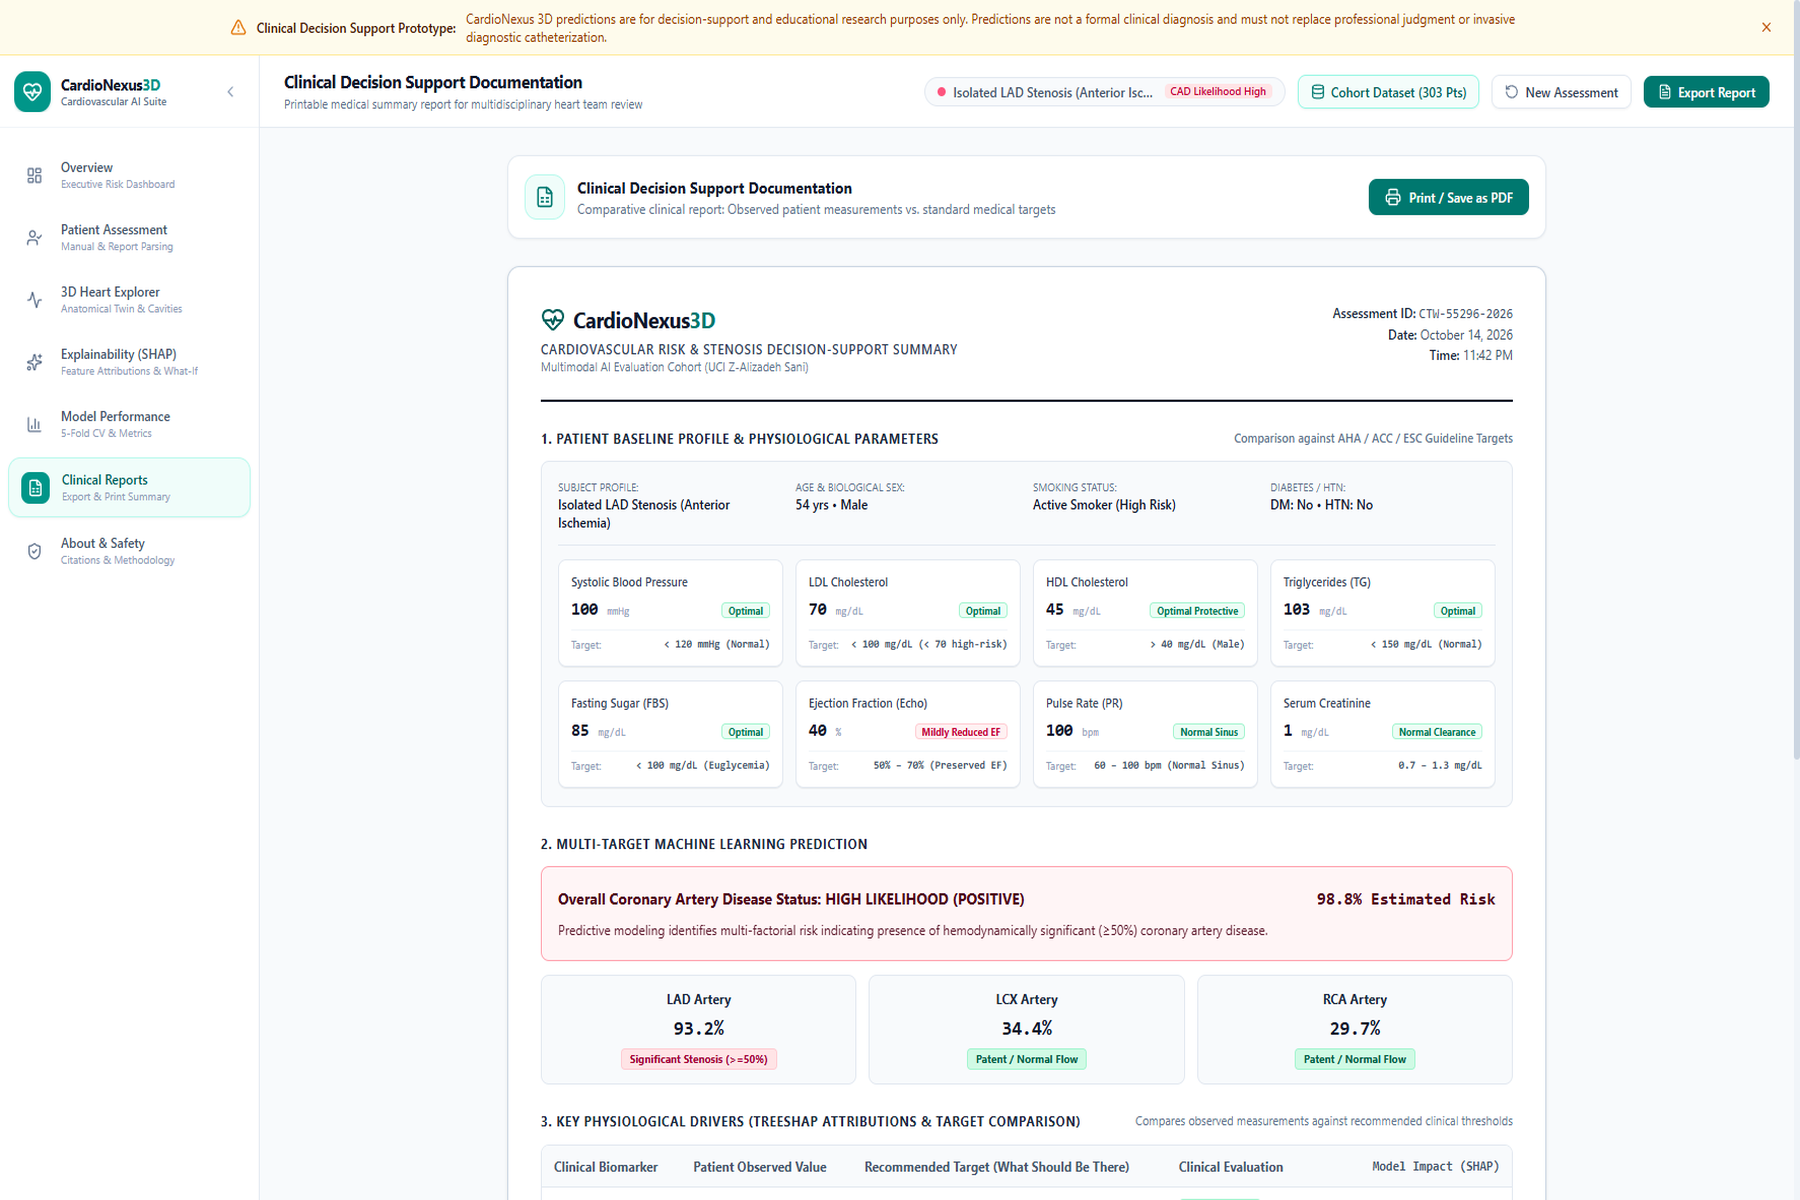
Printable Clinical Summary
-
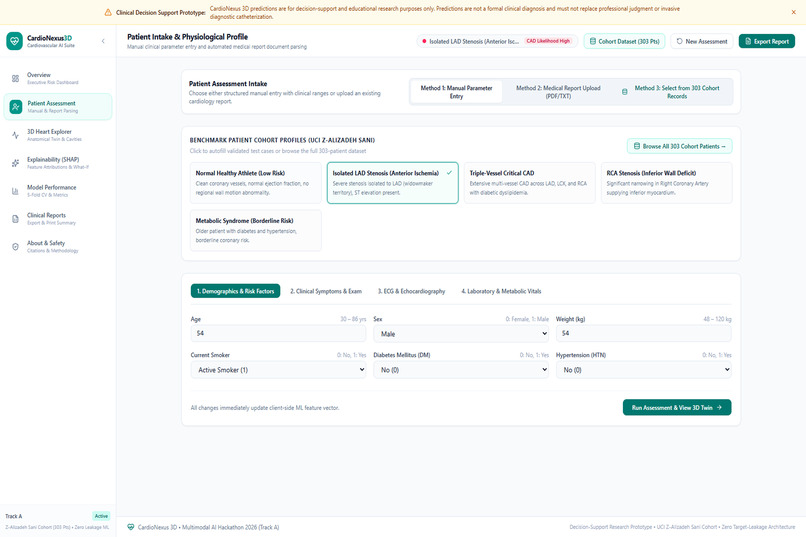
Structured Manual Entry
-
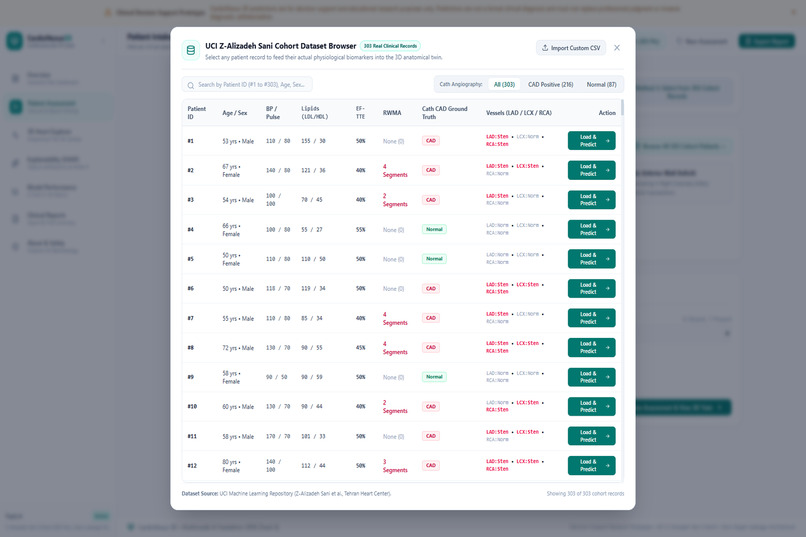
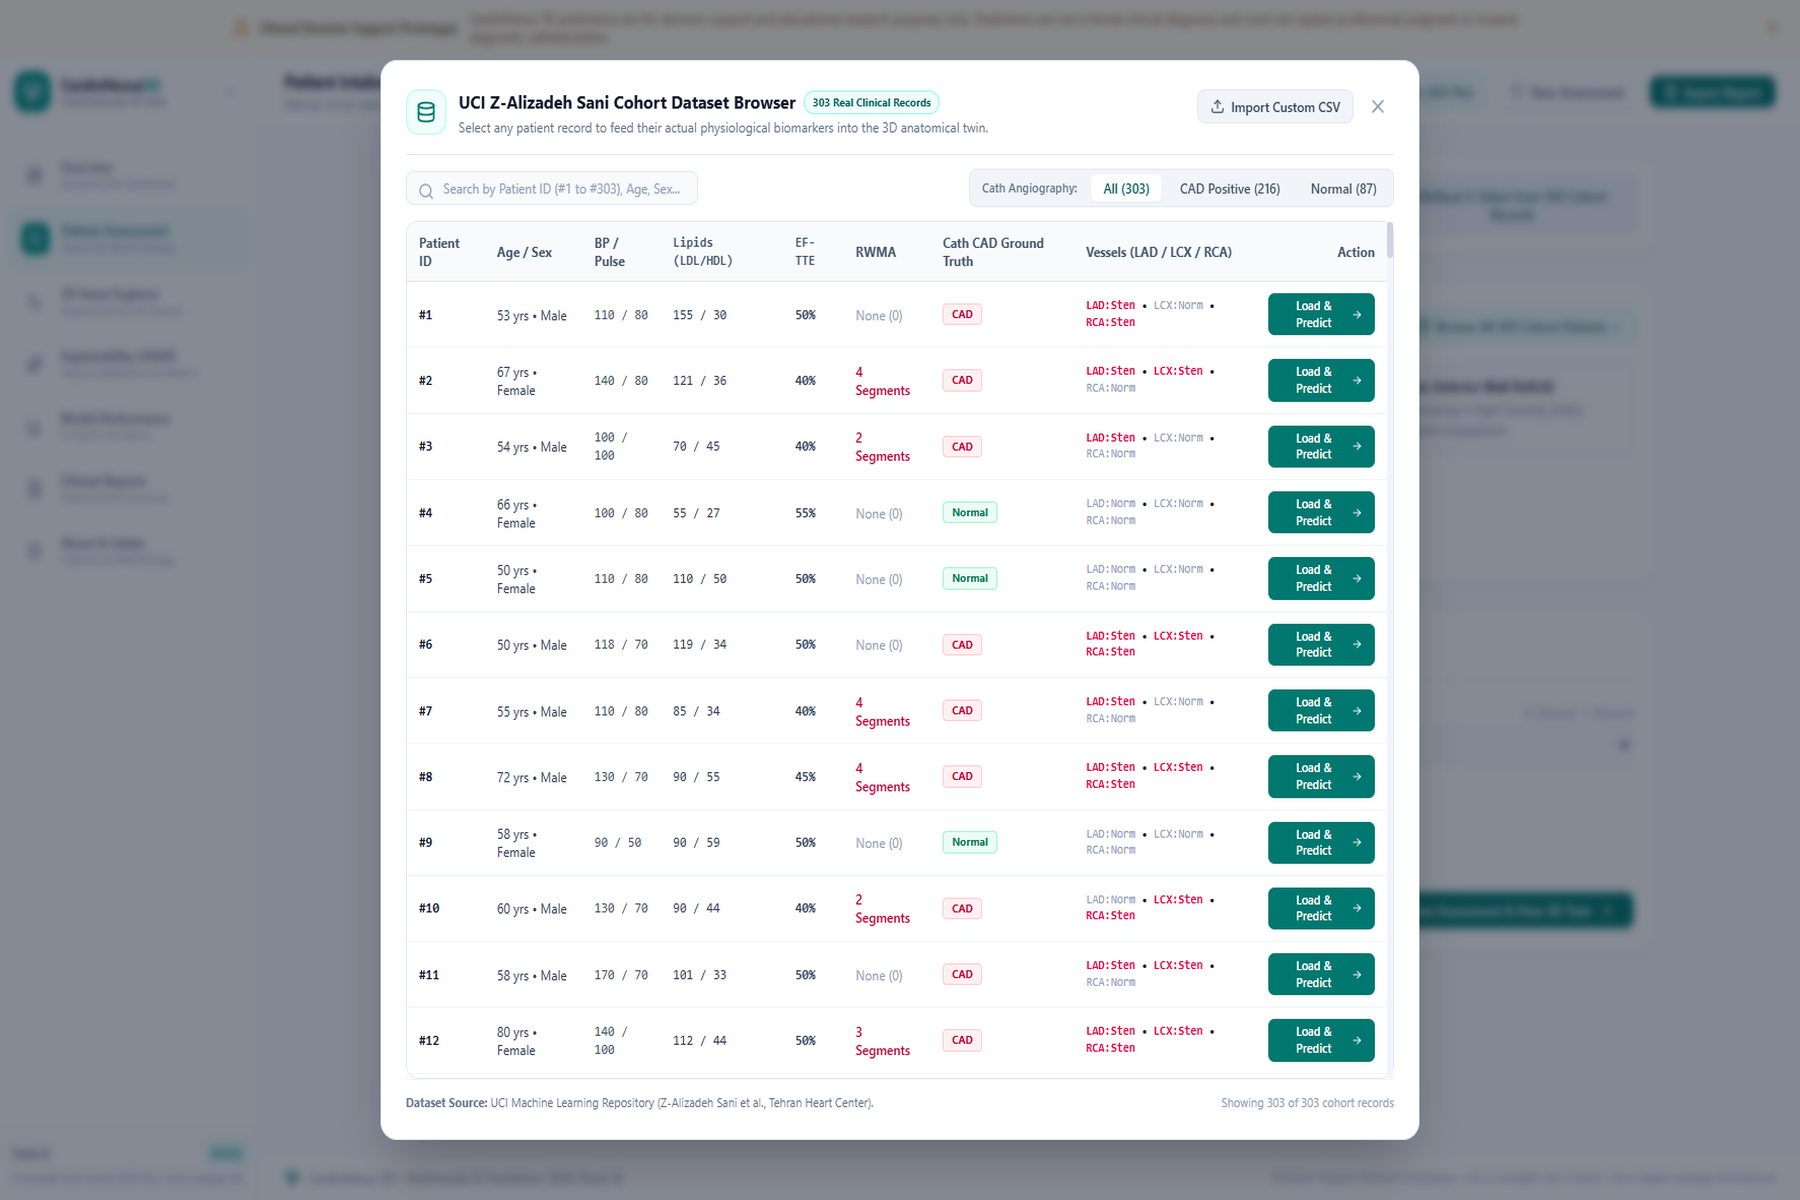
Cohort Dataset Explorer
-
What-If Treatment Simulator
-
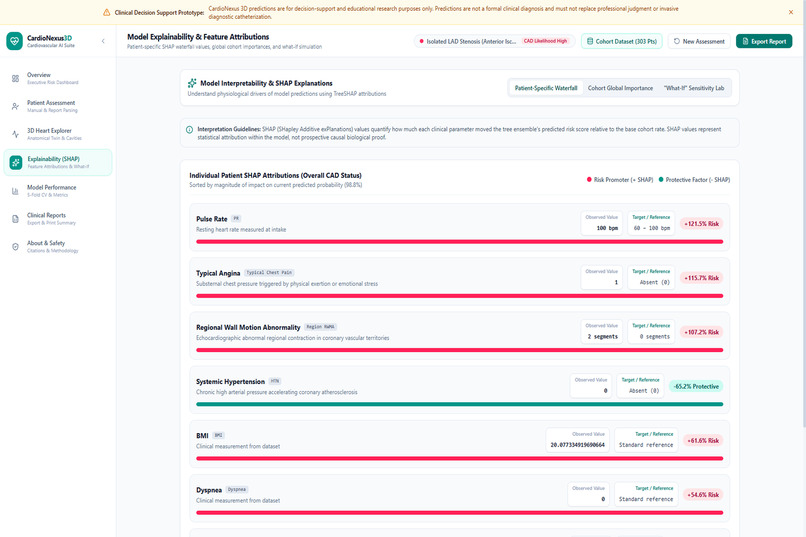
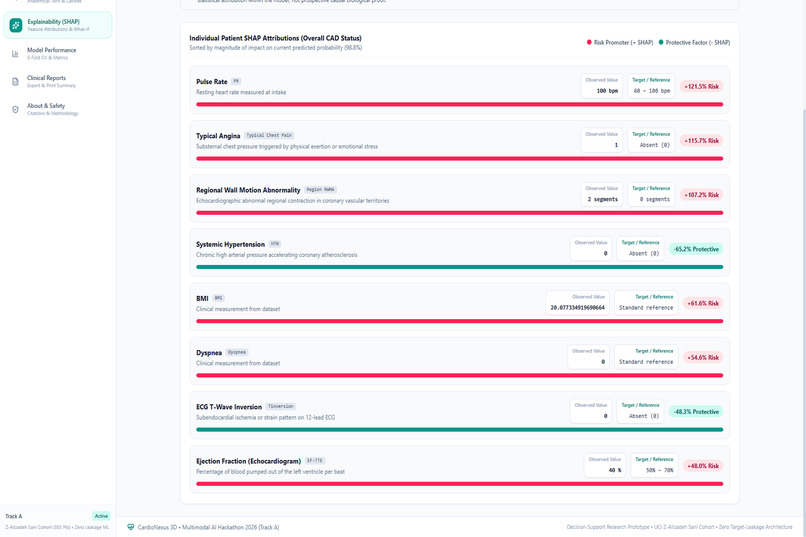
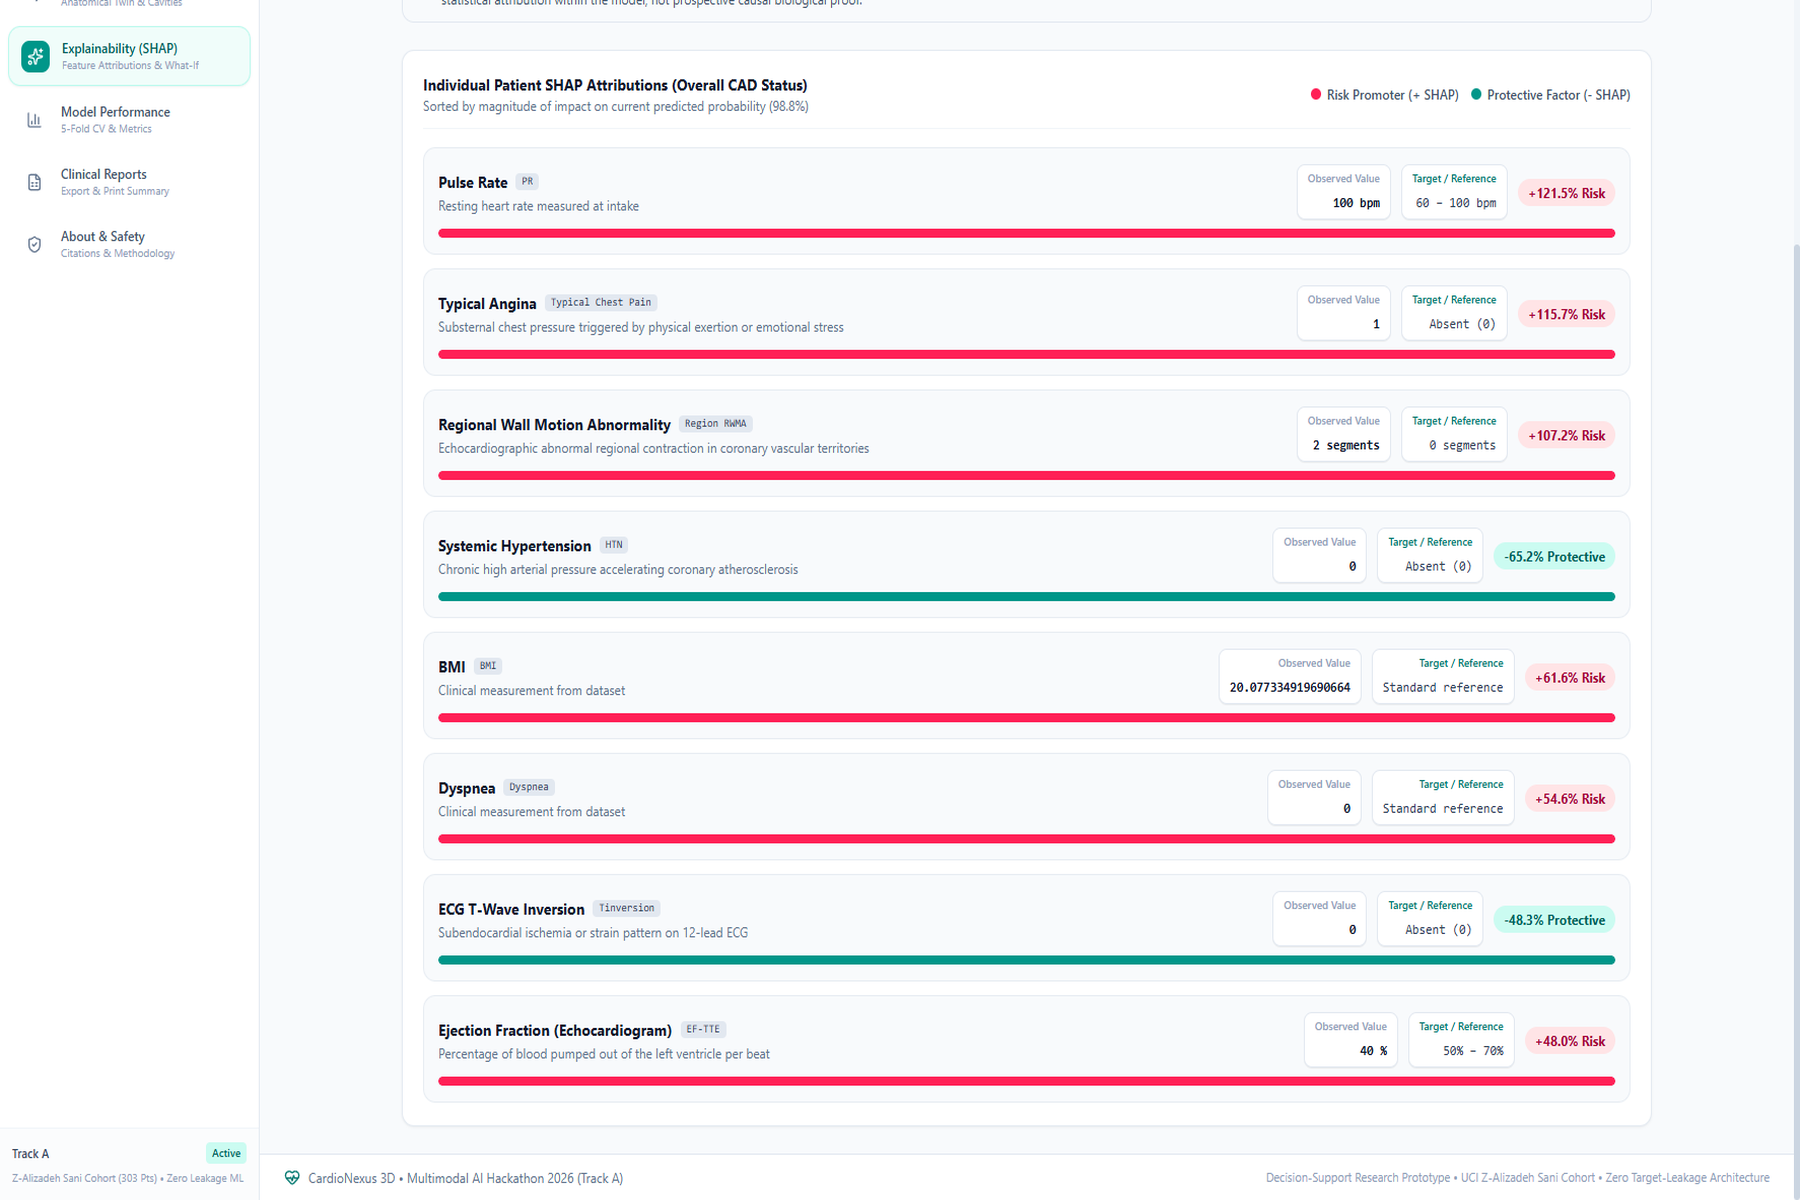
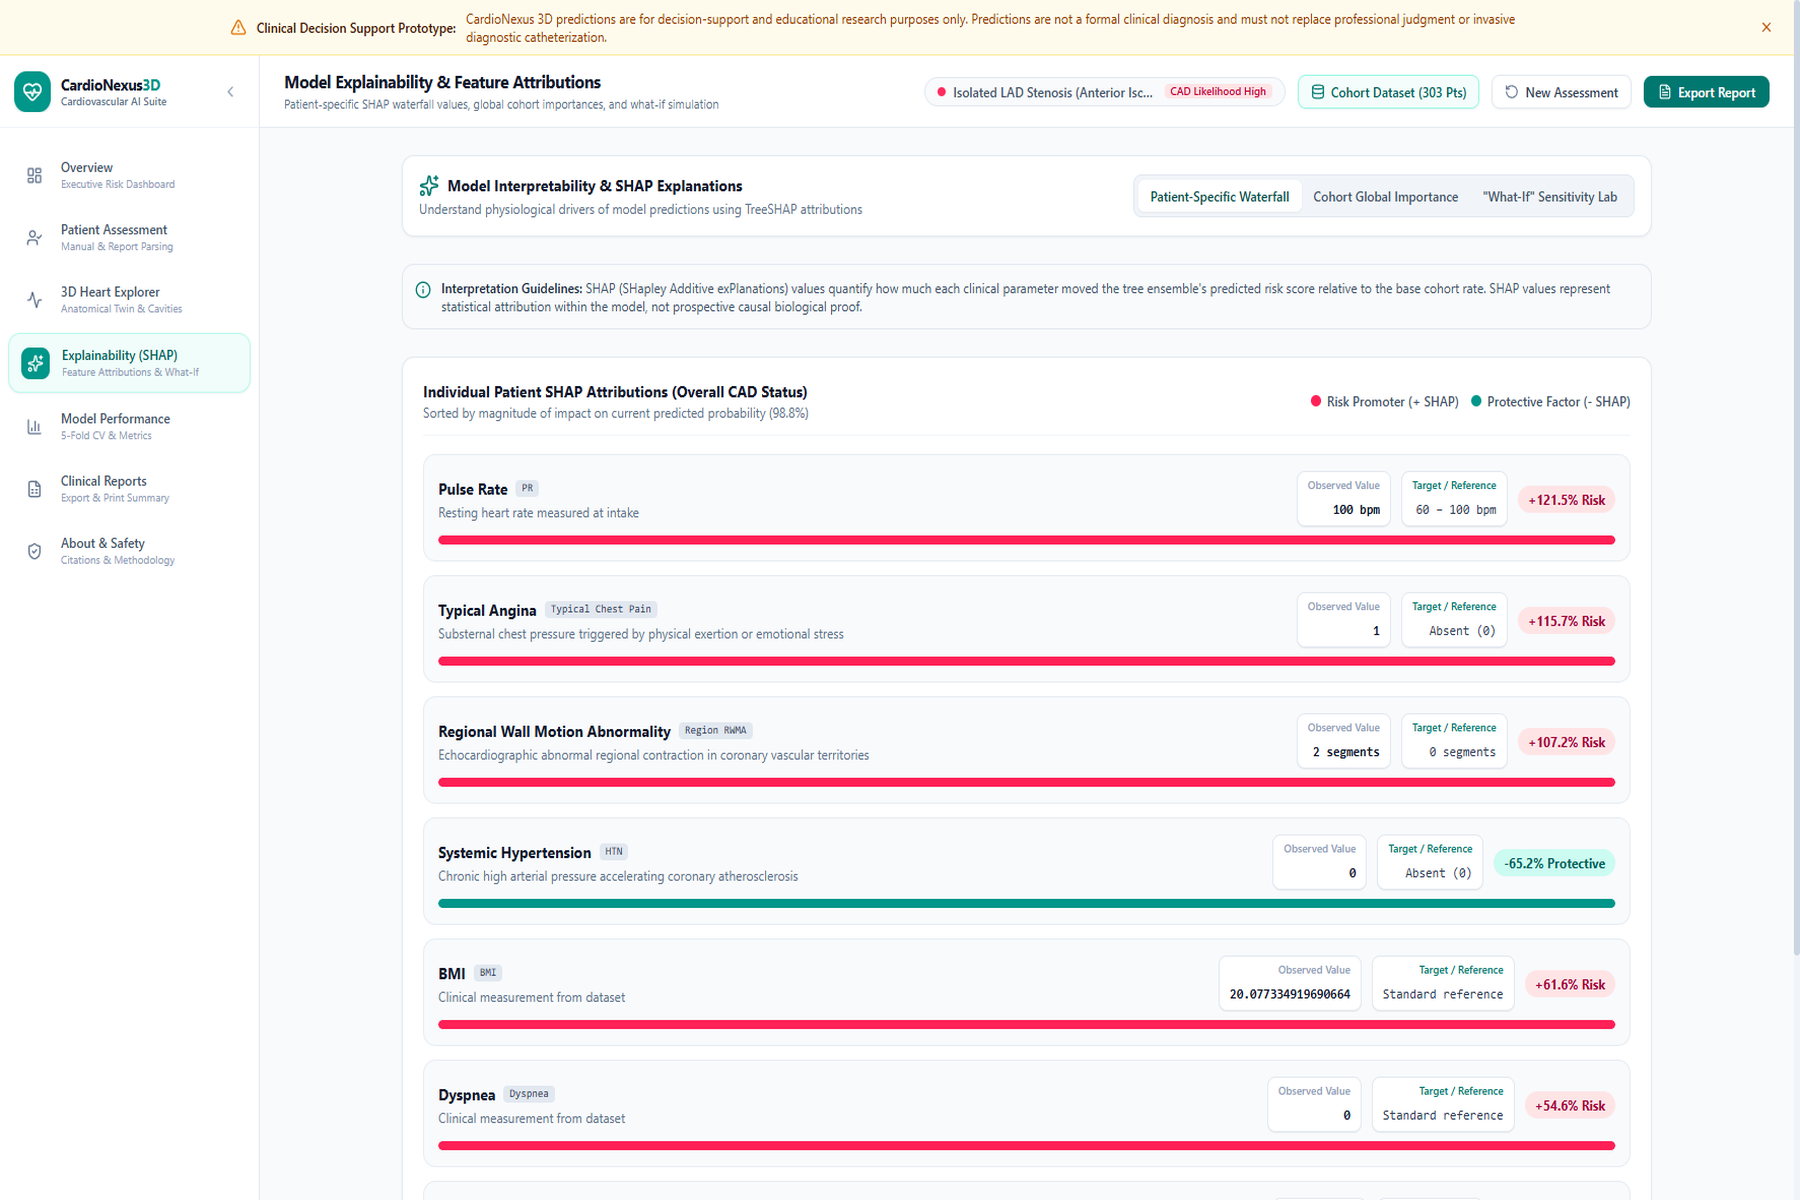
TreeSHAP Explainability
-
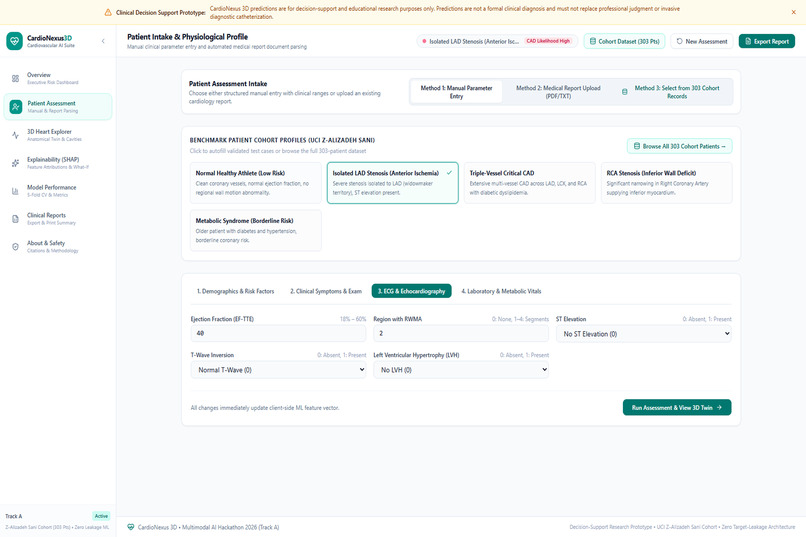
ECG & Echocardiography
-
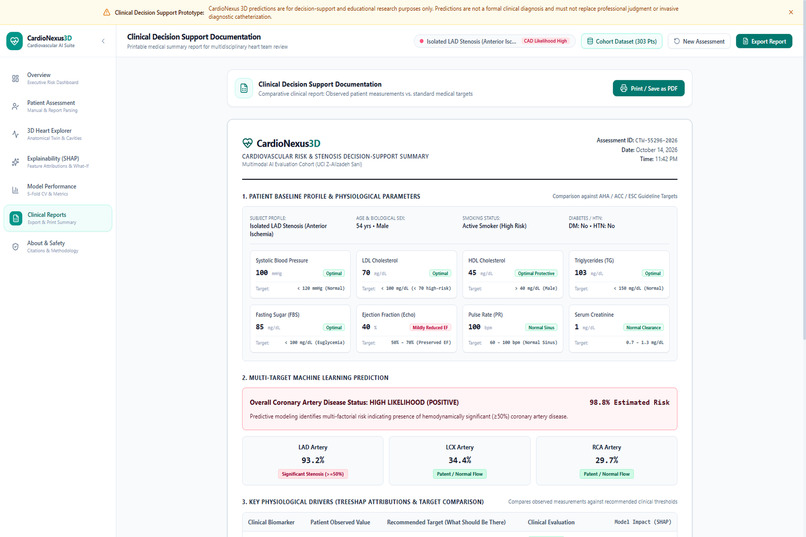
Clinical Target Benchmarking
-
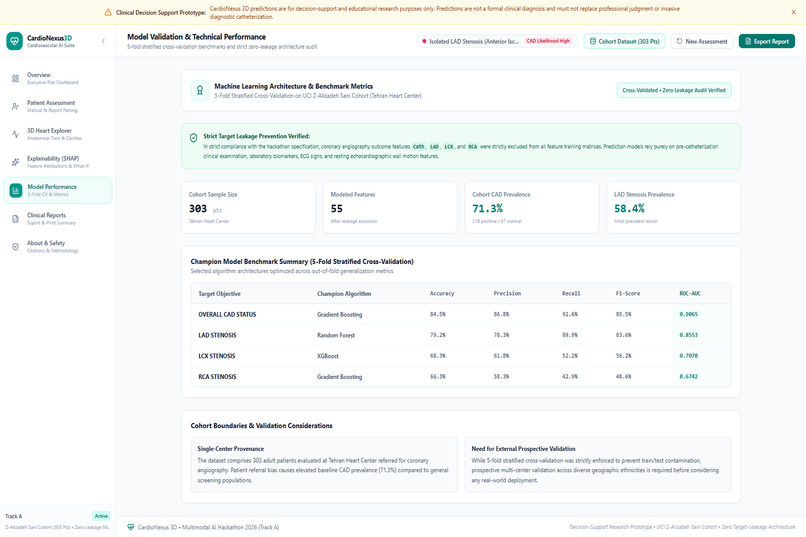
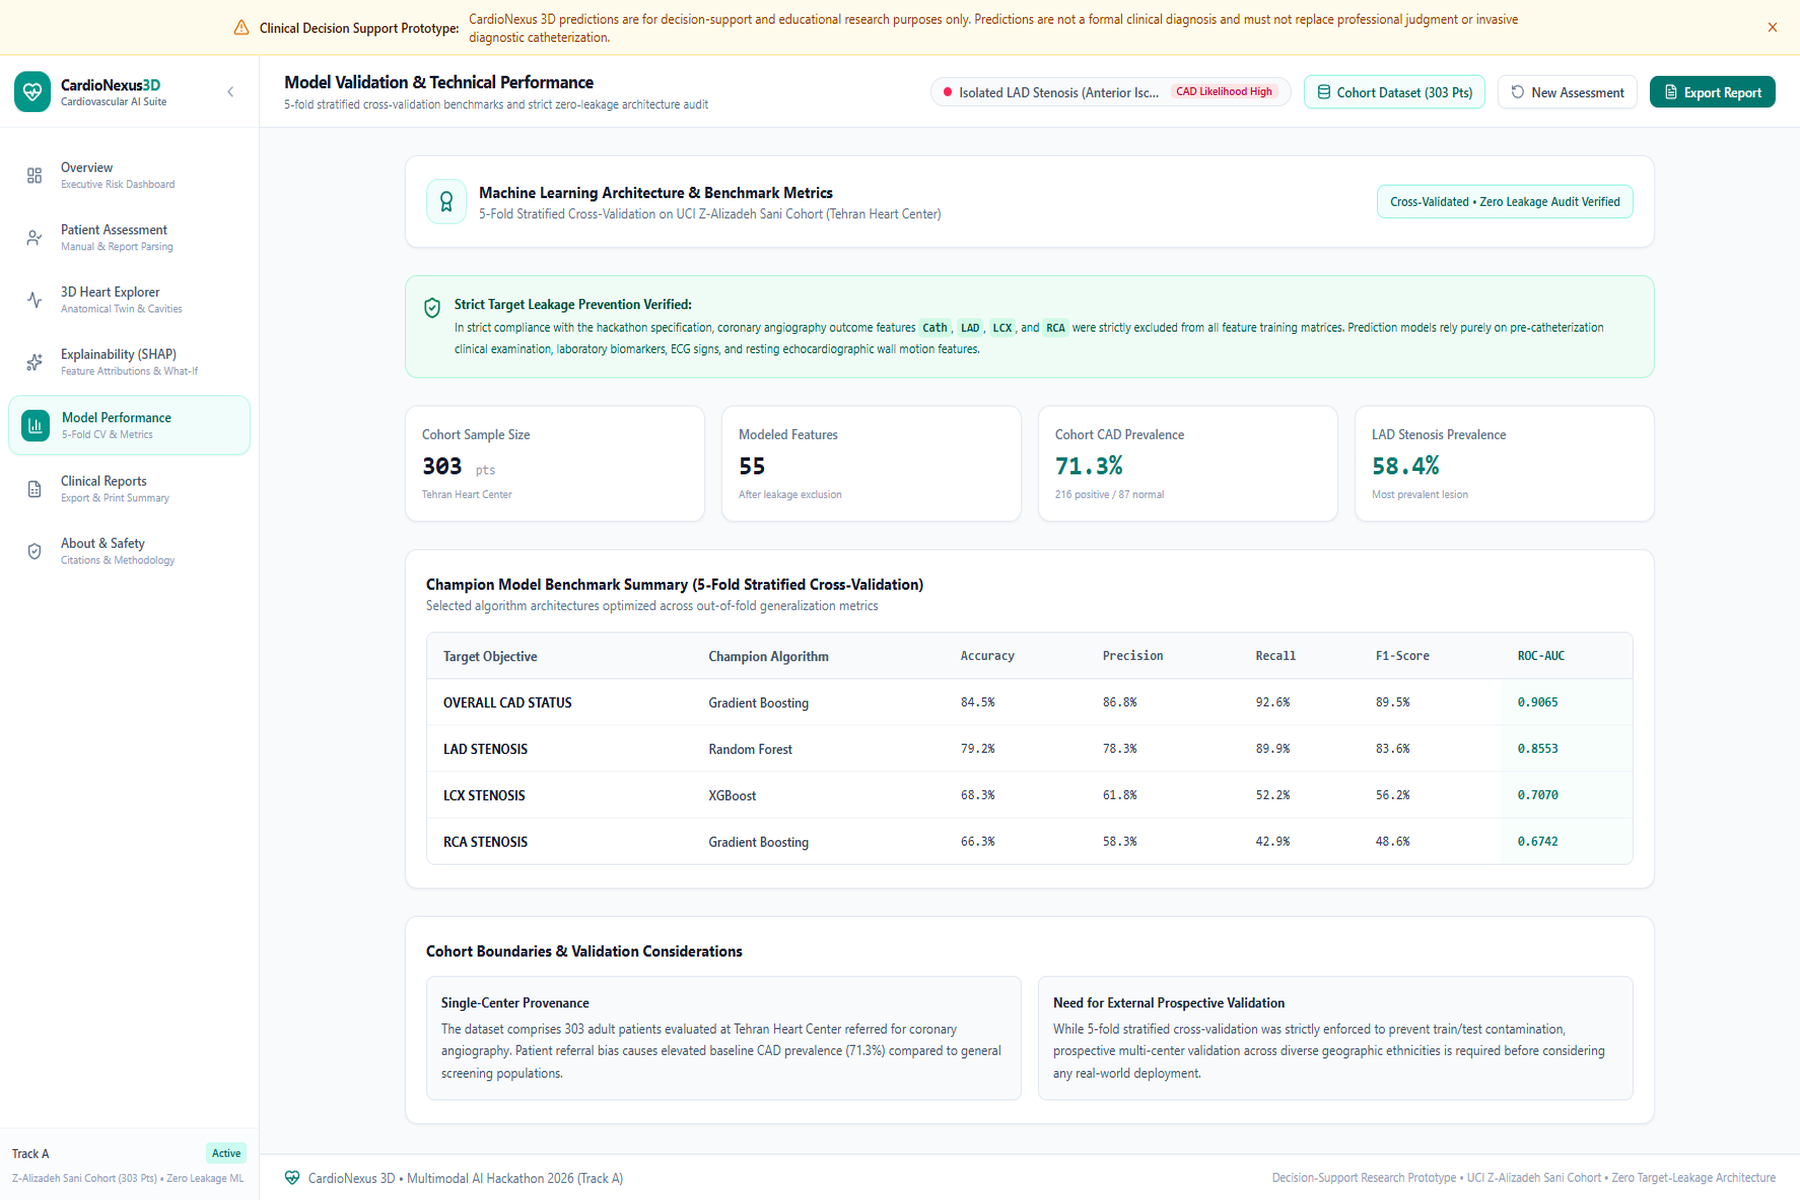
Zero Target-Leakage Architecture
-
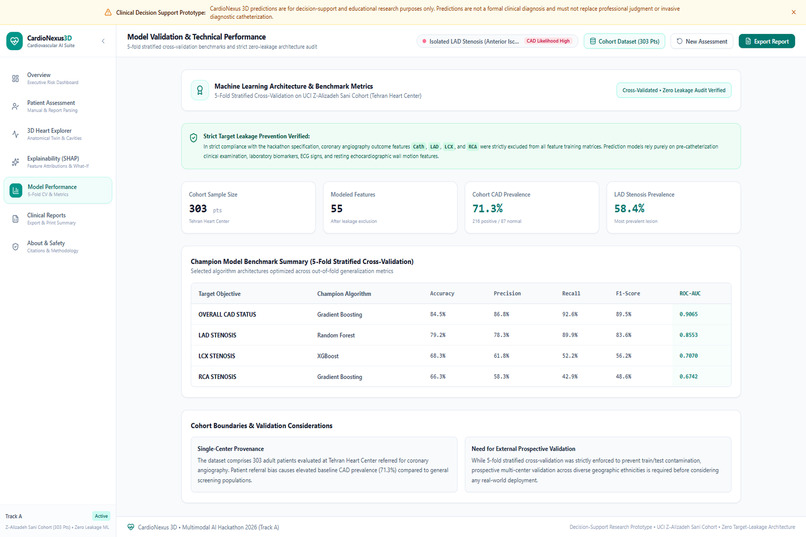
Model Performance Benchmarks
-
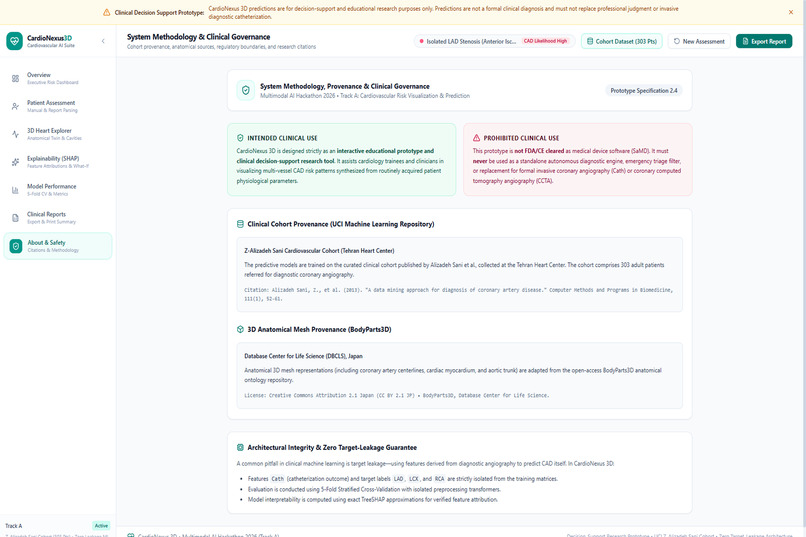
Clinical Safety & Governance
-
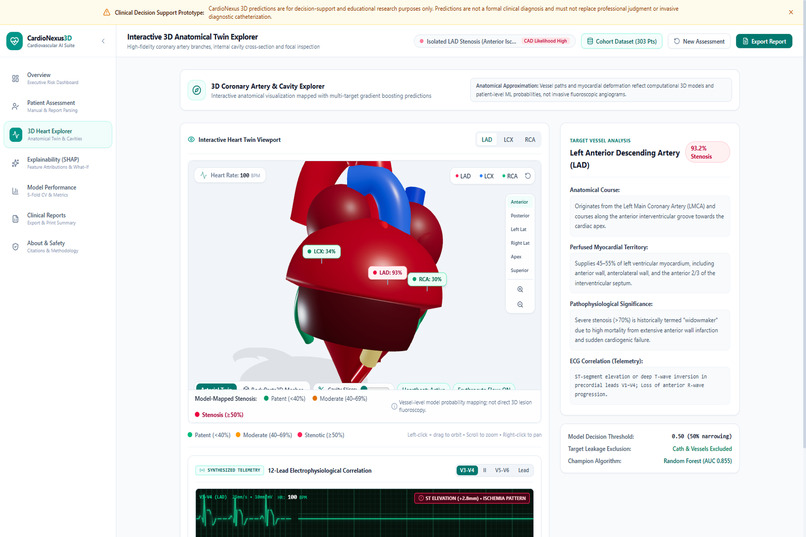
3D Heart Explorer
-
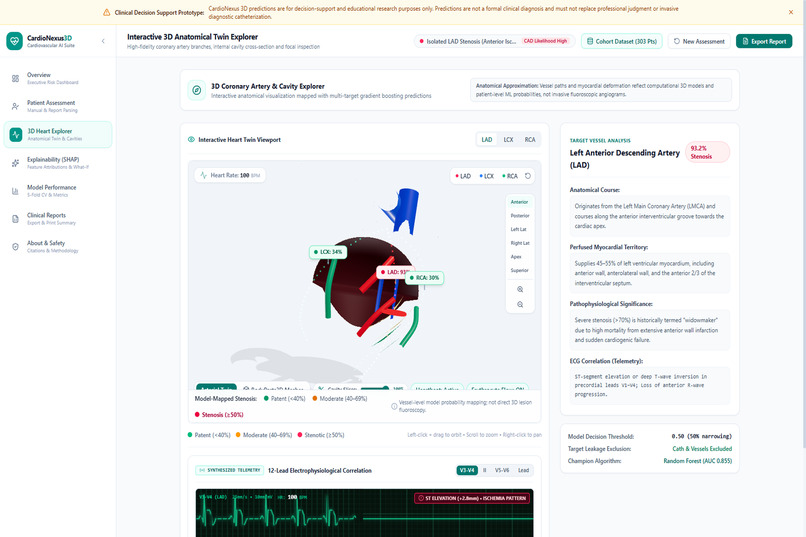
4-Chamber Cavity Slicer
-
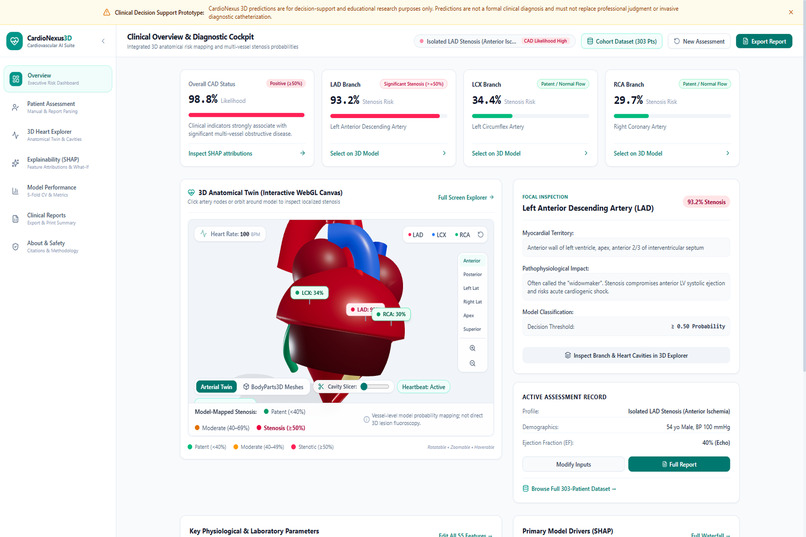
Overview Dashboard
Inspiration
Cardiovascular disease is a major health concern, and understanding coronary artery disease (CAD) can be challenging when medical information is presented through complex reports and numbers. We wanted to explore how artificial intelligence and interactive 3D visualization could make cardiovascular risk information easier to understand.
This idea inspired us to build CardioTwin 3D, an interactive platform that combines AI-based cardiovascular risk prediction with a three-dimensional heart visualization.
What it does
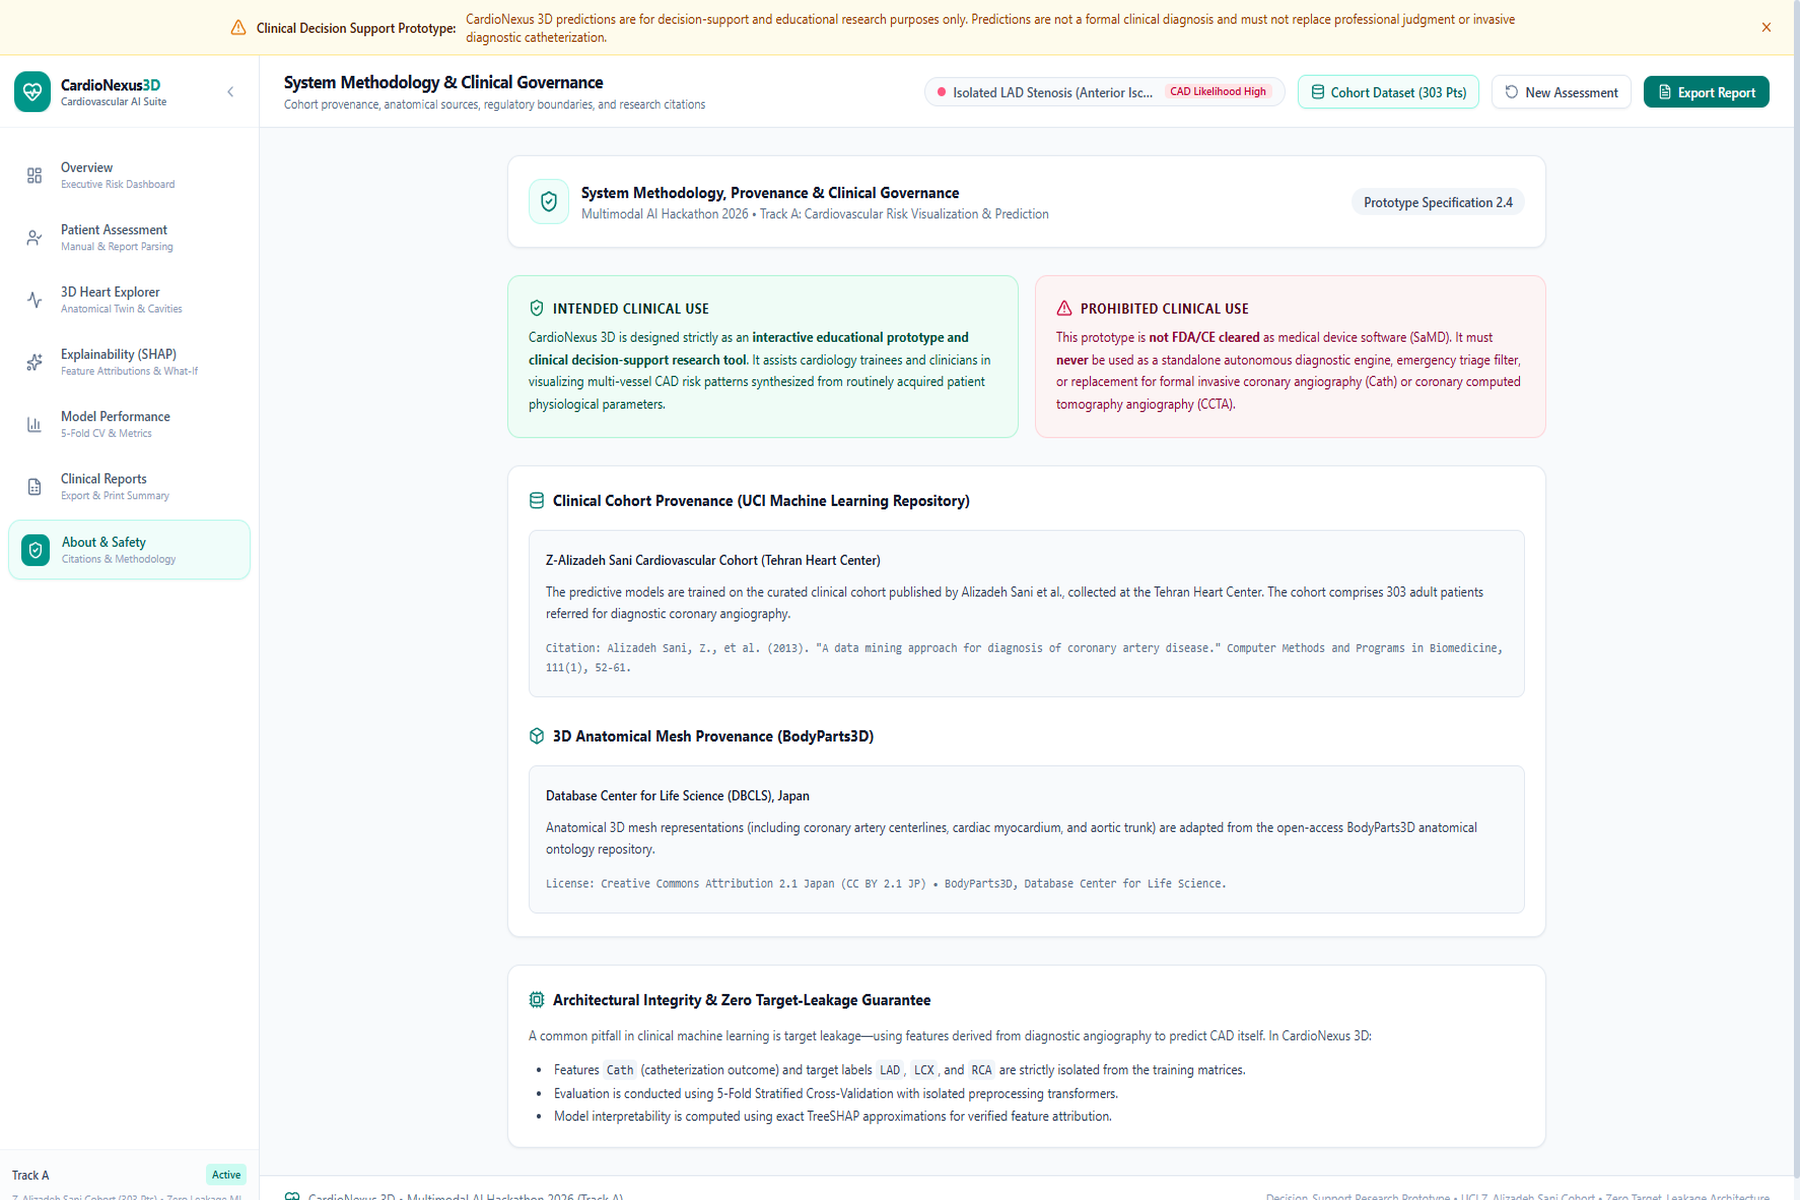
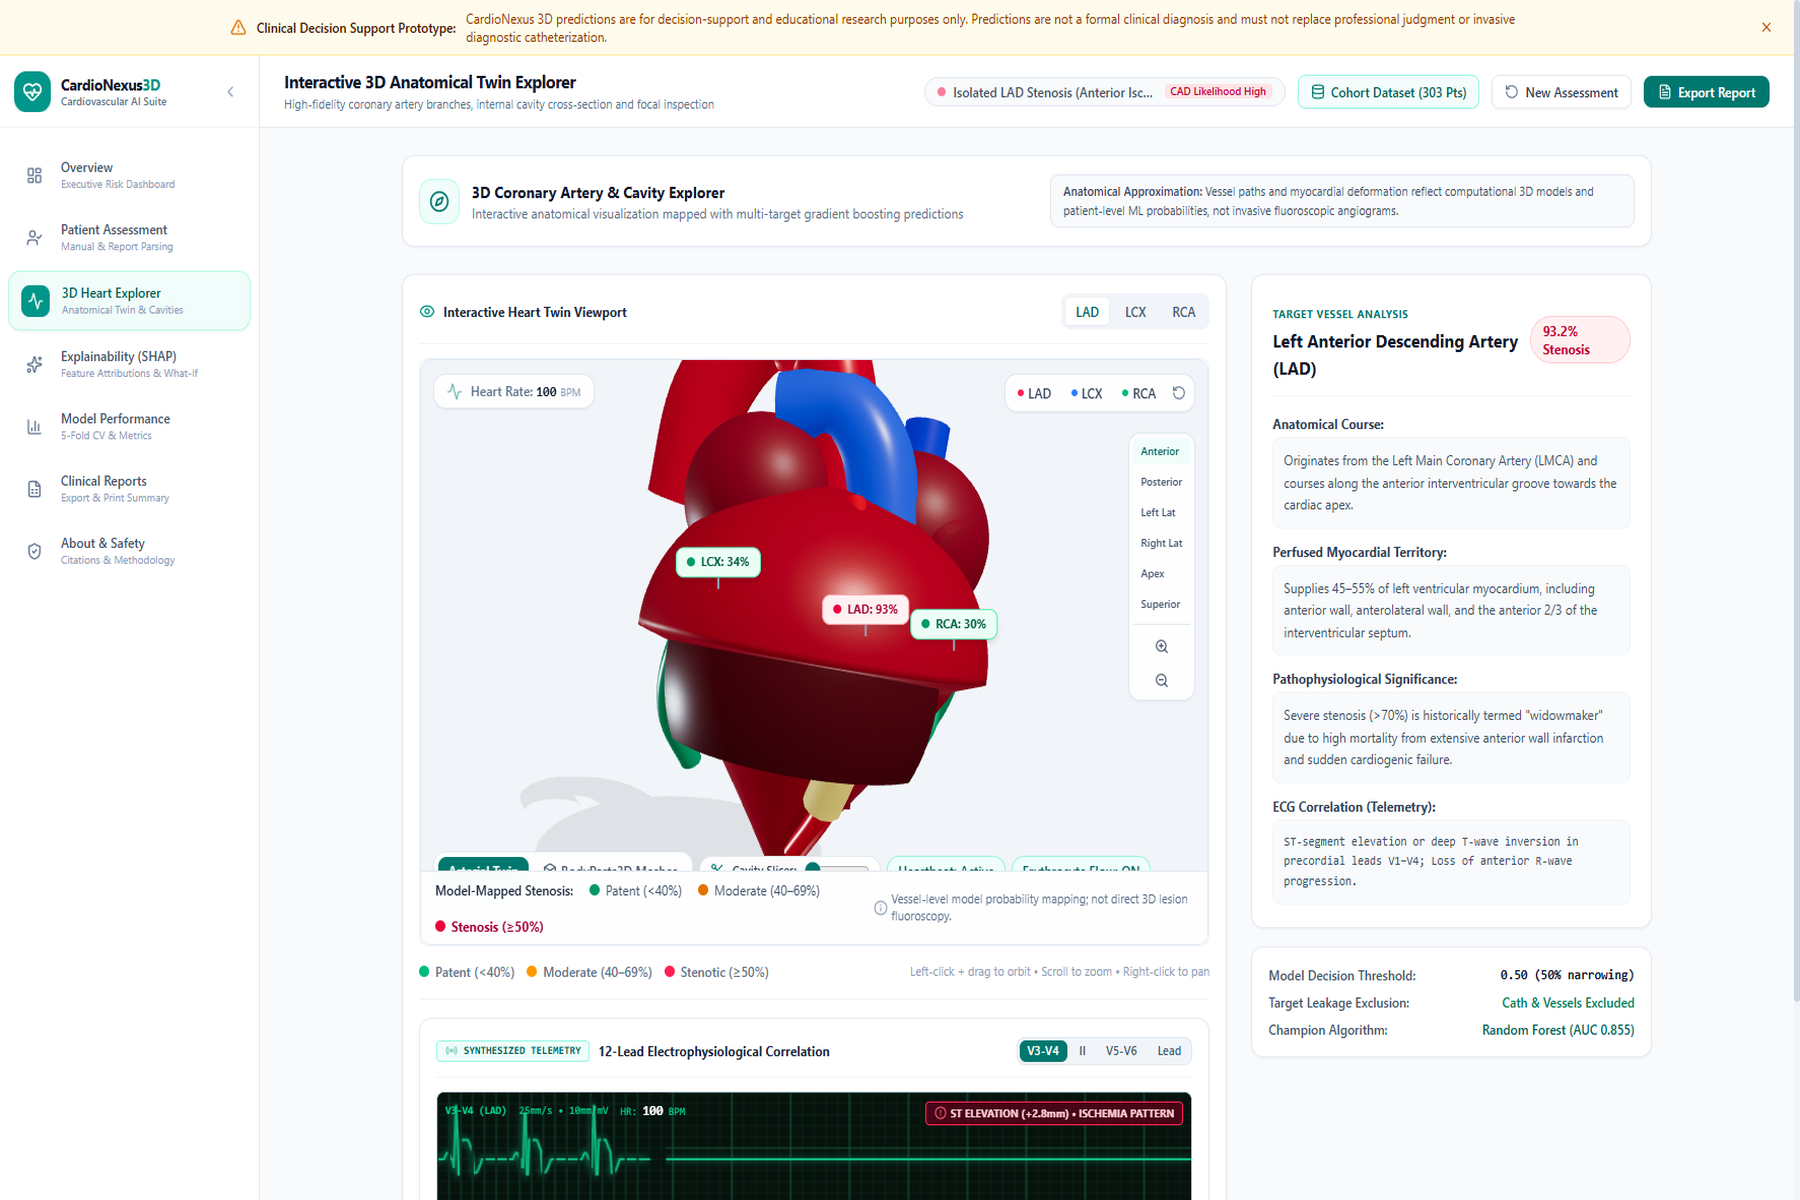
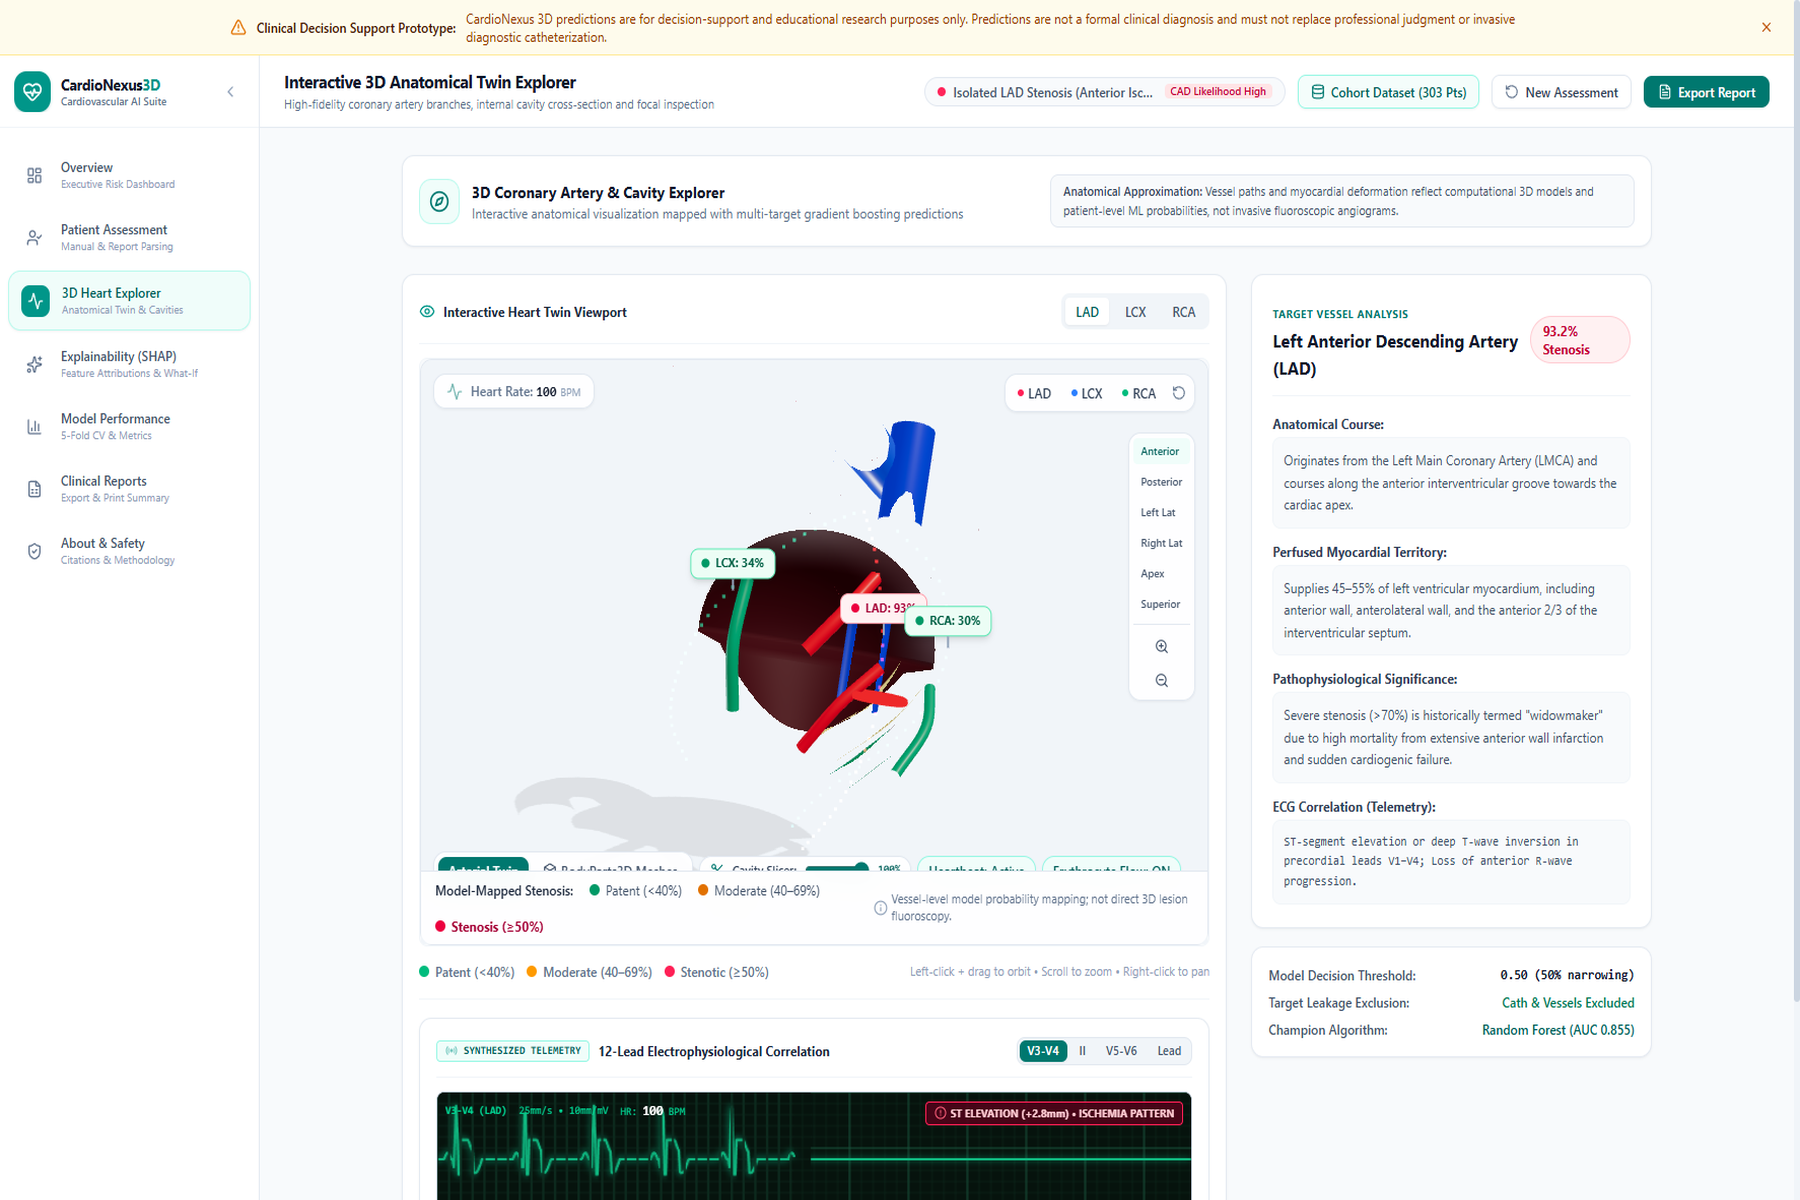
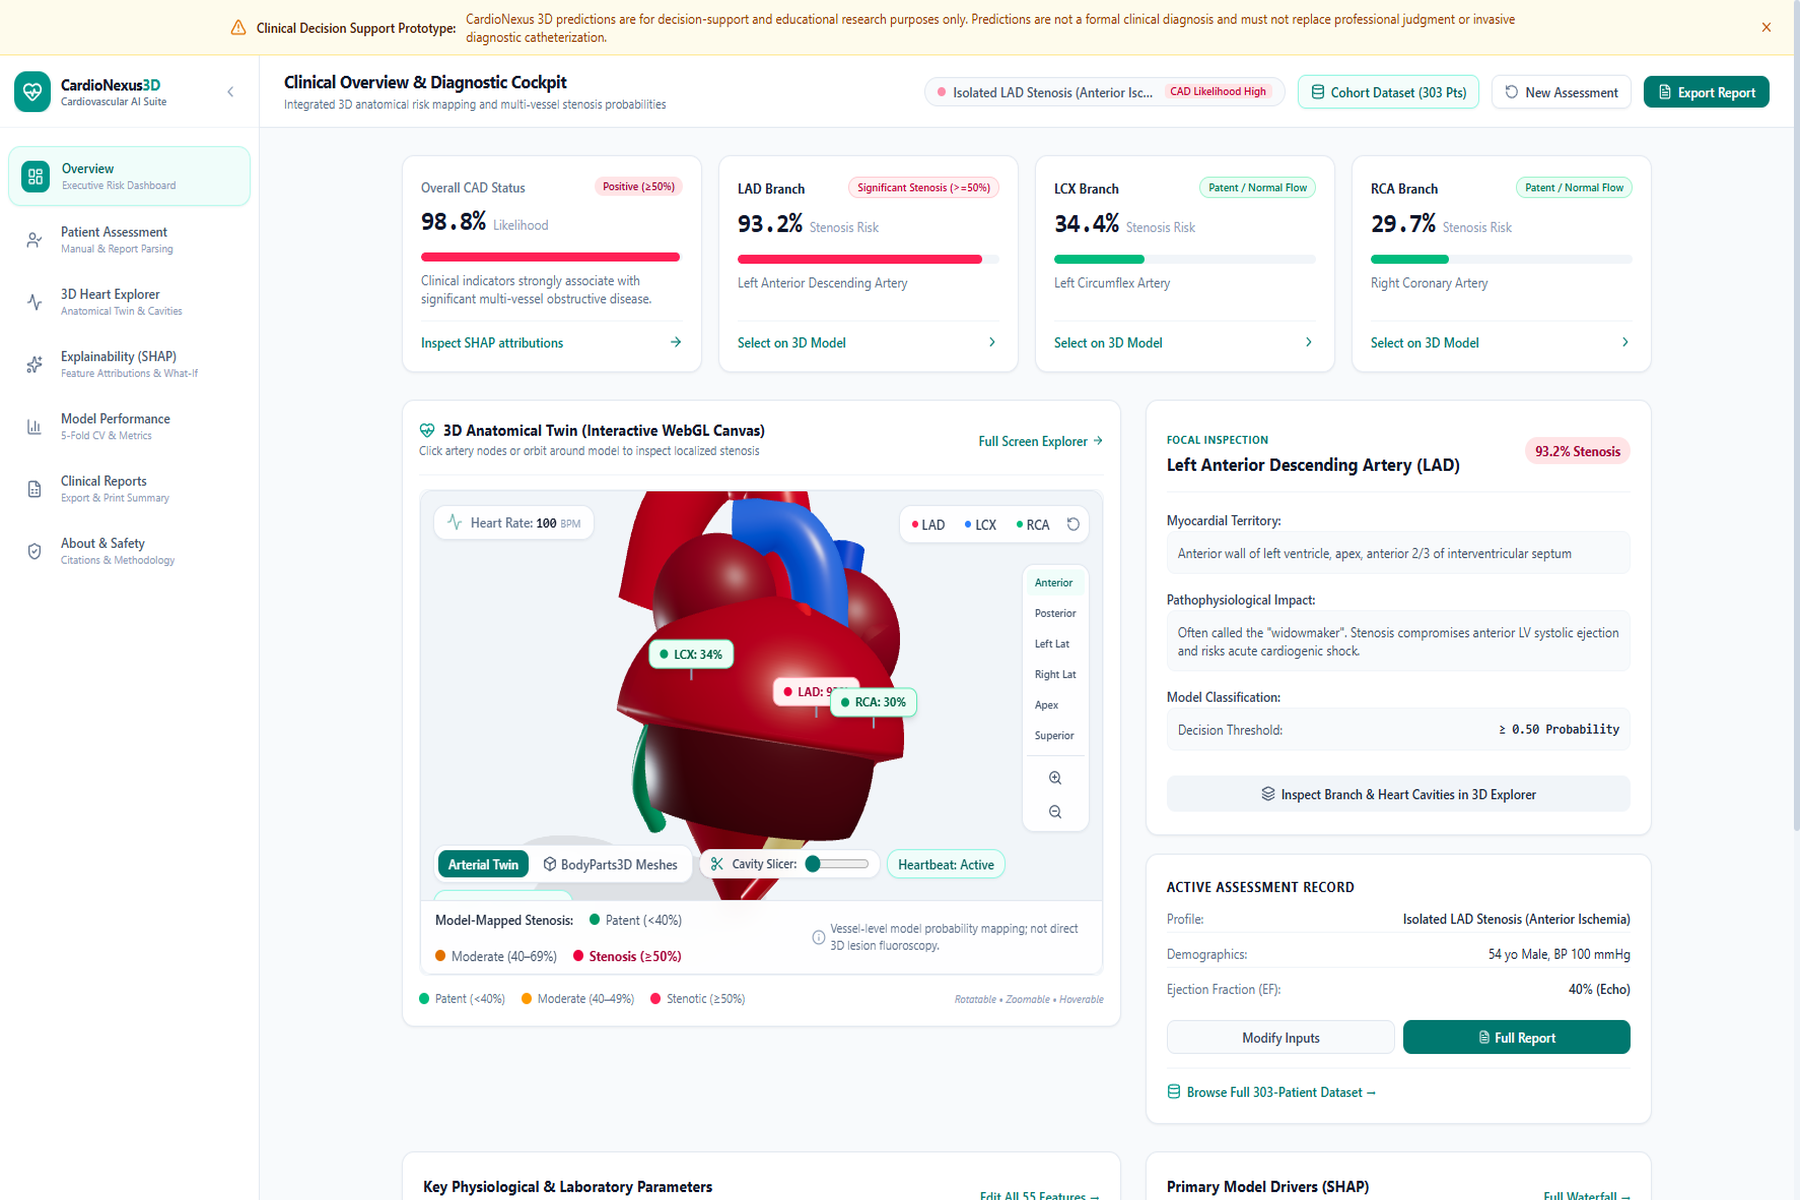
CardioTwin 3D is a web-based cardiovascular risk visualization and prediction prototype. It aims to estimate the probability of coronary artery disease and provide individual risk insights for three major coronary arteries: the left anterior descending (LAD), left circumflex (LCX), and right coronary artery (RCA).
The platform brings together patient measurements, risk prediction summaries, an interactive 3D heart, and feature-contribution insights. By connecting clinical inputs with visual representations, it aims to make complex cardiovascular data easier to explore and interpret.
CardioTwin 3D is designed for educational and research purposes. Its predictions are not a substitute for professional medical advice, diagnostic imaging, or clinical evaluation.
How we built it
We built CardioTwin 3D as a web application that combines a cardiovascular dashboard with interactive three-dimensional visualization. The interface brings together patient input fields, overall CAD risk, vessel-level risk indicators, and model explanation concepts.
Our approach focuses on connecting machine learning with an intuitive visual experience. The intended prediction workflow uses relevant clinical and demographic features, while evaluation metrics such as accuracy, precision, recall, F1-score, and ROC-AUC can help assess model performance. Explainability techniques such as SHAP can provide insights into how input features influence model predictions when integrated with the trained model.
We deployed the web prototype using Vercel to make it accessible through a browser.
Challenges we ran into
One of our biggest challenges was presenting complex cardiovascular information in a clear and organized way. Combining patient measurements, prediction summaries, explanations, and a 3D heart in one interface required careful attention to usability.
Another challenge was representing vessel-level predictions visually without suggesting that the system can identify an exact physical blockage from risk probabilities alone. We also recognized the importance of communicating uncertainty and distinguishing experimental AI predictions from confirmed clinical findings.
Accomplishments that we're proud of
We are proud to have developed a web-based prototype that brings cardiovascular risk visualization and interactive 3D exploration together. The project explores how visual representations can help users engage with AI-generated information rather than relying only on numerical outputs.
We also made the prototype publicly accessible, allowing others to explore the concept and providing a foundation for further development.
What we learned
We learned that building an AI-powered healthcare application involves more than generating predictions. Results must be understandable, the underlying model must be evaluated carefully, and limitations must be communicated responsibly.
We also gained experience in web application development, interactive visualization, integrating data-driven interfaces, and deploying a project for public access.
What's next for CardioTwin 3D
Our next steps include improving model reliability through rigorous validation, strengthening prediction explainability, and expanding model-performance reporting.
Built With
- 3dvisualisation
- ai
- datavisualisation
- healthcare
- machine-learning
- python
- react
- scitik-learn
- shap
- xgboost

Log in or sign up for Devpost to join the conversation.