Inspiration
Cardiovascular disease remains one of the leading causes of death worldwide, yet many machine-learning approaches to cardiac risk assessment ultimately reduce a complex clinical picture to a probability or risk score.
A prediction such as "65% risk" can be useful, but it does not intuitively answer some of the most important questions: Where is the risk? Which coronary artery is involved? What part of the myocardium could be affected? And how might the predicted risk change if modifiable clinical factors improve?
That gap inspired us to build CardioMap 3D.
Our goal was to move beyond static risk scores and create an interactive clinical decision-support experience where machine-learning predictions could be explored directly on a beating 3D anatomical heart.
We wanted to combine multimodal clinical data, machine learning, explainable AI, interactive 3D visualization, and counterfactual simulation into one system that makes cardiac risk more visual, interpretable, and actionable.
What it does
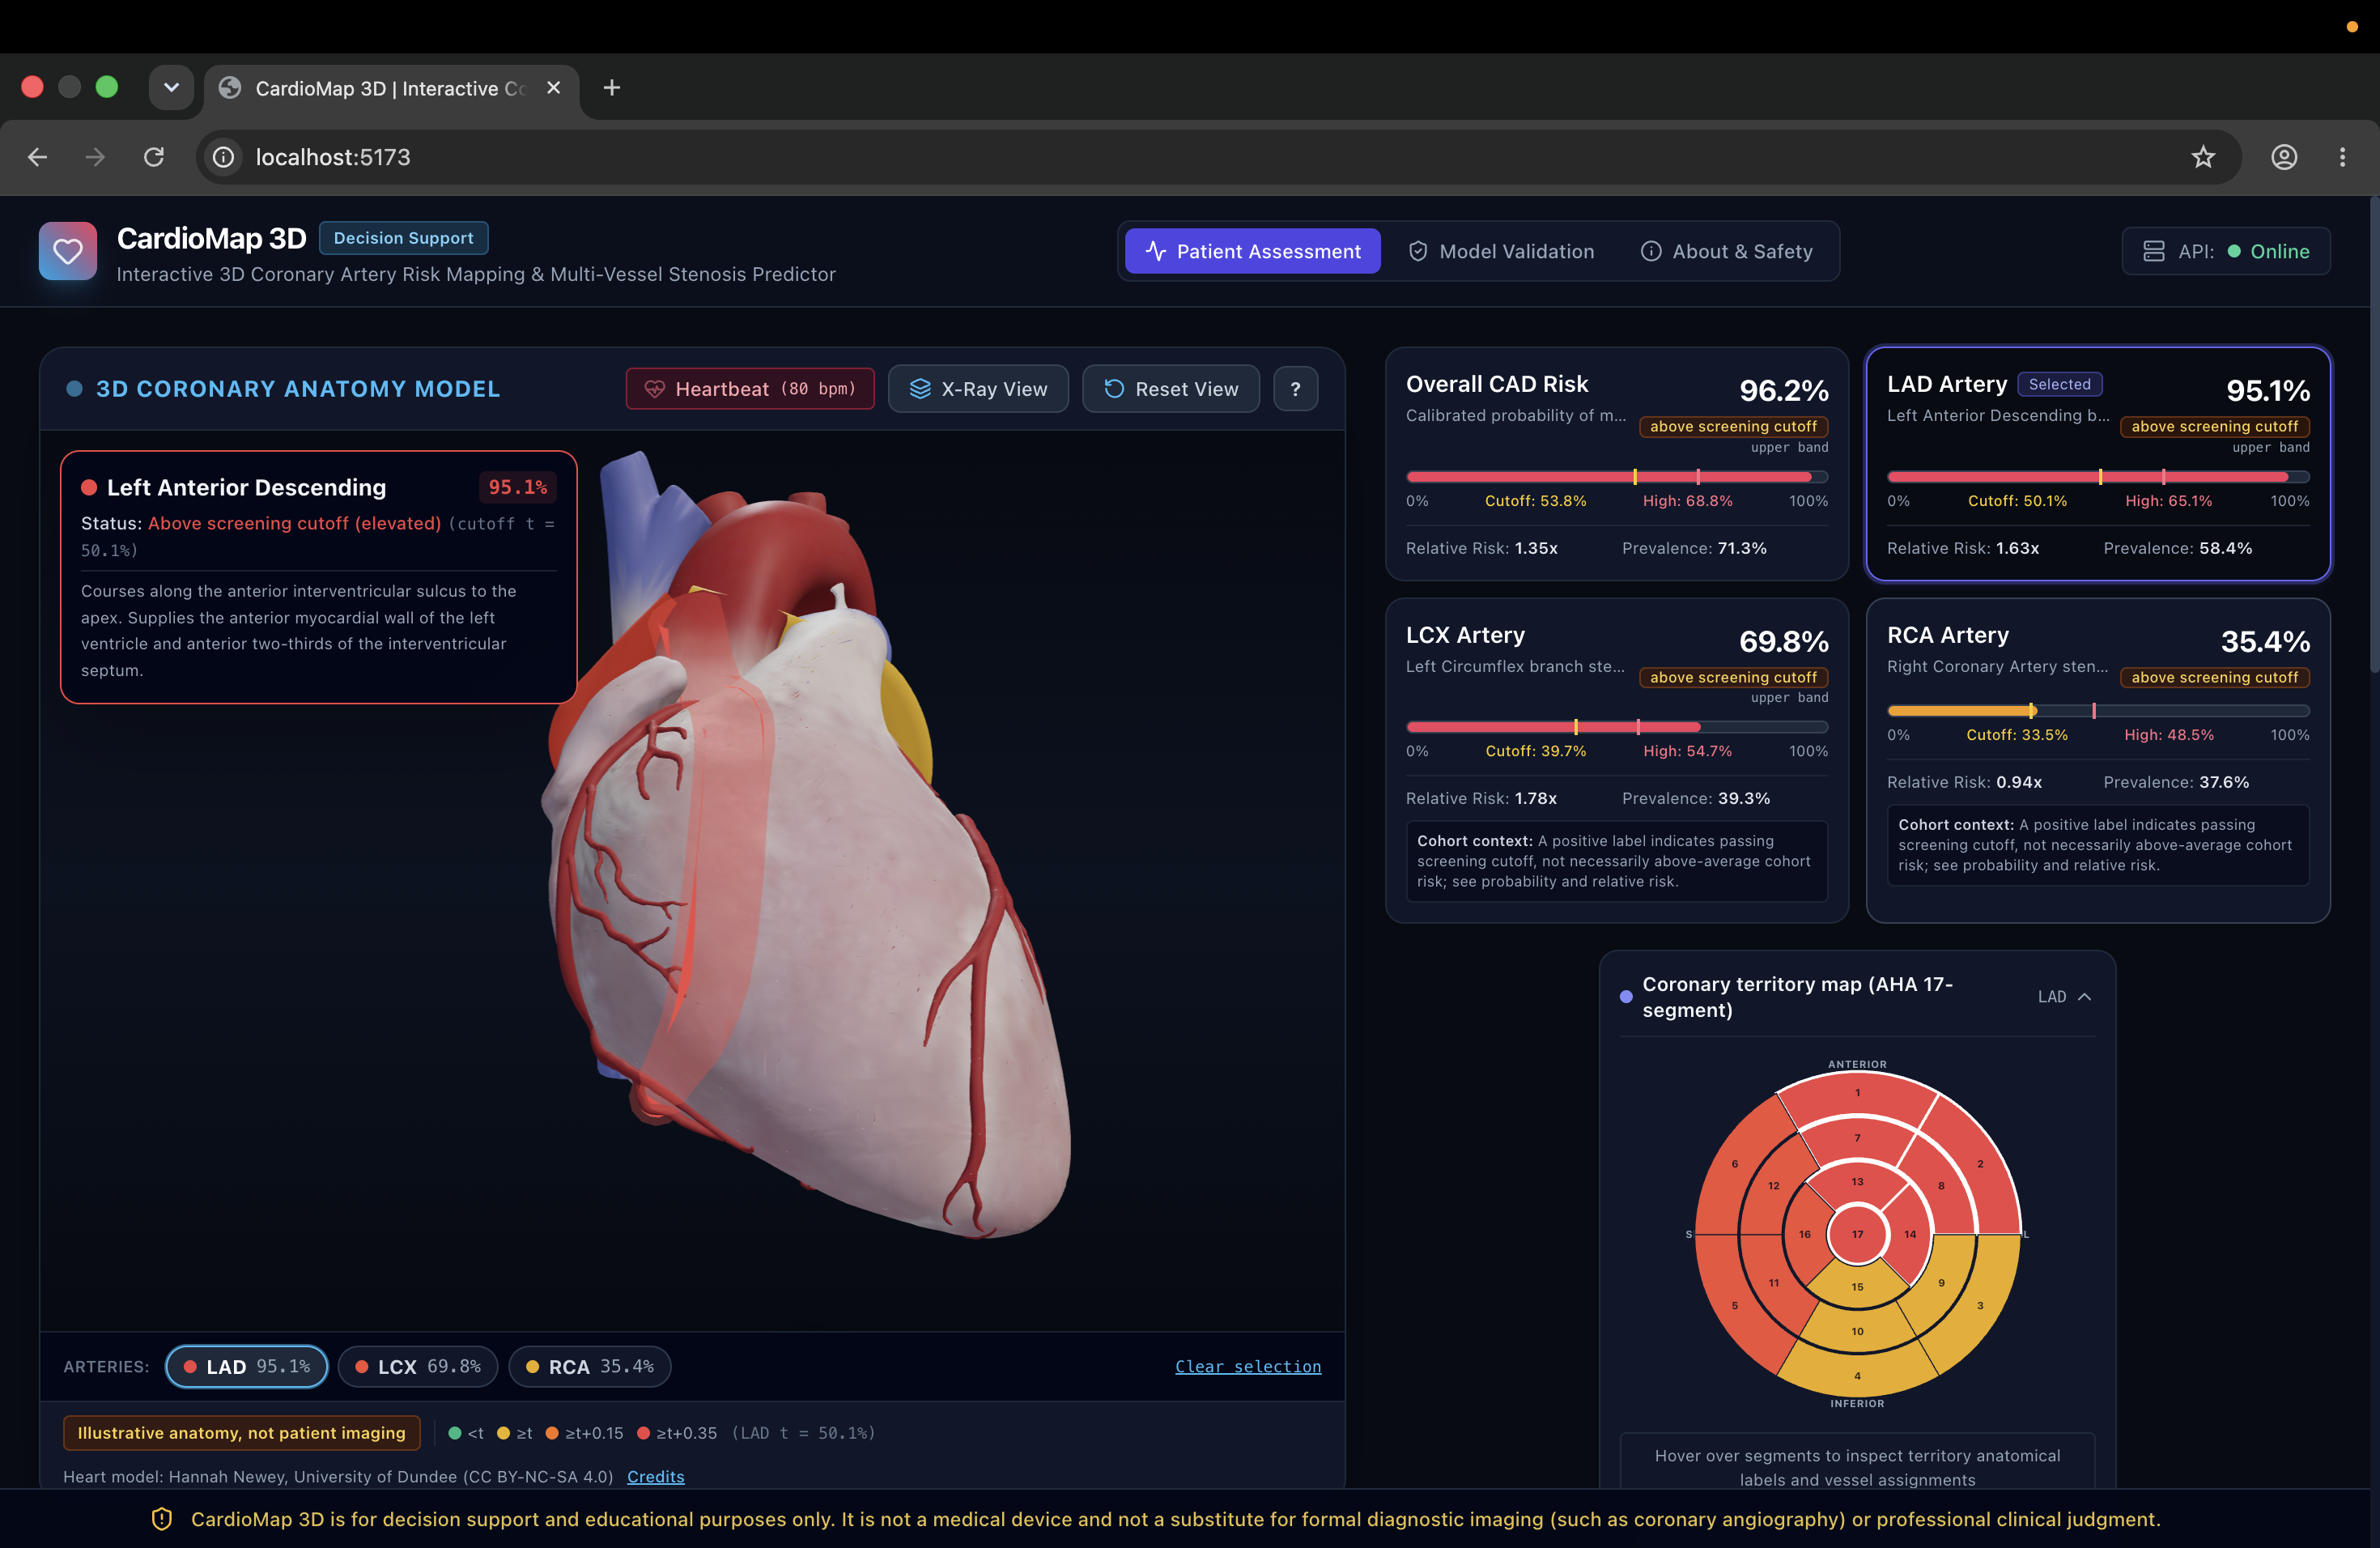
CardioMap 3D is an interactive cardiac risk visualization and decision-support platform that predicts coronary artery disease risk across the three major coronary territories:
- LAD — Left Anterior Descending
- LCX — Left Circumflex
- RCA — Right Coronary Artery
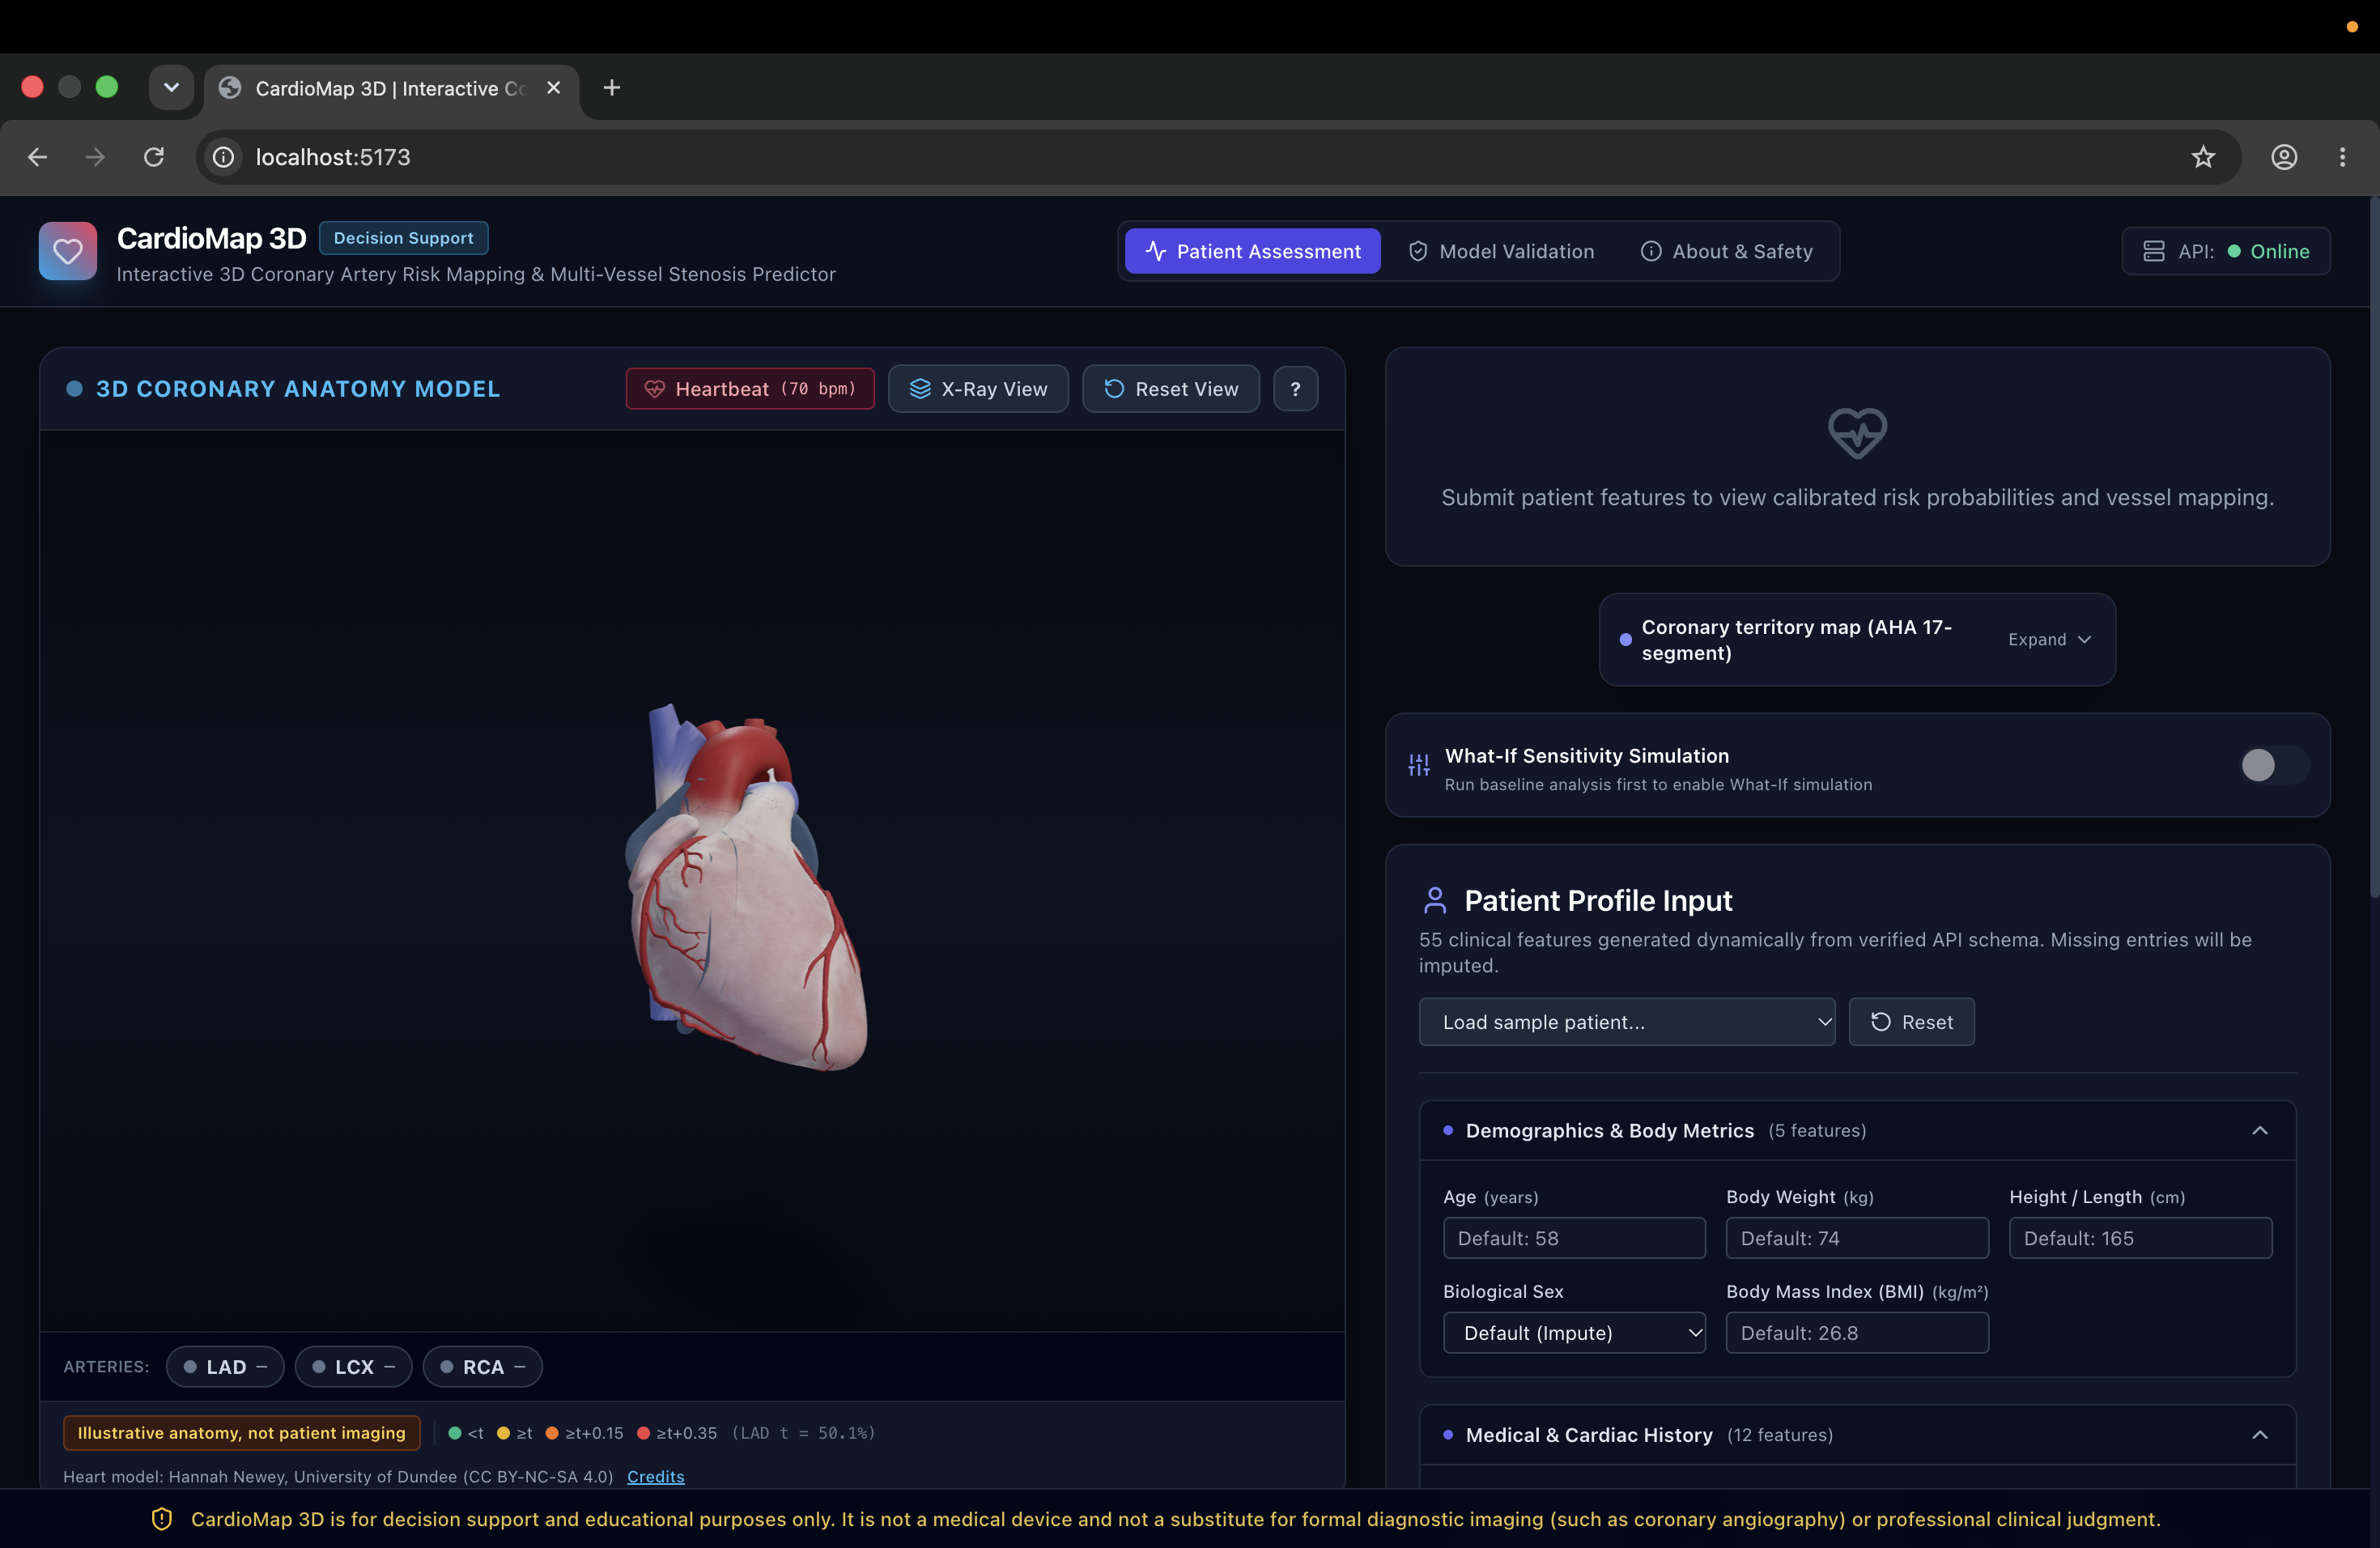
The system accepts 55 clinical features spanning demographics, medical history, vital signs, laboratory markers, ECG information, and echocardiography findings.
Instead of displaying only numerical predictions, CardioMap 3D maps the model outputs directly onto an interactive 3D beating heart.
Each coronary artery is dynamically color-coded according to its predicted risk level, allowing users to visually identify higher-risk vessels.
The platform also includes:
- An X-Ray visualization mode that makes the myocardium semi-transparent to expose the coronary tree.
- Interactive artery selection that focuses the 3D camera on individual coronary vessels.
- An AHA 17-segment myocardial territory map connecting coronary artery risk with potentially affected myocardial regions.
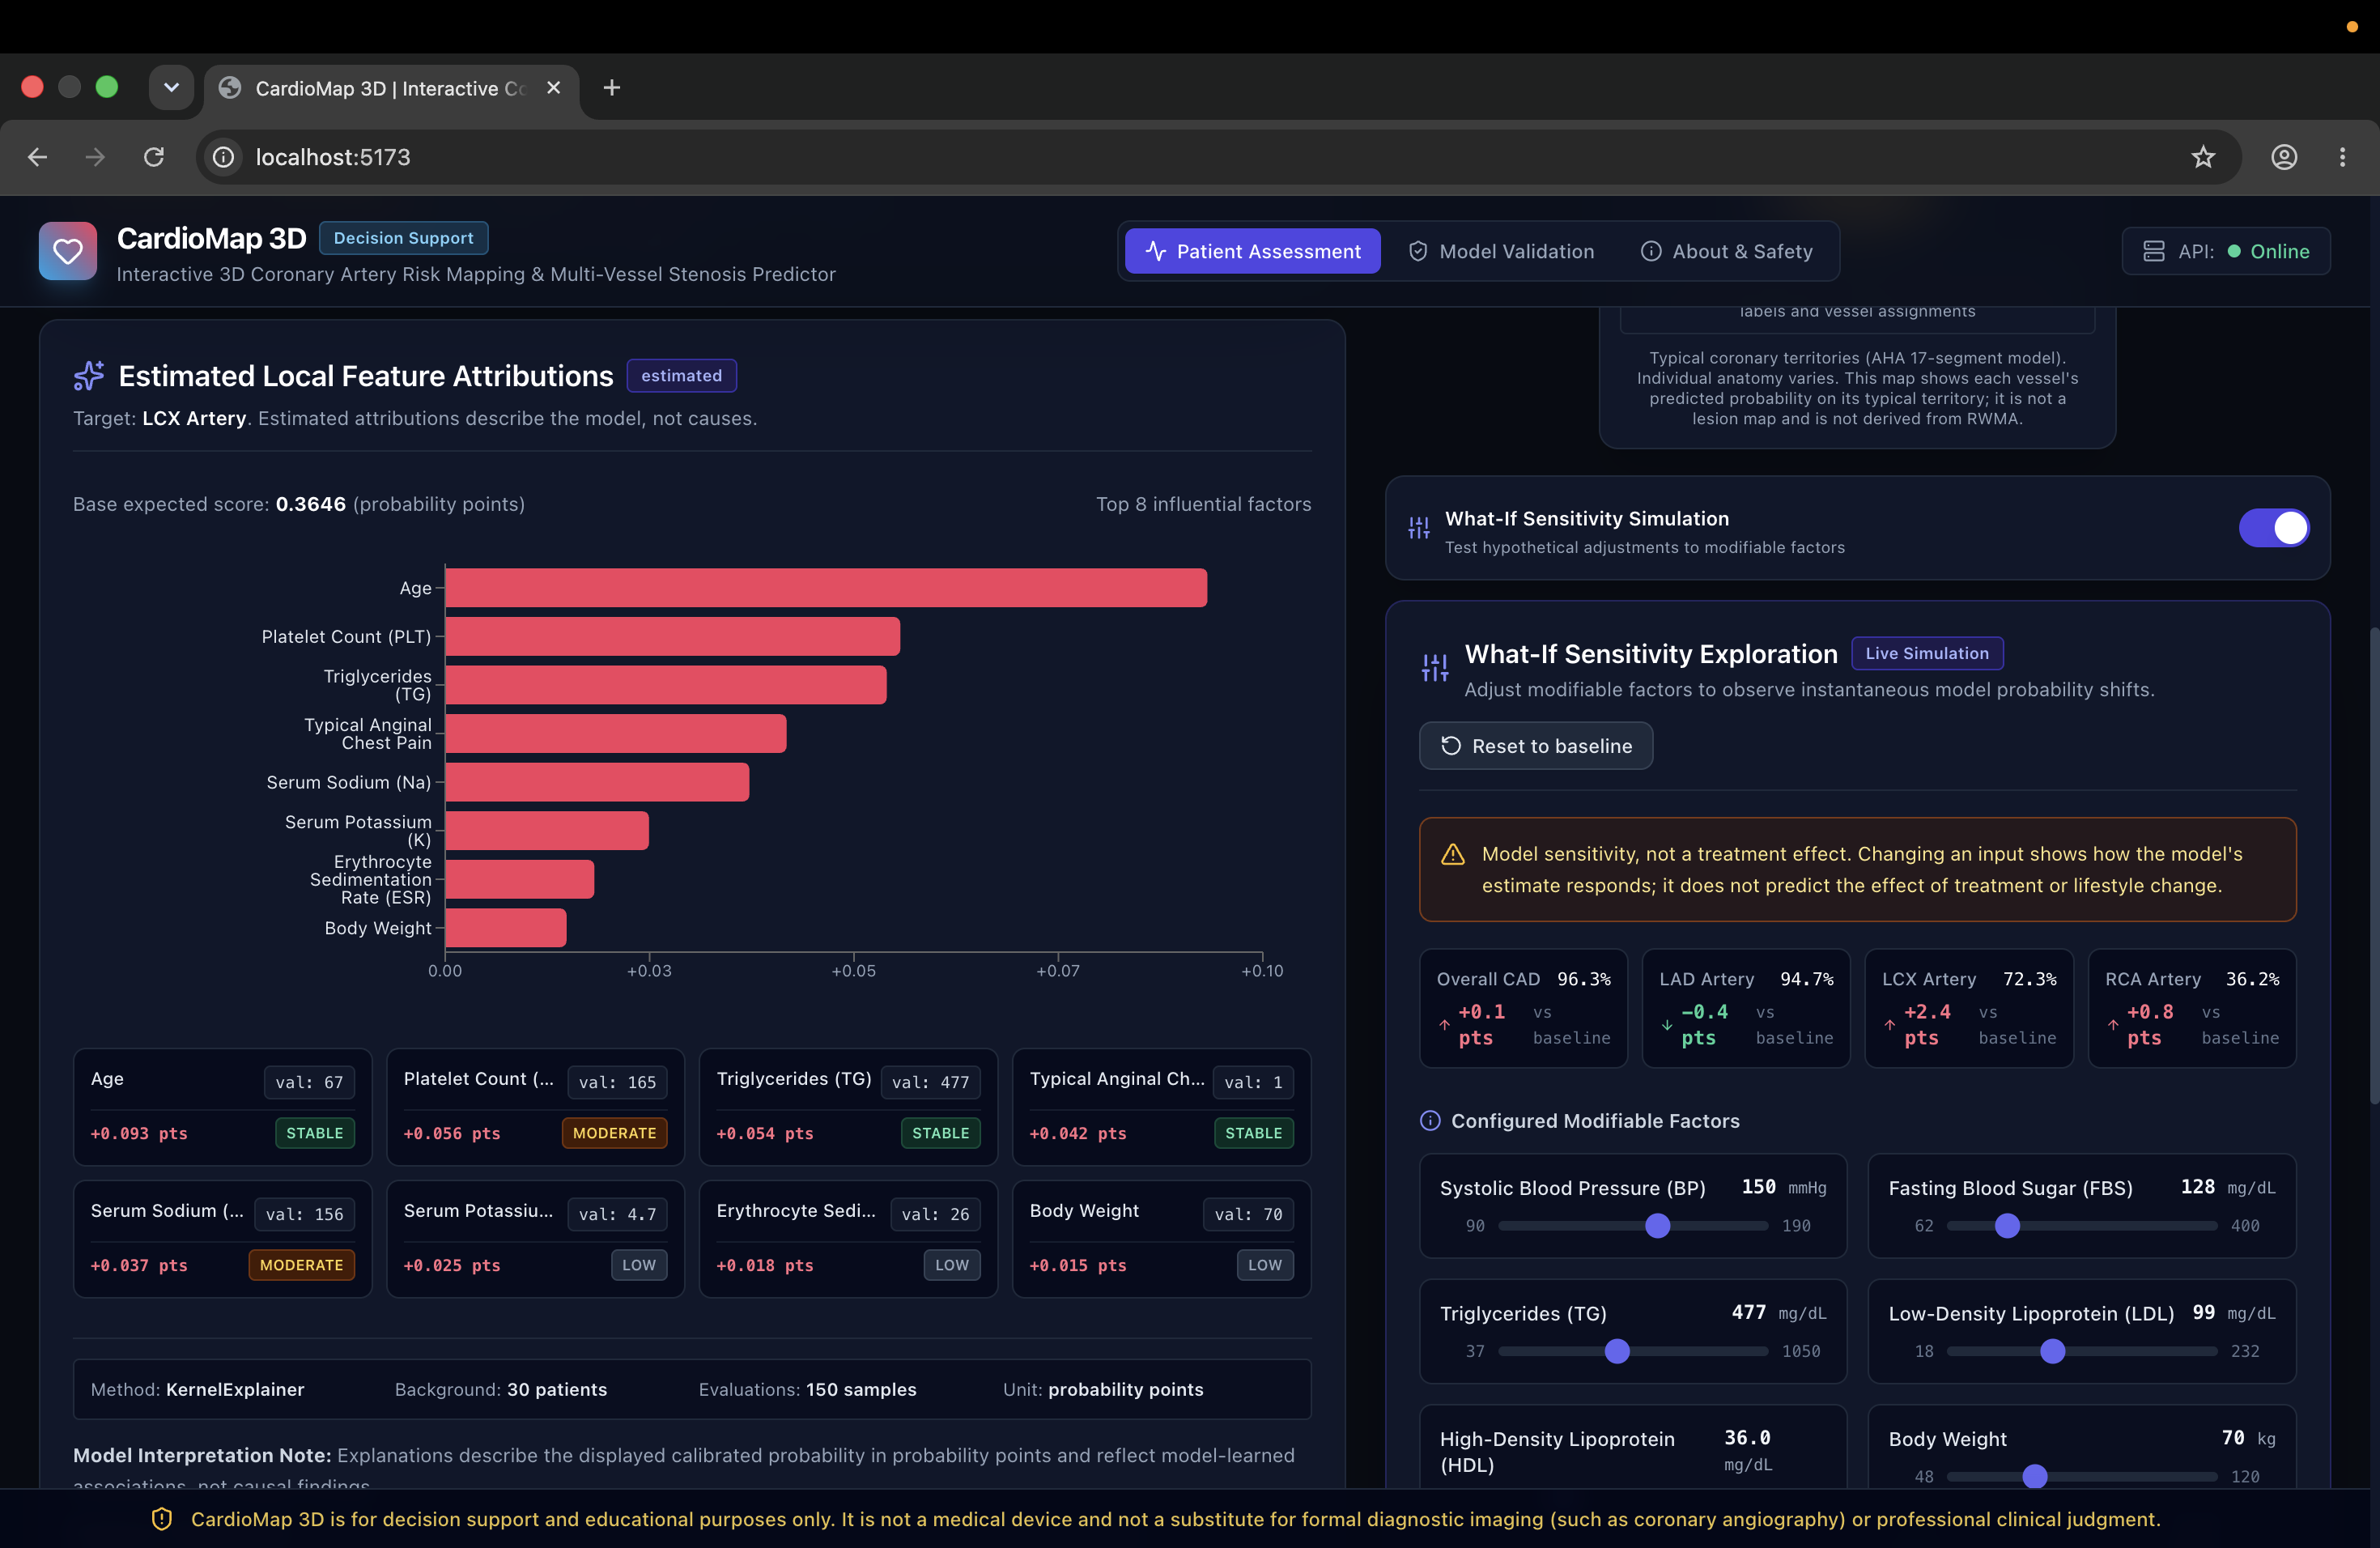
- Patient-specific explainability using SHAP-based feature attribution.
- Bootstrap-based attribution stability indicators.
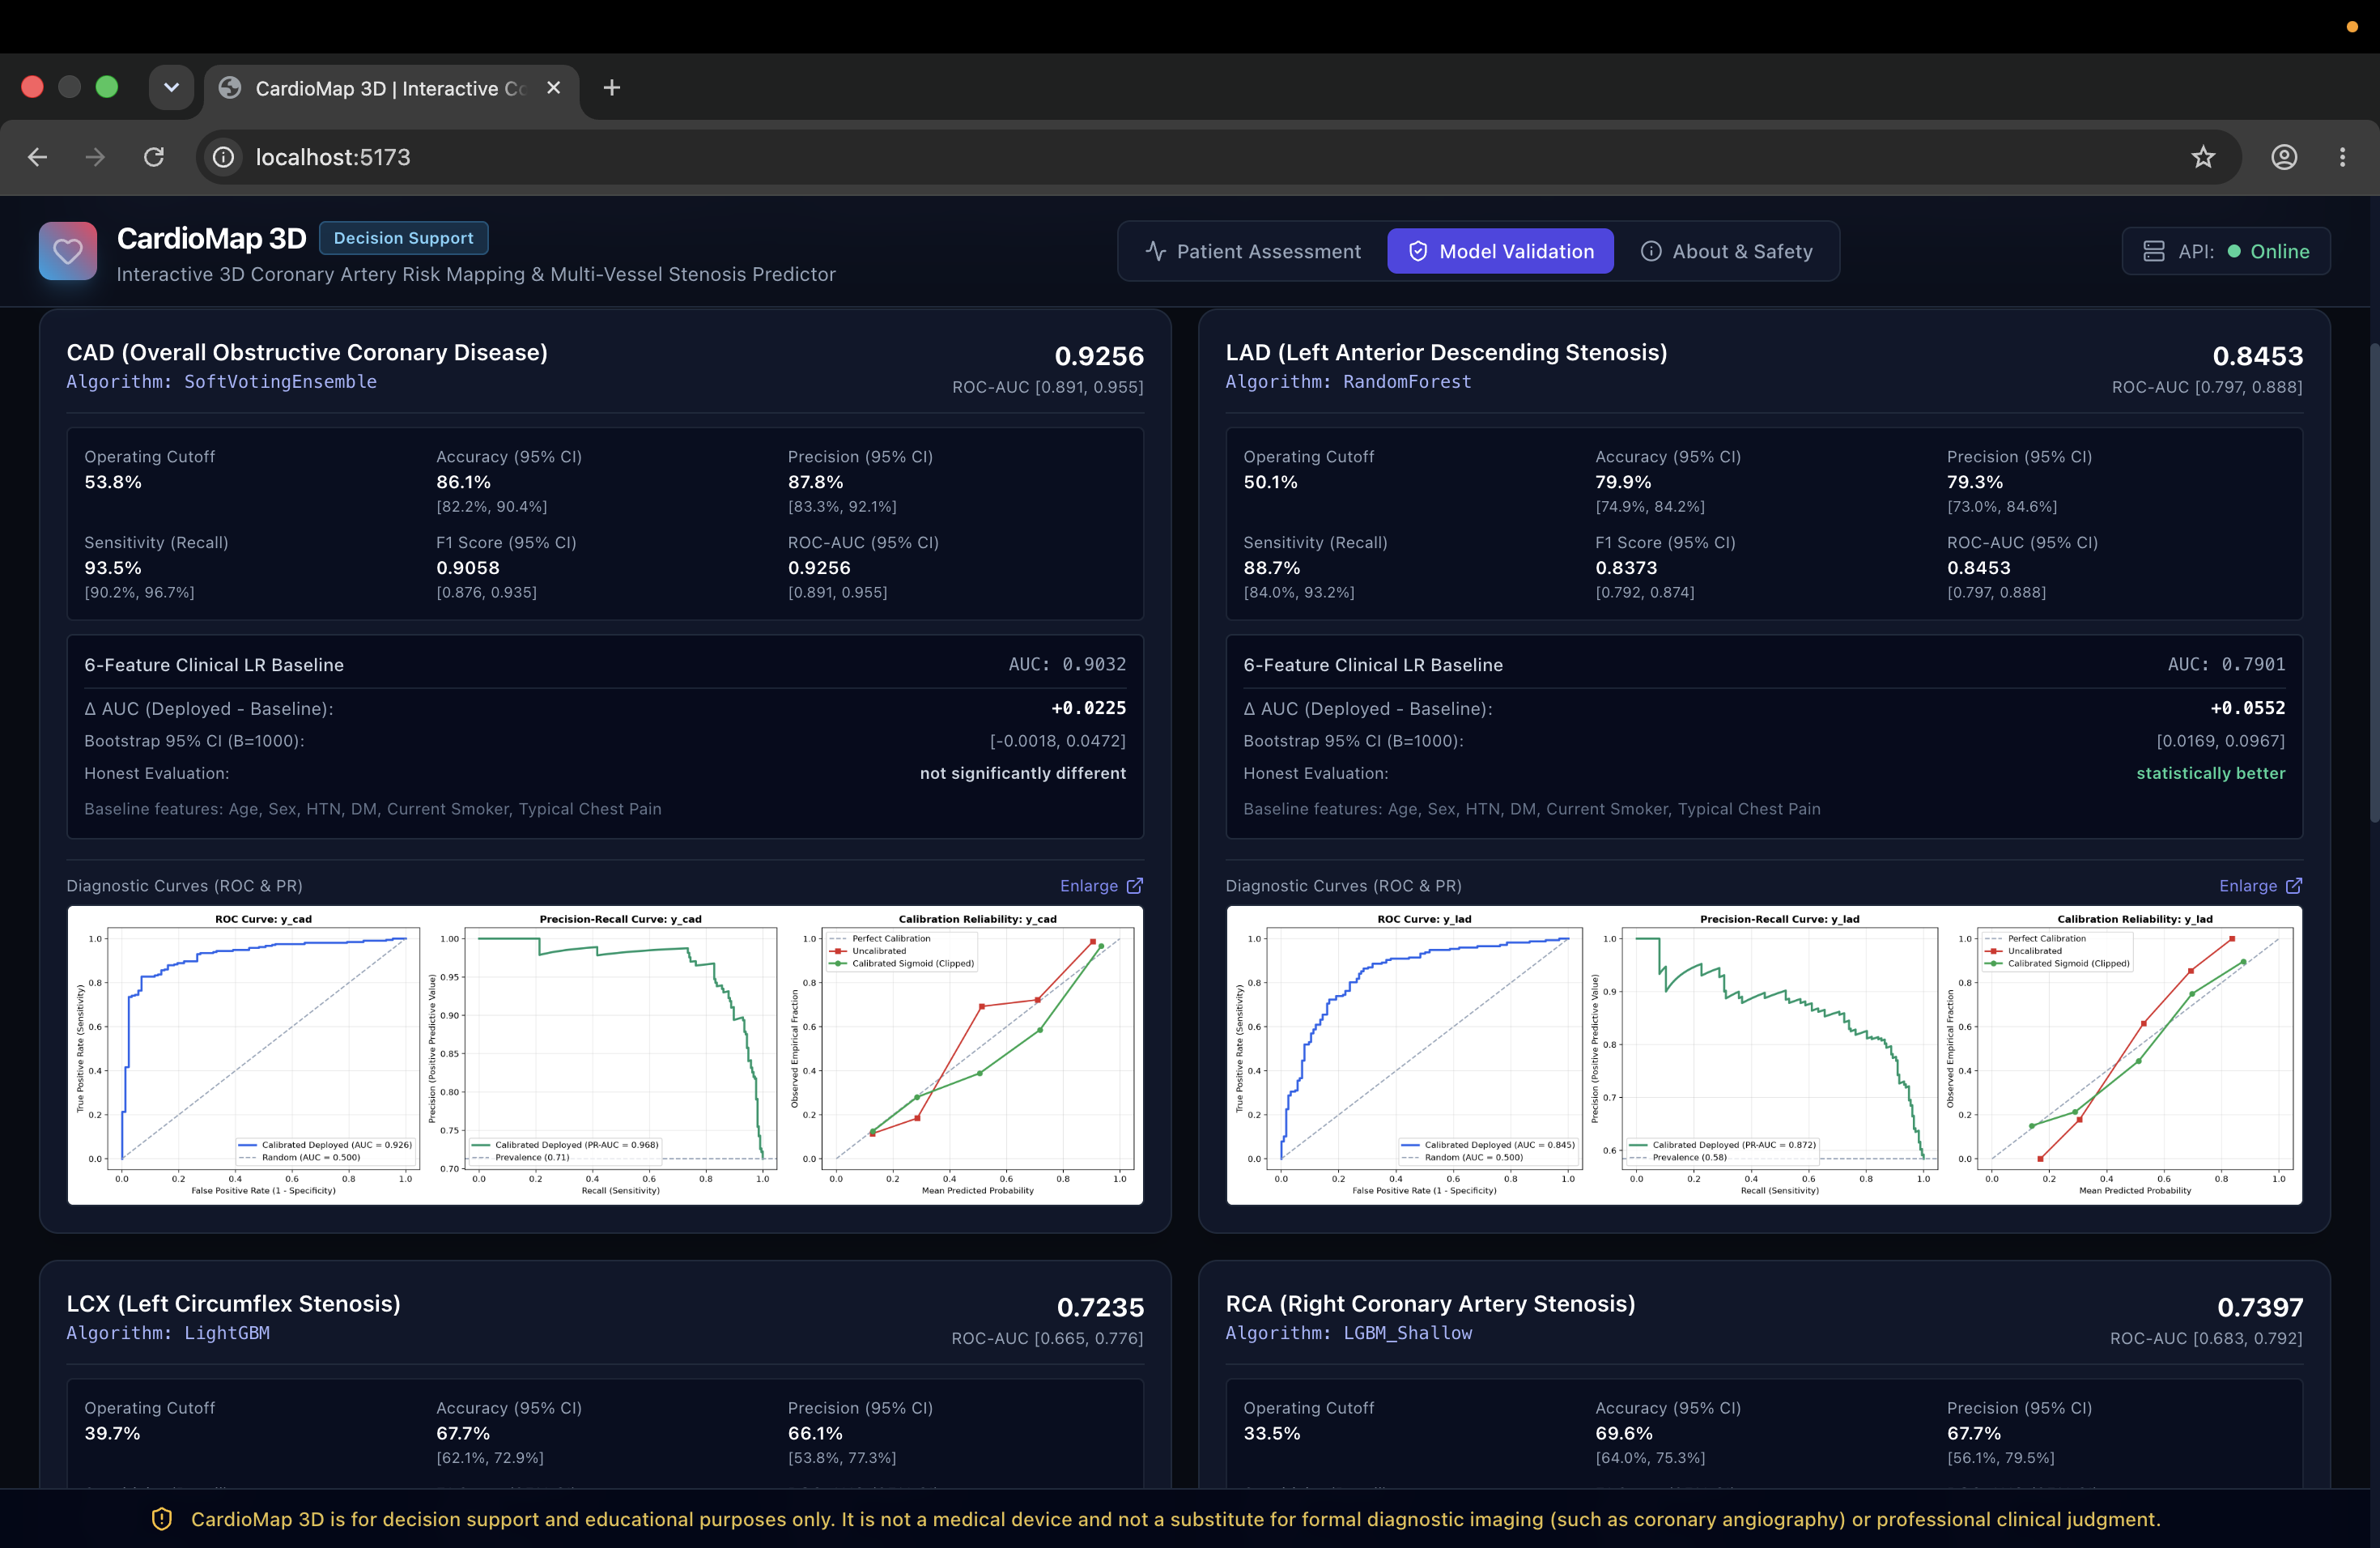
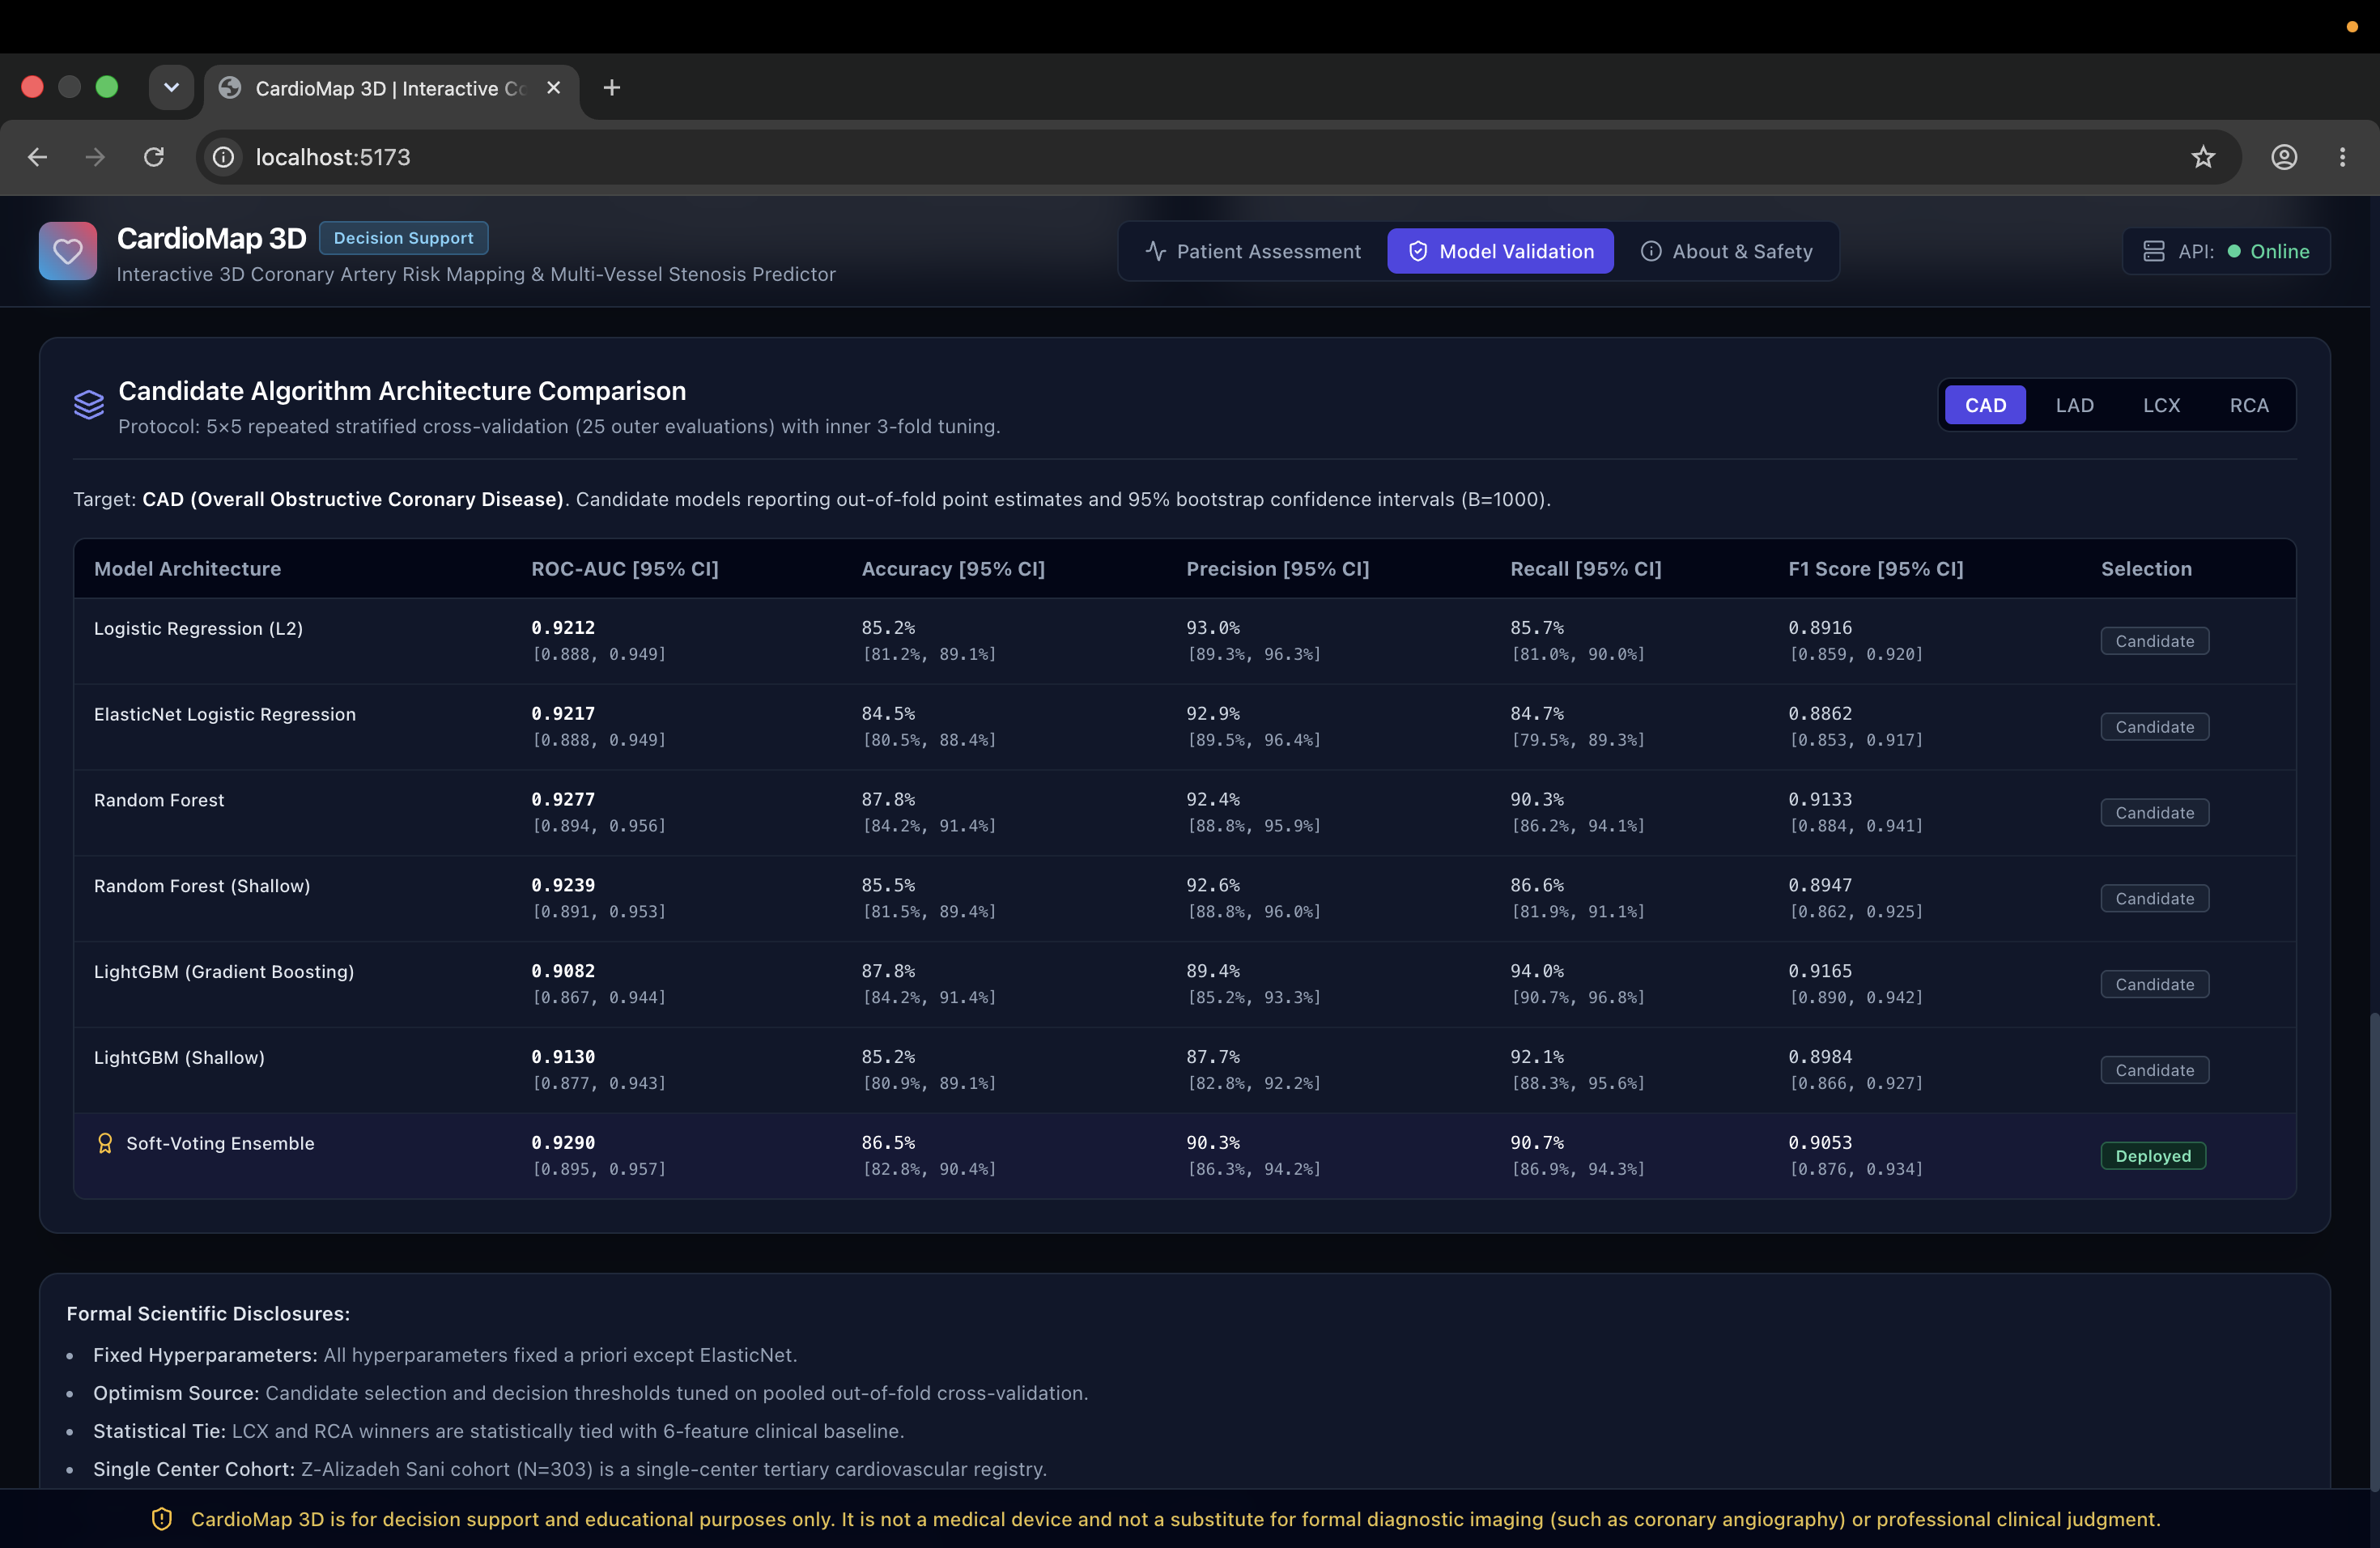
- Model validation metrics including Accuracy, Precision, Recall, F1, ROC-AUC, and confidence intervals.
- A What-If Sensitivity Simulation that allows users to modify factors such as systolic blood pressure, LDL, HDL, triglycerides, weight, fasting blood sugar, and smoking status.
When these variables are changed, CardioMap 3D recomputes the counterfactual prediction and updates the risk probabilities and visualizations, allowing users to explore how changes in modifiable factors may influence the model's predicted risk.
CardioMap 3D is designed as a research and decision-support prototype and is not intended to replace professional medical diagnosis or clinical judgment.
How we built it
CardioMap 3D was built as a combination of a machine-learning pipeline, prediction backend, interactive web application, explainability layer, and custom 3D geometry system.
Machine Learning
We developed and evaluated multiple classification approaches, including:
- Logistic Regression
- Random Forest
- Gradient-boosted models such as LightGBM/XGBoost
- Calibrated ensemble approaches
Models were evaluated using stratified validation procedures and metrics including Accuracy, Precision, Recall, F1, and ROC-AUC.
Because probability quality matters when predictions are represented as clinical risk, we also focused on probability calibration rather than classification accuracy alone.
We implemented safeguards against target leakage, including automated tests that prevent target-related identifiers such as LAD, LCX, RCA, and Cath from entering model training features.
Explainable AI
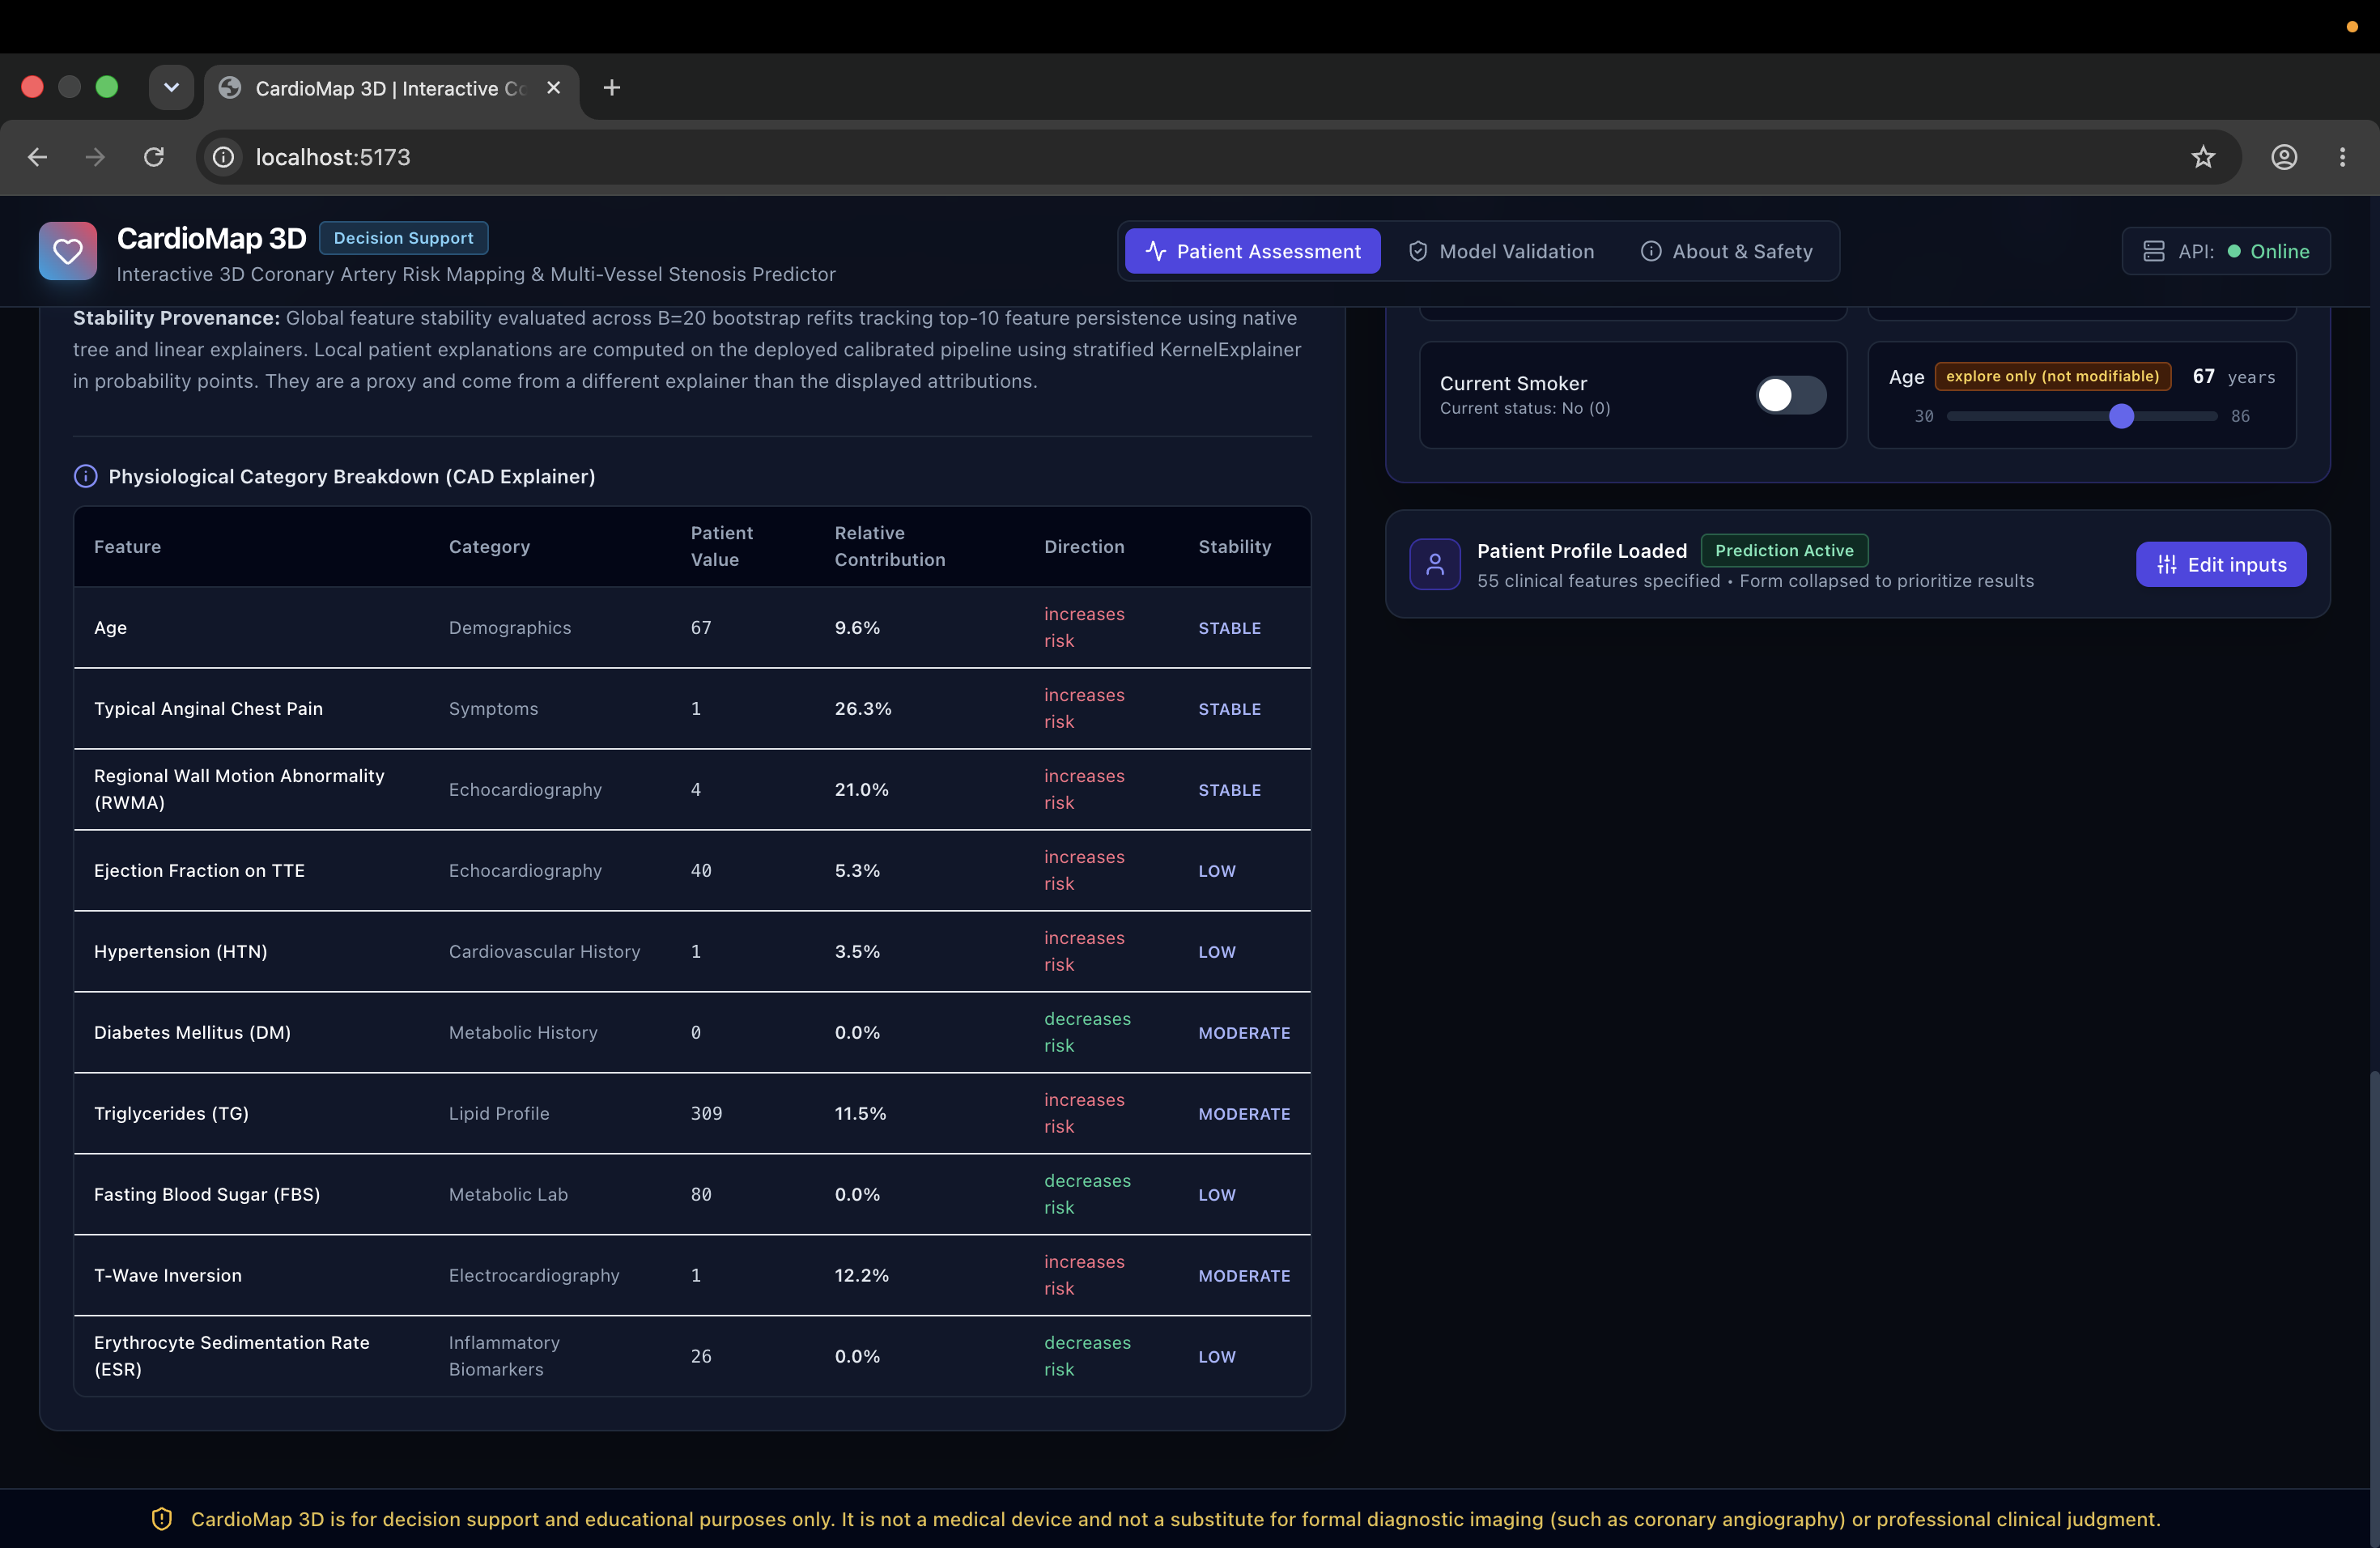
For every prediction, CardioMap 3D provides patient-specific feature attribution using SHAP.
Instead of presenting only global feature importance, the platform shows how individual clinical variables contribute to the current patient's prediction.
We also introduced bootstrap stability analysis to help communicate whether individual feature attributions remain consistent across repeated model refits.
Clinical variables are further grouped into understandable physiological categories such as lipid profile, demographics, vital signs, and echocardiography.
Interactive 3D Heart
One of the most technically interesting parts of CardioMap 3D was mapping model predictions onto anatomical geometry.
Our heart model contains approximately 178,000 vertices.
We constructed a Compressed Sparse Row (CSR) adjacency graph over the surface geometry and implemented Dijkstra shortest-path tracing with a custom edge-cost function:
$$ C(u,v) = L(u,v)\left(1 + k\Delta E(u,v)\right) $$
where:
- $L(u,v)$ represents geometric edge length,
- $\Delta E(u,v)$ represents CIELAB color distance,
- and $k$ controls the color-based penalty.
This allows paths to favor anatomically painted coronary grooves while still respecting the geometry of the heart surface.
The resulting paths can then be transformed into smooth coronary trajectories using Catmull-Rom splines.
Counterfactual Simulation
For the What-If system, selected clinical variables can be modified interactively.
Each change creates a counterfactual patient profile, which is sent back through the prediction pipeline. The updated probabilities are then reflected across the interface, including the coronary artery visualization and associated risk information.
This creates a tight interaction loop:
Modify clinical factor → Recalculate prediction → Update anatomical visualization
Challenges we ran into
One of our biggest challenges was connecting machine-learning outputs with meaningful 3D anatomy.
Displaying a risk percentage is relatively straightforward. Correctly representing that information on complex heart geometry while maintaining interactive performance required significantly more work.
Tracing coronary vessels over a dense 3D surface was particularly challenging. Simple straight lines or manually placed curves did not follow the anatomical surface convincingly. Building a graph representation of the mesh and introducing geometry- and color-aware shortest-path calculations gave us a much more robust solution.
Another major challenge was preventing data leakage. Medical datasets can contain variables whose names or derivations indirectly reveal prediction targets. We therefore built automated leakage checks into the ML pipeline rather than relying only on manual feature inspection.
Explainability created another challenge. A feature attribution is not automatically useful simply because it can be calculated. We worked on making explanations more understandable through probability-point contributions, physiological grouping, and stability analysis.
Finally, integrating the ML pipeline, counterfactual inference, explainability calculations, territory mapping, and real-time 3D rendering into a single responsive experience required careful engineering across multiple parts of the stack.
Accomplishments that we're proud of
We're especially proud that CardioMap 3D became more than a conventional machine-learning dashboard.
We successfully combined:
Clinical data → ML prediction → Explainability → Anatomical localization → Interactive simulation
into one cohesive experience.
Some of the accomplishments we're most proud of include:
- Predicting risk independently across LAD, LCX, and RCA.
- Dynamically mapping those predictions onto an interactive 3D anatomical heart.
- Building a custom graph-based coronary surface-tracing system.
- Connecting coronary predictions to an AHA 17-segment myocardial territory visualization.
- Creating patient-specific SHAP explanations with attribution stability information.
- Implementing automated safeguards against target leakage.
- Building a real-time What-If Sensitivity Simulation for exploring counterfactual patient profiles.
- Creating a reproducible ML workflow with validation, testing, artifacts, and documentation.
Most importantly, we are proud of turning abstract model outputs into something that can be seen, explored, and questioned interactively.
What we learned
Building CardioMap 3D reinforced that developing healthcare AI involves much more than training the model with the highest metric.
We learned the importance of calibration, reproducibility, leakage prevention, uncertainty, explainability, and careful communication of model outputs.
We also learned how challenging it is to bridge two very different technical domains: machine learning and real-time 3D computer graphics.
Working with dense surface meshes taught us about graph representations, shortest-path algorithms, geometric interpolation, and performance optimization.
The counterfactual simulation also taught us an important lesson about explainable AI: users often want more than an explanation of why a model produced a prediction. They also want to explore how the prediction might change under different assumptions.
Most importantly, we learned that healthcare AI should not simply produce more numbers. Good interfaces should help people understand what those numbers mean while clearly communicating the limitations of the underlying model.
What's next for CardioMap3D
CardioMap 3D currently demonstrates what is possible when cardiac risk prediction, explainability, and anatomical visualization are brought together. Our next goal is to move toward increasingly patient-specific and clinically integrated workflows.
FHIR / EHR Integration
We would like to integrate SMART on FHIR workflows so that supported clinical variables can be populated directly from Electronic Health Record systems instead of being entered manually.
Patient-Specific DICOM Reconstruction
A major future direction is generating individualized heart geometry from CT or CT angiography DICOM data using automated medical-image segmentation.
Instead of visualizing predictions on a representative anatomical model, this could enable visualization on geometry derived from the patient's own imaging data.
CT-FFR and Hemodynamic Simulation
Another extension is combining statistical risk prediction with computational hemodynamic modeling, including approaches inspired by CT-derived Fractional Flow Reserve.
This could help connect predicted anatomical disease with estimates of its potential functional significance.
Long-Term Vision
Our long-term vision is for CardioMap 3D to evolve into a multimodal cardiovascular intelligence platform where:
Clinical data + Medical imaging + Explainable AI + Patient-specific anatomy
come together in one interactive environment.
CardioMap 3D started with a simple question:
What if cardiac risk wasn't just a number, but something you could actually see and explore?
That's the direction we want to continue building toward.
Built With
- 3d
- algorithm
- api
- ci/cd
- dijkstra
- docker
- fastapi
- github
- healthcare
- learning
- machine
- numpy
- pandas
- pytest
- python
- react
- rest
- scikit-learn
- shap
- three.js
- typescript
- vite
- xgboost

Log in or sign up for Devpost to join the conversation.