-
-
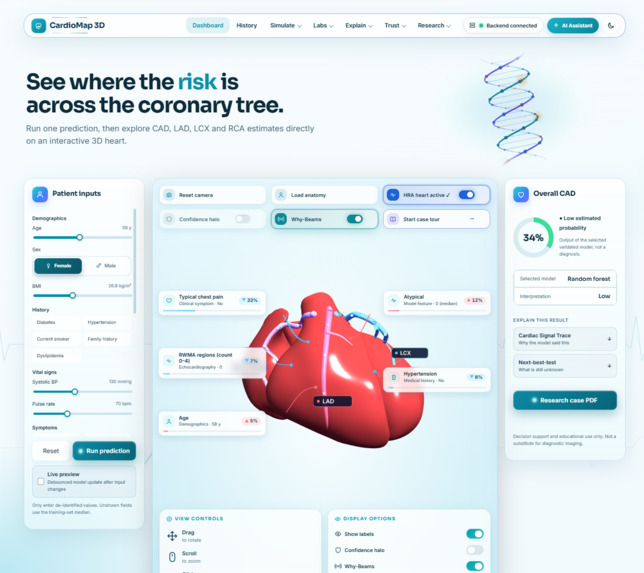
Dashboard
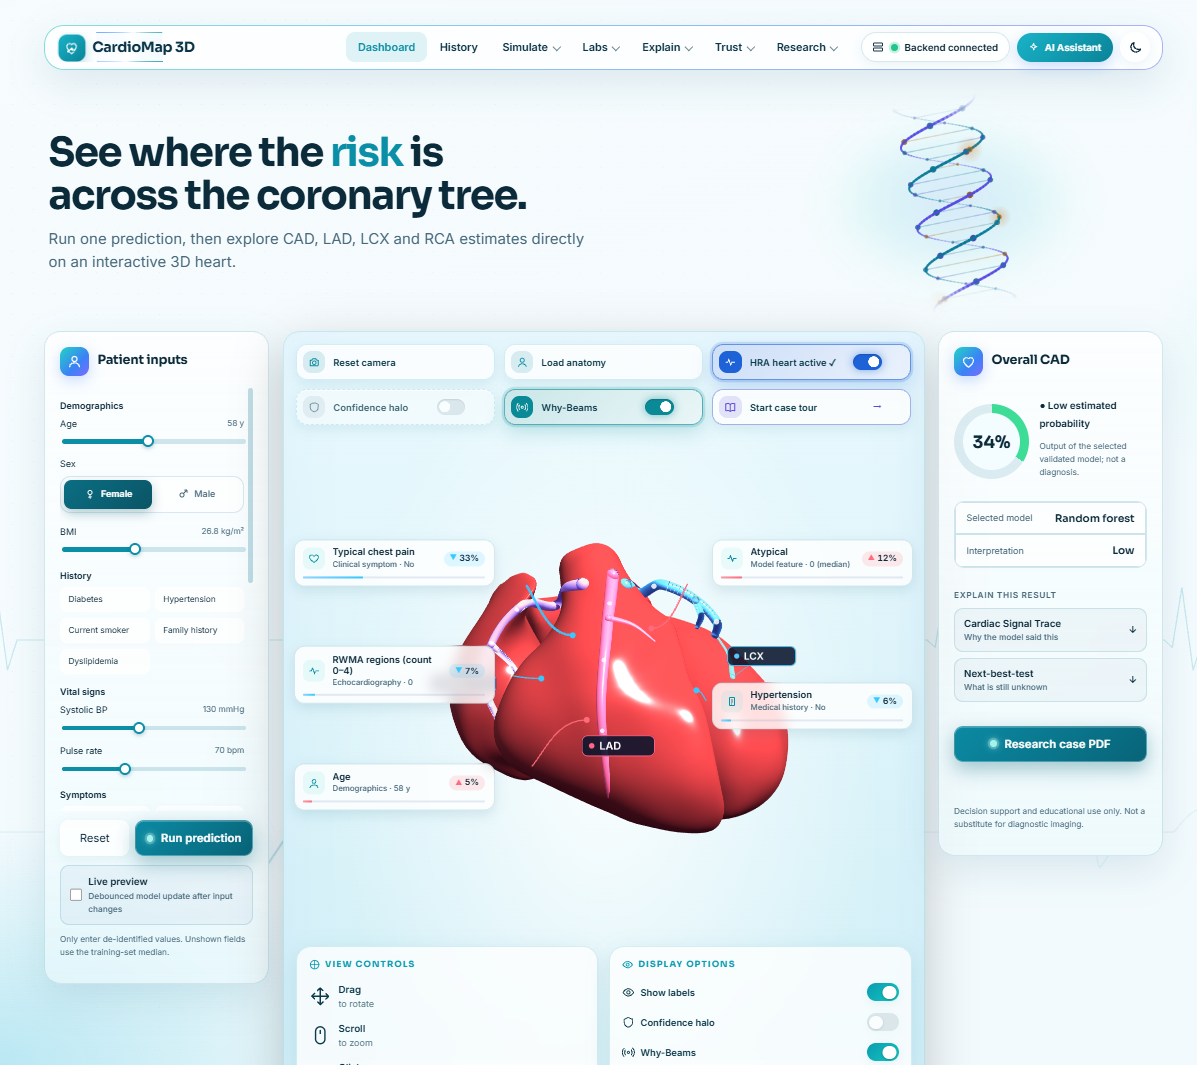
Inspiration
What it does
How we built it
Challenges we ran into
Accomplishments that we're proud of## About the Project
Inspiration
Cardiovascular diseases are a major health concern, and understanding coronary artery disease (CAD) can be difficult when information is presented only through numbers, charts, or complex medical terminology. We wanted to explore how artificial intelligence and interactive visualization could make the process of understanding risk predictions more intuitive and explainable.
This idea inspired CardioMap 3D: an educational and research-oriented platform that brings machine learning predictions, explainable AI, and three-dimensional heart visualization together in one place.
What It Does
CardioMap 3D allows users to explore coronary artery disease risk predictions using patient-related input parameters. The platform combines prediction outputs with visual explanations and a three-dimensional representation of the heart.
Its features include CAD risk prediction, vessel-level information for the LAD, LCX, and RCA where available, SHAP-based feature explanations, interactive 3D visualization, and what-if exploration. It also provides research-oriented tools and AI-assisted features where supported by the application.
The goal is to make model outputs easier to explore and understand, rather than presenting a prediction as an unexplained number.
How We Built It
We built CardioMap 3D as a web-based application with a Python FastAPI backend. The platform combines data-driven prediction workflows with an interactive interface for exploring results, visualizations, and explanations.
We integrated explainability concepts using SHAP-based analysis and developed the project around the idea that predictions should be accompanied by ways to investigate model behavior. Three-dimensional visualization provides an additional visual layer for exploring heart-related information.
We also worked on deploying the application so that users can explore the project online, while keeping the source code available on GitHub.
Challenges We Faced
One of the main challenges was bringing multiple technical components together into a single application. Prediction workflows, visualization, explainability, and supporting AI features each have different requirements, and connecting them into a coherent user experience required careful integration and testing.
Deployment was another challenge. Managing Python dependencies, configuring the runtime environment, and ensuring that the required packages were available on the hosting platform required troubleshooting and adjustments.
We also had to think about how to present complex model outputs clearly without suggesting that an AI prediction is equivalent to a medical diagnosis.
What We Learned
Through this project, we gained practical experience in integrating a Python backend with a web application, working with machine learning workflows, exploring explainable AI, and deploying an application for online access.
We also learned that building an AI-powered project is about more than generating predictions. Usability, interpretability, reliability, and transparent communication of limitations are equally important.
CardioMap 3D helped us understand how different technologies can work together to create a more interactive way to explore complex information.
What's Next
We would like to continue improving the platform's usability, visualization quality, model evaluation workflows, and documentation. We also want to make the relationship between predictions, explanations, and their limitations clearer for users exploring the system.
CardioMap 3D is intended for educational and research purposes only. It is not a medical diagnostic system and does not replace professional medical advice, clinical evaluation, or medical imaging.
What we learned
What's next for Cardiomap 3D
Built With
- 3d-visualization
- ai
- fastapi
- generativeai
- healthcare
- machine-learning
- python
- react
- render
- restapi
- shap
- typescript

Log in or sign up for Devpost to join the conversation.