-
-
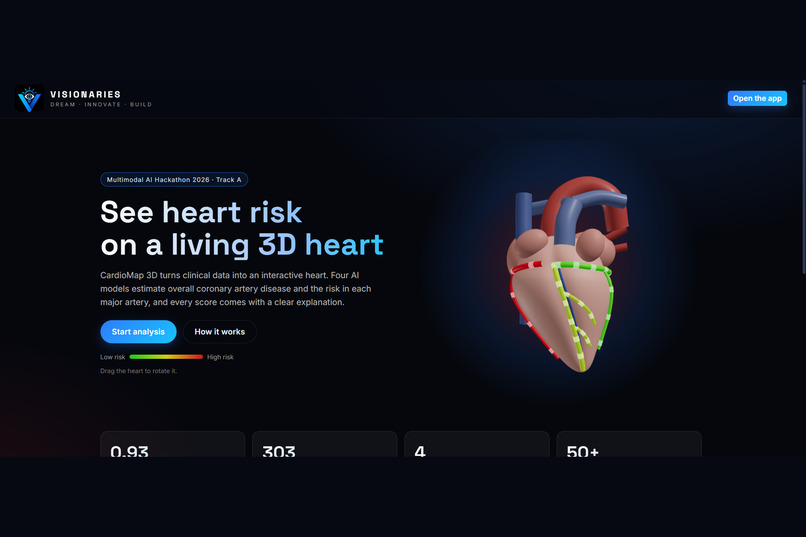
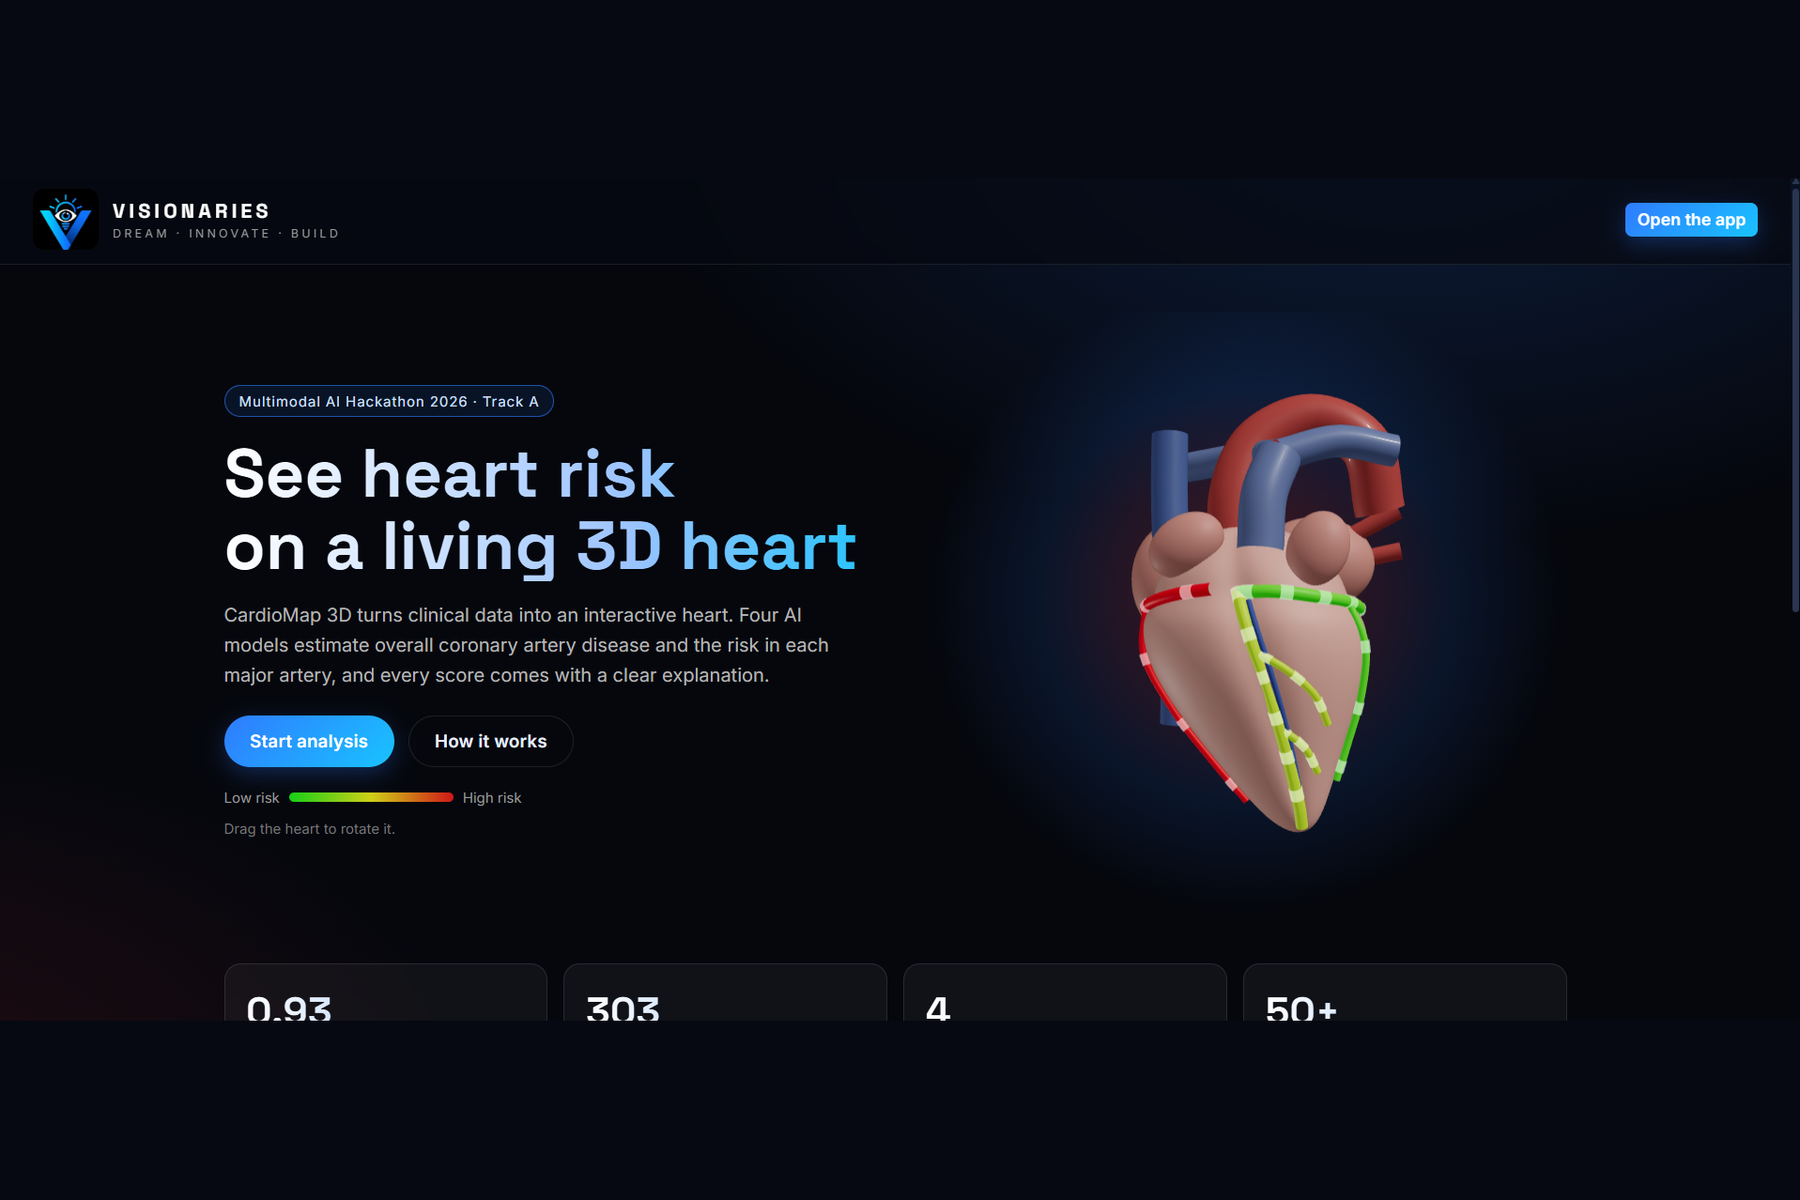
Landing page with a live 3D heart whose arteries change color on their own
-
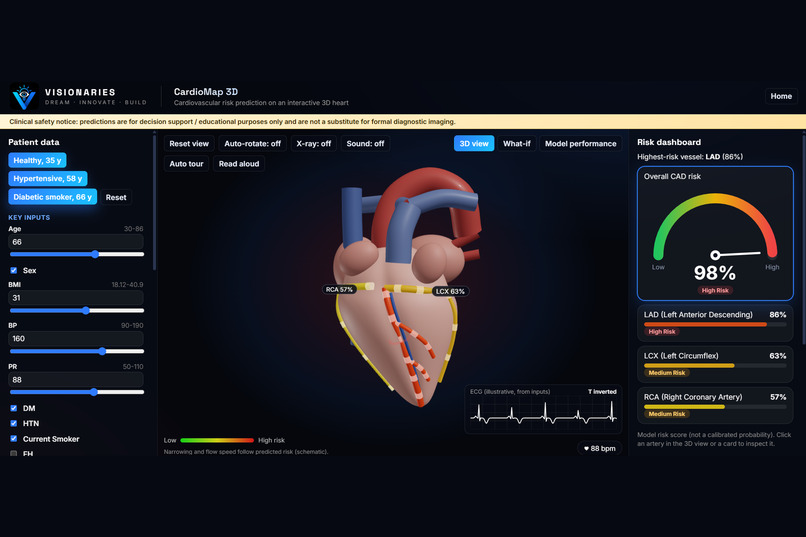
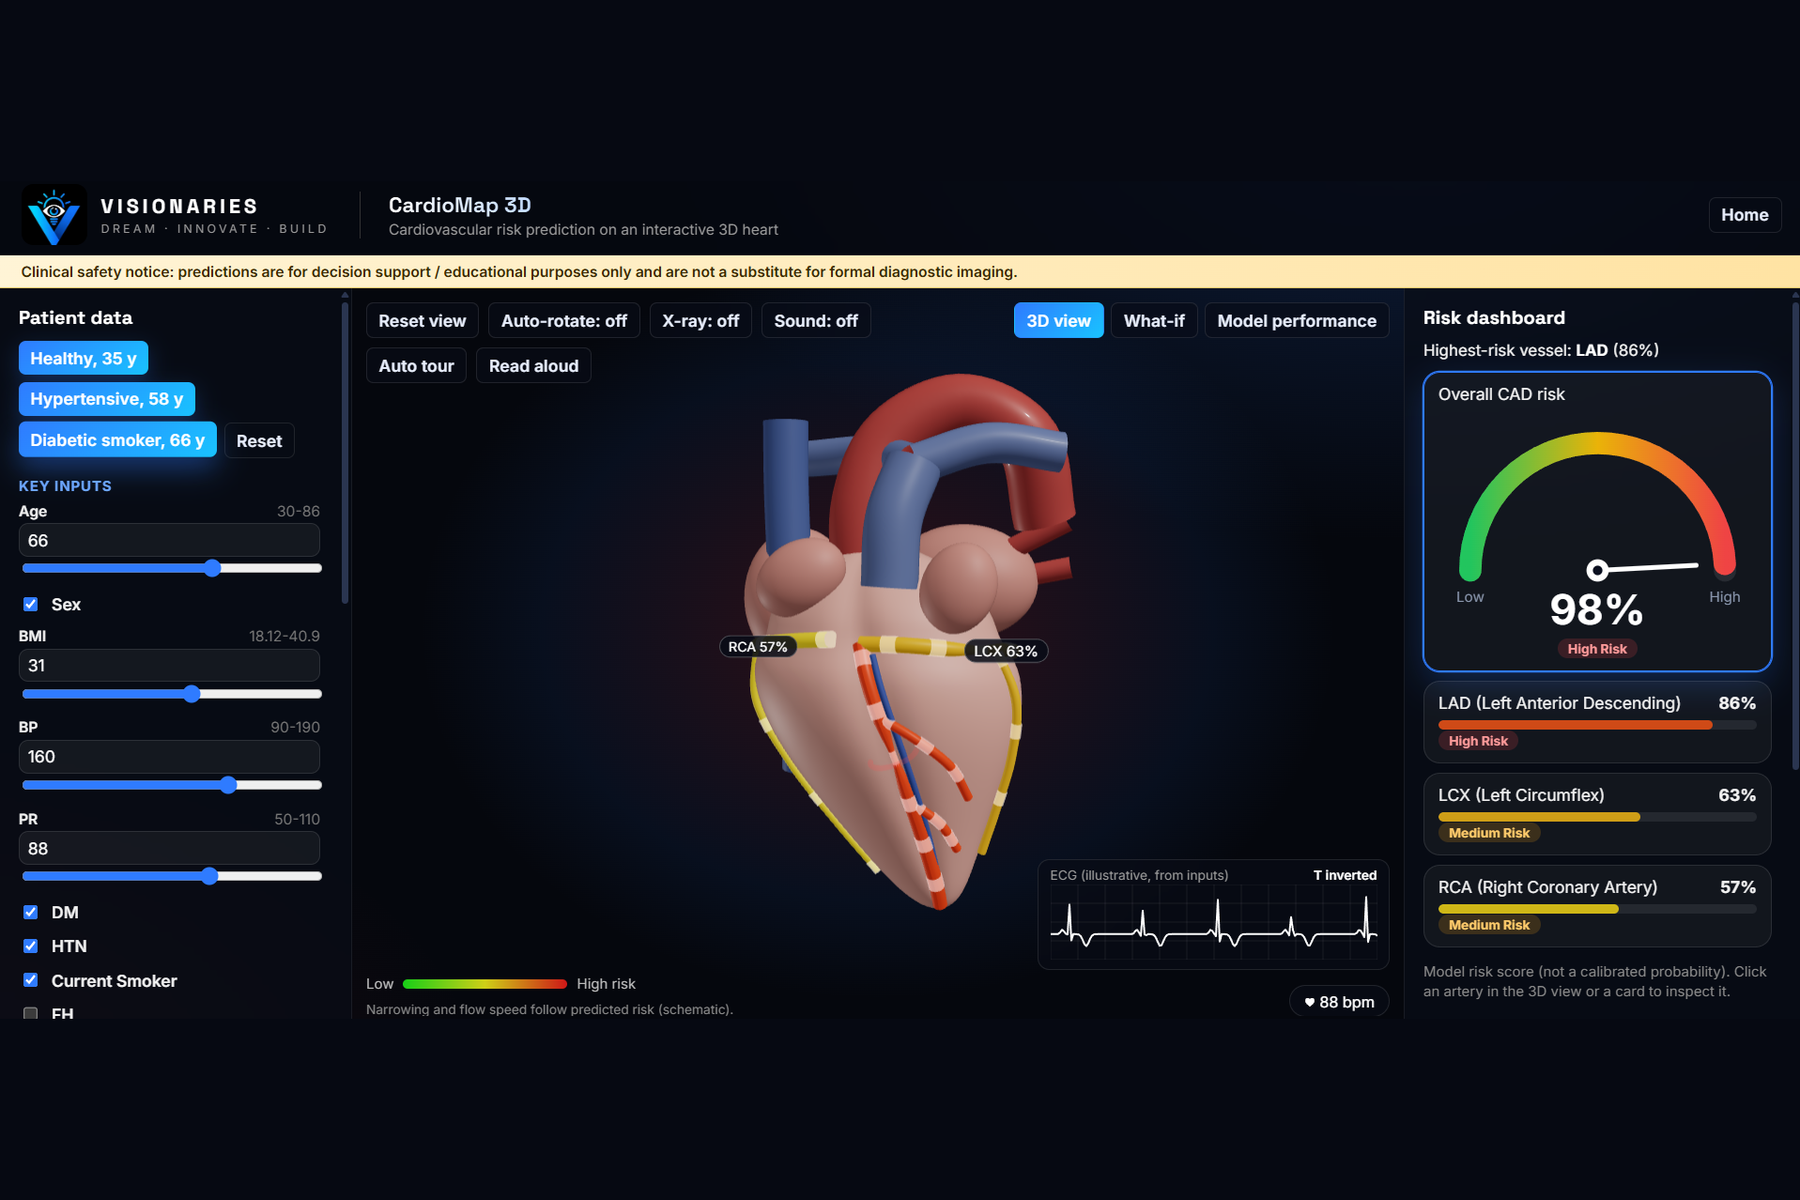
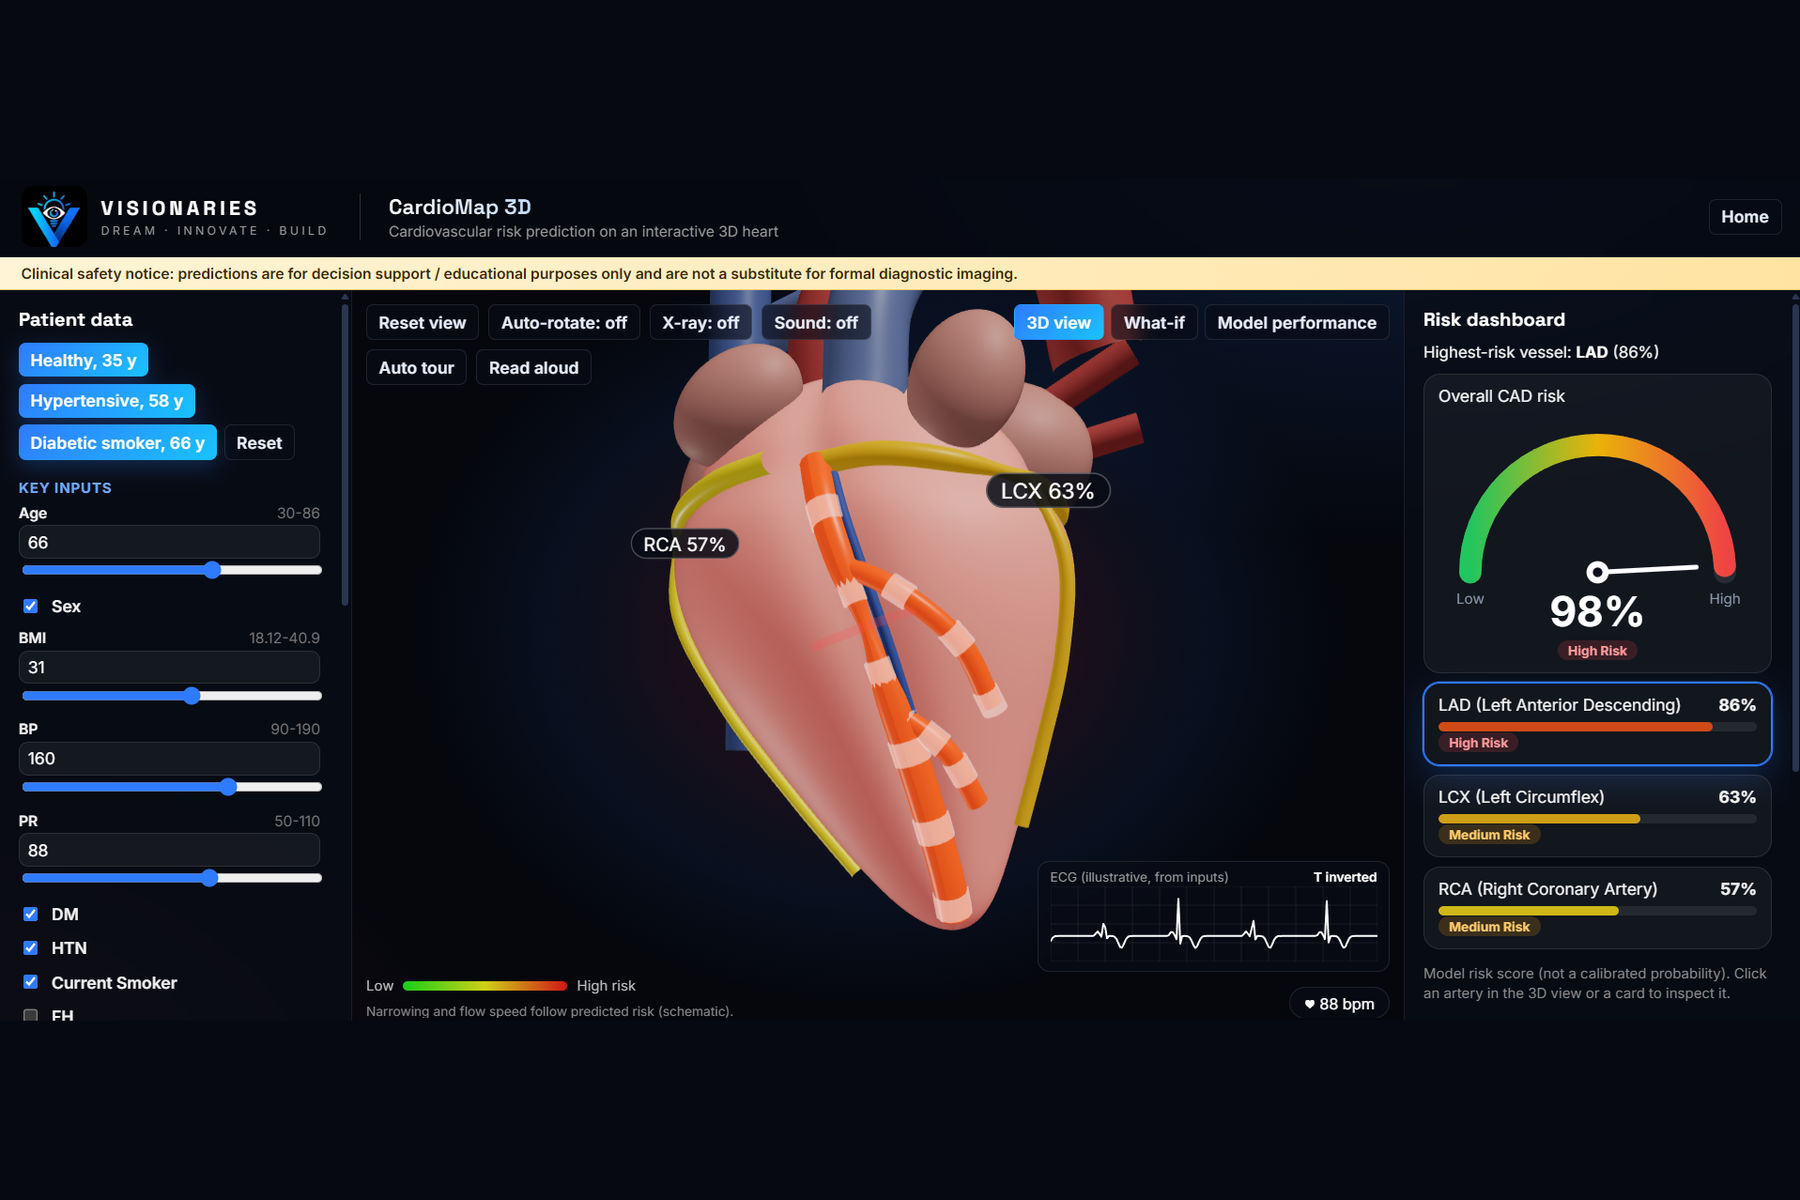
Interactive 3D heart: each artery is colored green to red by its predicted risk
-
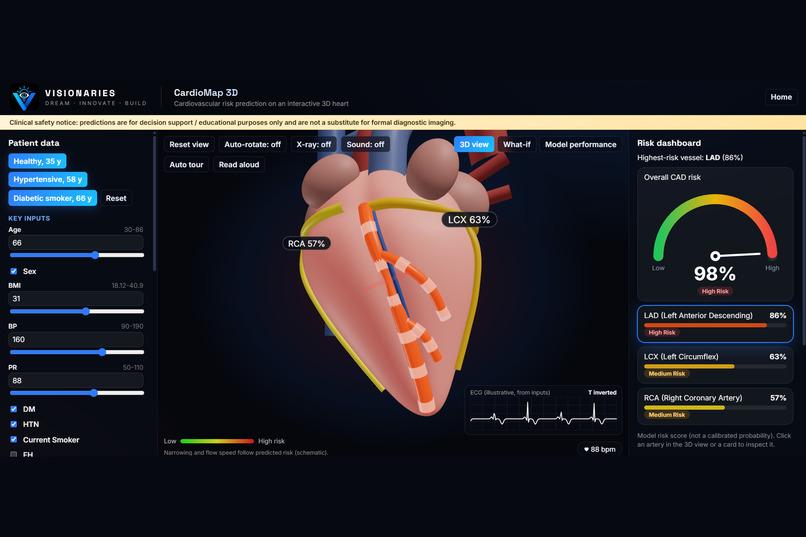
Click an artery and the camera zooms to it, showing that artery's own explanation
-
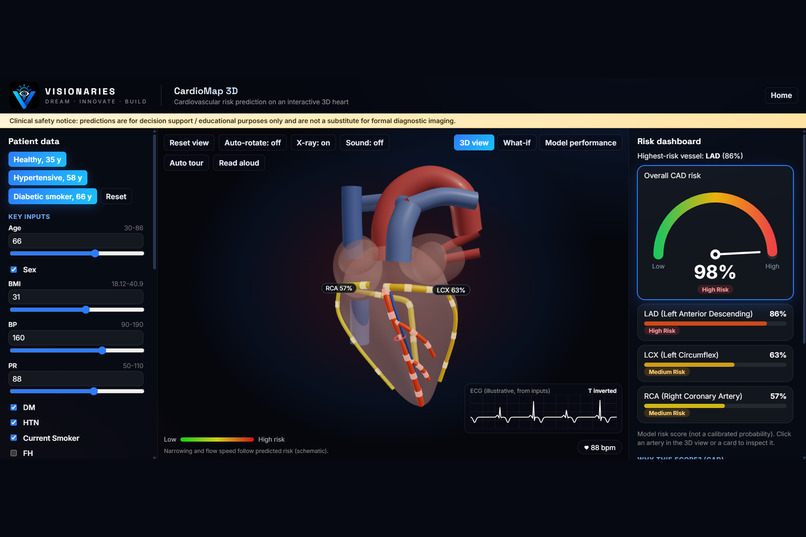
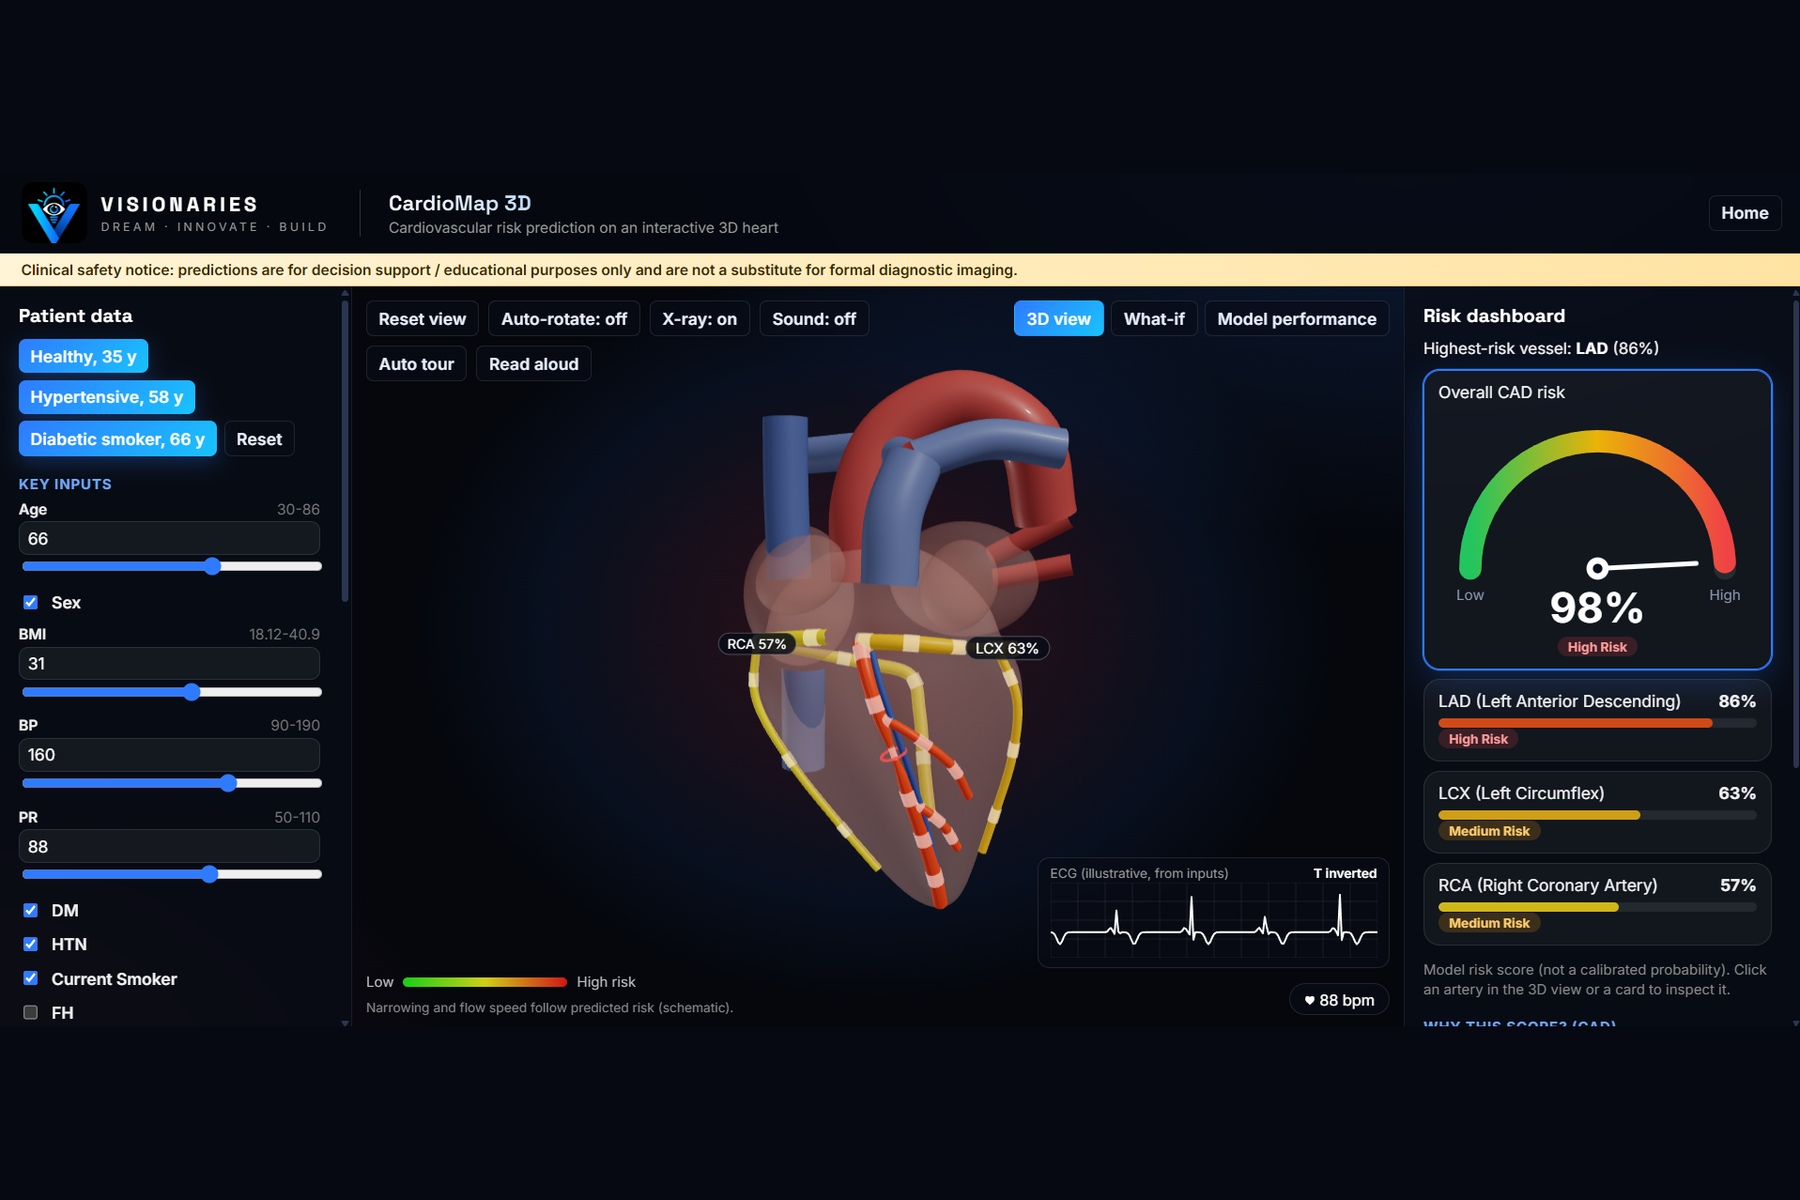
X-ray mode with blood-flow pulses and a narrowing that follows the predicted risk
-
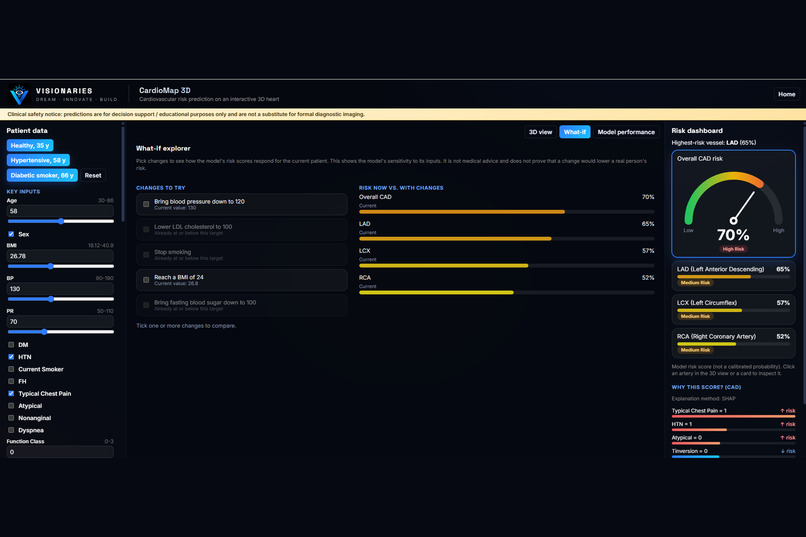
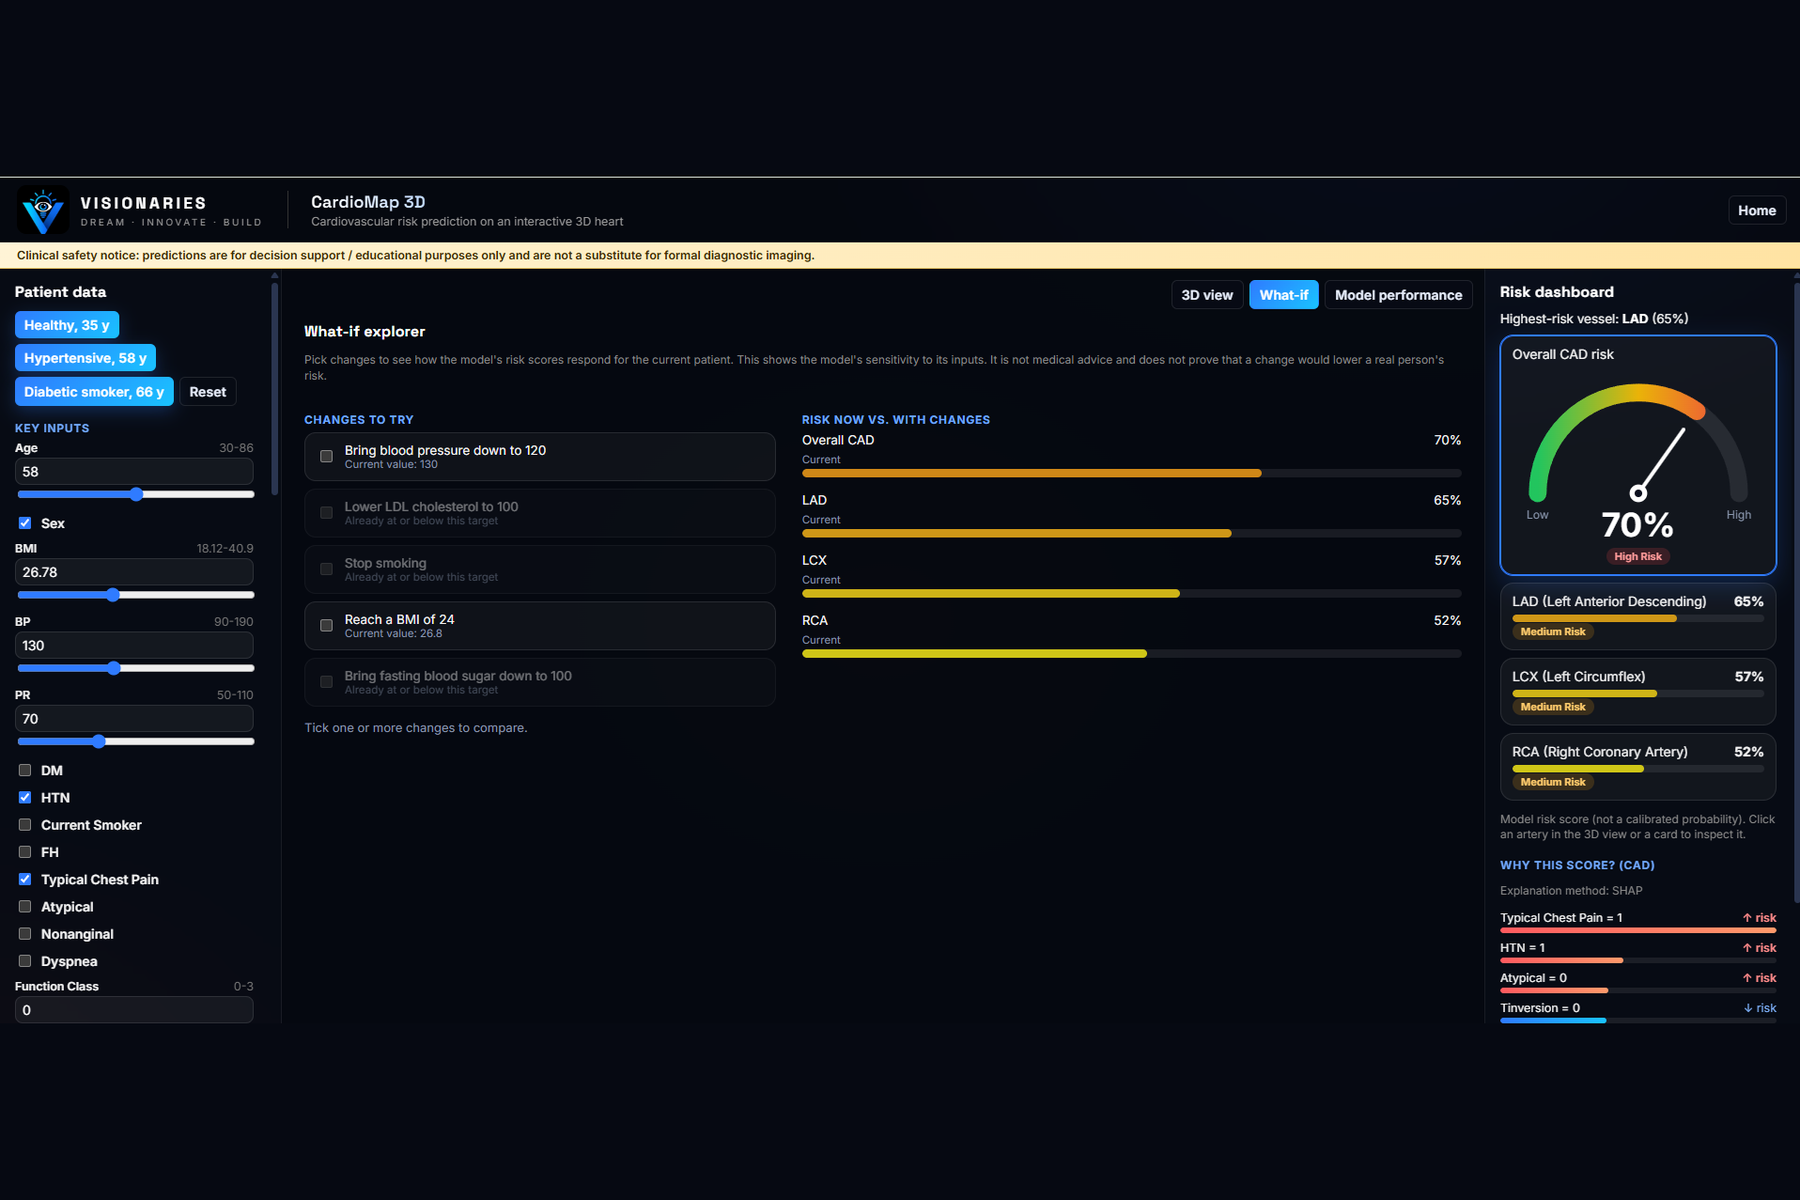
What-if explorer: see how scores respond when BP, LDL, smoking or BMI change
-
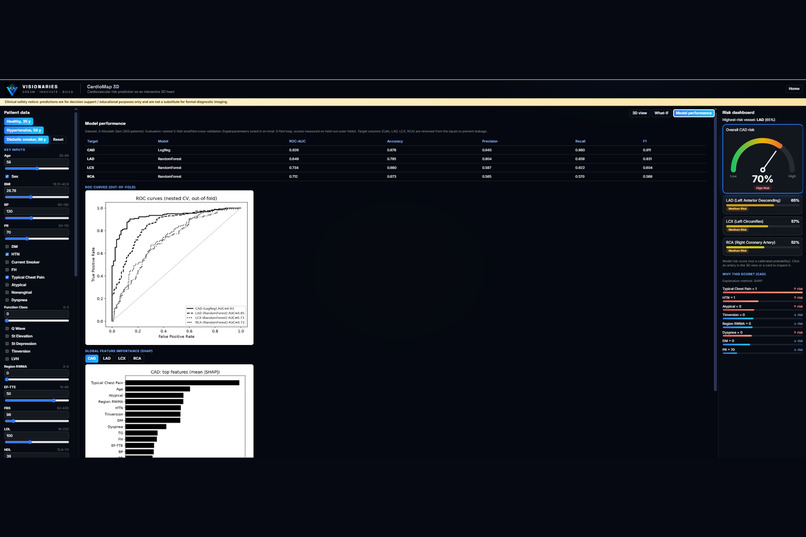
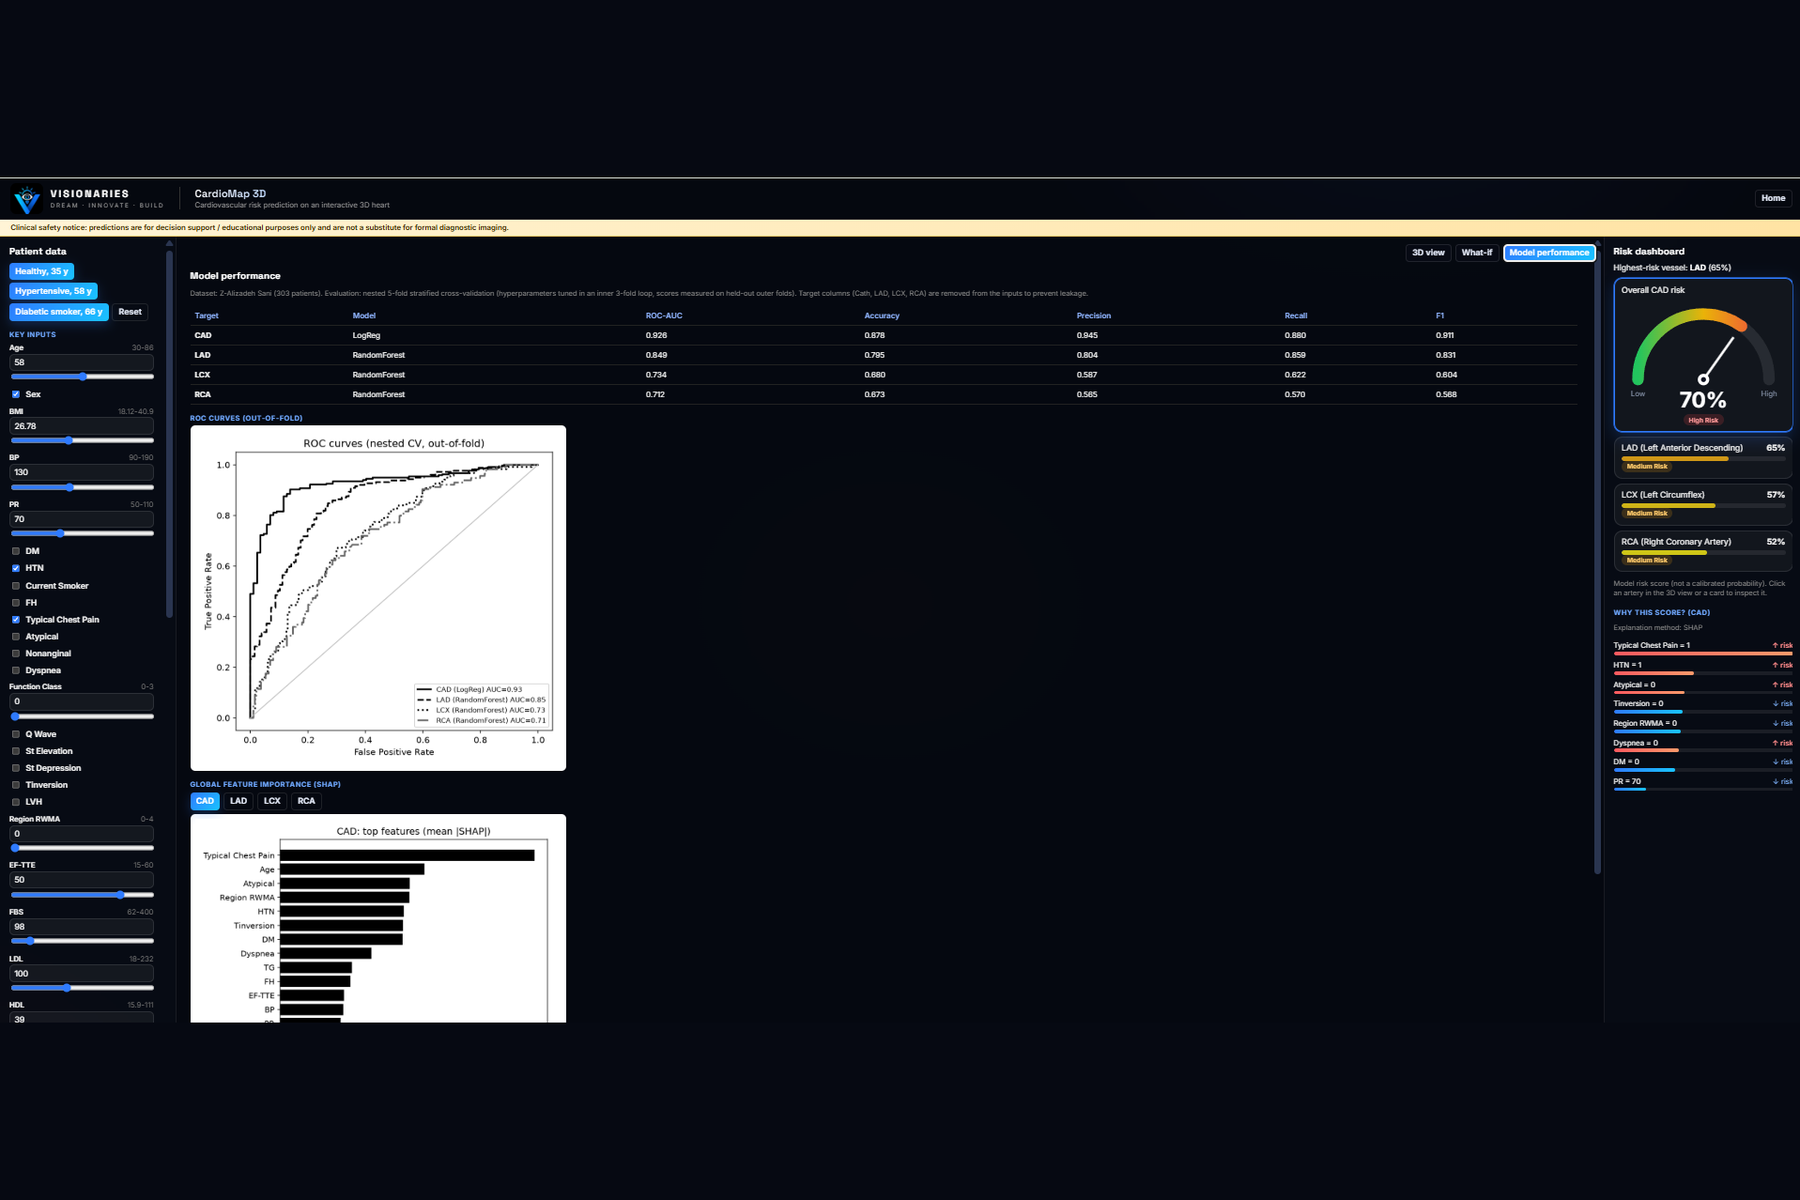
Model performance: nested cross-validation results (CAD ROC-AUC 0.926), ROC curves and SHAP importance
Inspiration
Heart disease risk is usually shown as a few numbers in a table, which is hard to read quickly. Doctors and students have to mentally connect "this patient's risk score" with "which coronary artery is probably affected". We wanted to make that connection visible: put the risk directly on a 3D heart and explain why the model gave that score.
What it does
CardioMap 3D takes a patient's clinical information (demographics, symptoms, ECG, lab tests and echocardiography, 59 features in total) and predicts four things: overall coronary artery disease (CAD) and narrowing in the LAD, LCX and RCA arteries.
- An interactive 3D heart colors each artery from green (low risk) to red (high risk), updating live as inputs change
- Click an artery and the camera flies to it, with its own SHAP explanation
- Blood-flow pulses, a schematic narrowing and a warning ring follow each artery's predicted risk
- Heartbeat animation and sound follow the patient's pulse rate, plus an illustrative ECG strip
- What-if explorer: change blood pressure, LDL, smoking, BMI or blood sugar and see how scores respond
- Overall risk gauge, "Read aloud" voice summary, three demo patients and an auto guided tour
- Model performance tab with metrics, ROC curves and global SHAP plots
How we built it
- Data: Z-Alizadeh Sani dataset (UCI), 303 patients, 59 input features. Target columns (Cath, LAD, LCX, RCA) are removed from the inputs to avoid leakage.
- ML: Logistic Regression, Random Forest and XGBoost compared for each of the 4 targets using nested 5-fold stratified cross-validation (inner 3-fold tuning) for honest estimates. SHAP gives per-patient and global explanations.
- Backend: FastAPI REST API (
/predict,/features,/metrics,/health) hosted on Render. - Frontend: React + Vite with Three.js (@react-three/fiber, drei), hosted on Vercel. The heart is procedurally generated in code, so there are no licence issues and every artery maps directly to a model output.
- Heartbeat sound, voice summary and ECG strip use browser APIs (Web Audio, Web Speech, Canvas 2D).
Challenges we ran into
- Making the heart look anatomical instead of cartoon-like, using only mathematical surfaces
- Avoiding data leakage and getting honest performance estimates on a small dataset
- Keeping predictions and SHAP explanations fast enough for live updates (about 0.3 s)
- Running SHAP on a free low-memory host, which needed a lightweight explanation fallback
- The dataset has no lesion location, so the narrowing position on each artery is schematic only
Accomplishments that we're proud of
- Overall CAD prediction reaches ROC-AUC 0.926 under nested cross-validation, and LAD reaches 0.849
- A fully working, deployed system: live 3D visualization, explainable predictions and a public API
- Every score comes with a reason, which supports clinical interpretability
- A polished experience with a landing page, guided tour, sound and voice
What we learned
- Leakage-safe training and nested cross-validation matter much more than picking a fancy model
- Explainability (SHAP) makes a model far easier to trust and discuss
- Linking ML outputs directly to a 3D scene makes results understandable at a glance
- Deploying a full-stack ML app end to end with free-tier hosting
What's next for CardioMap 3D
- Validate on larger and external hospital datasets, especially to improve LCX and RCA
- Calibrated probabilities instead of raw risk scores
- Patient-specific anatomy from imaging (CT angiography) instead of a schematic layout
- Lesion-location data to place narrowing accurately
- Clinician feedback and a mobile-friendly version
CardioMap 3D is an educational decision-support prototype, not a medical device.

Log in or sign up for Devpost to join the conversation.