-
-
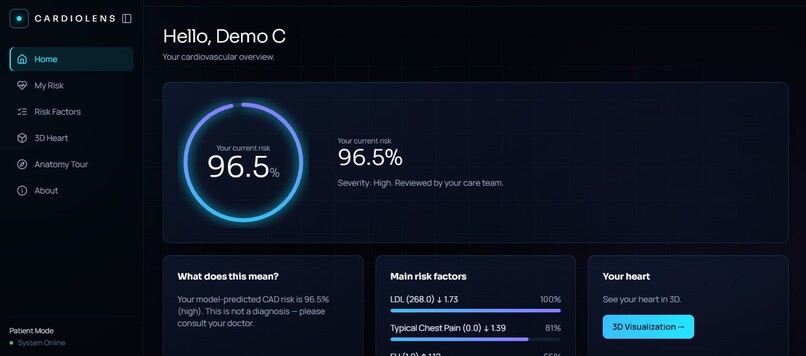
ML Prediction
-
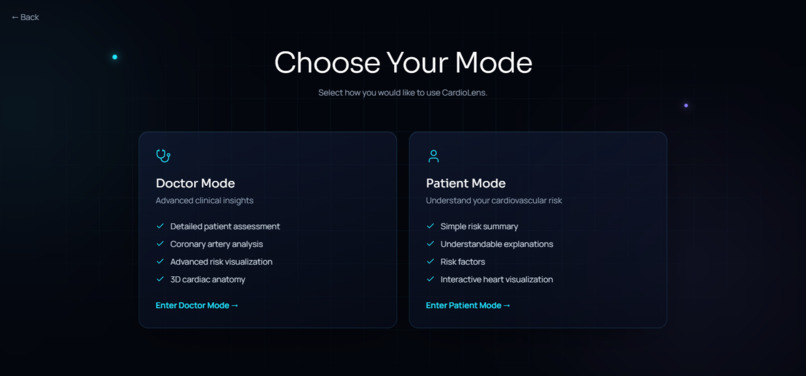
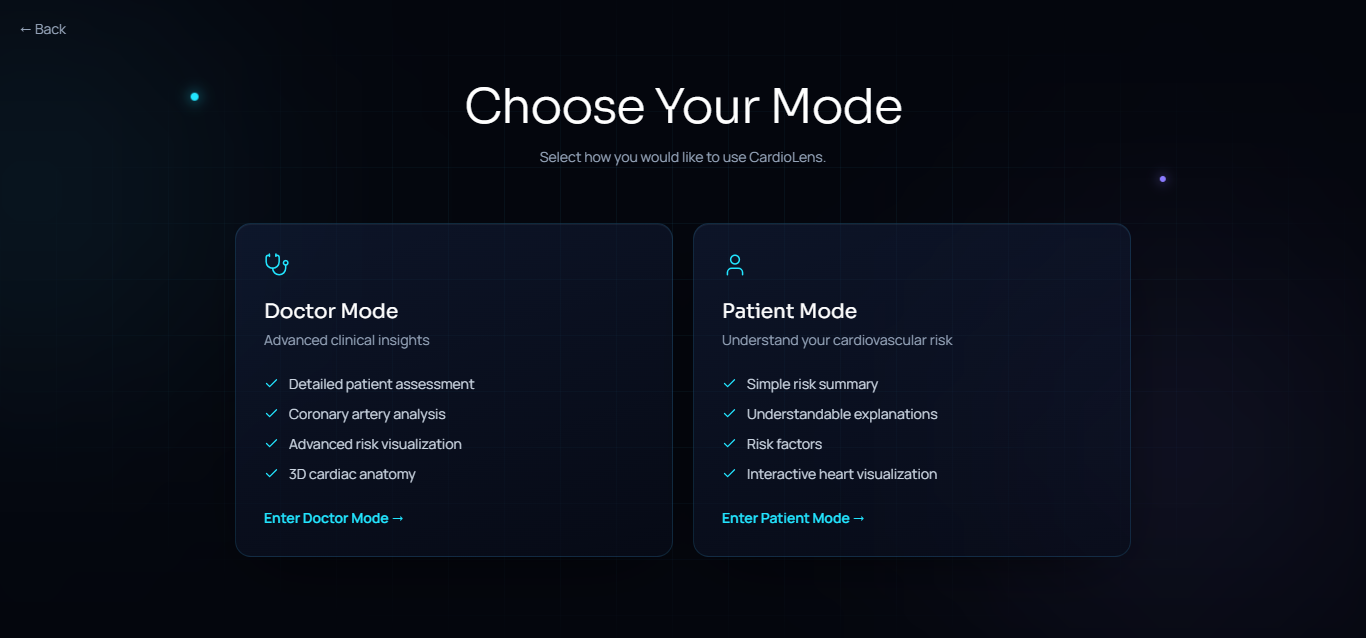
Choose Your Mode
-
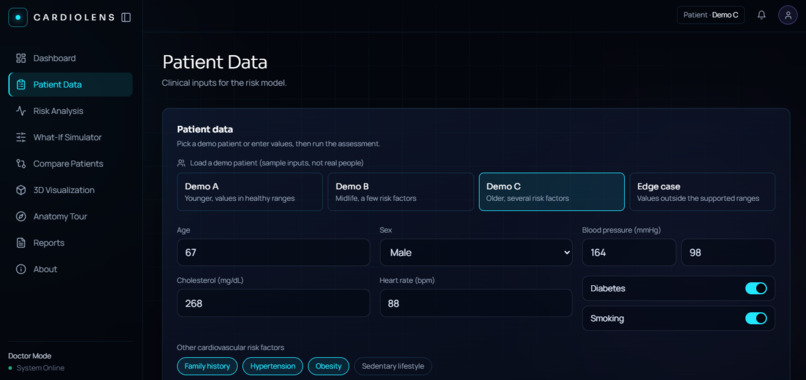
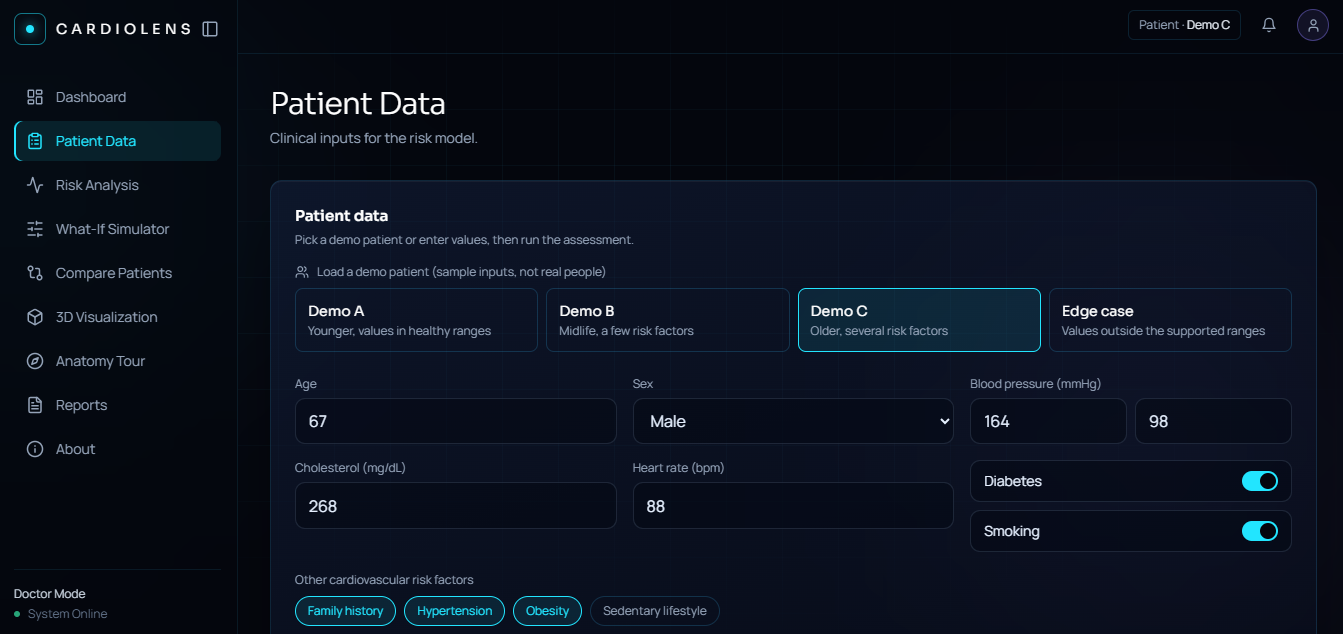
Patient Data
-
Welcome Page
-
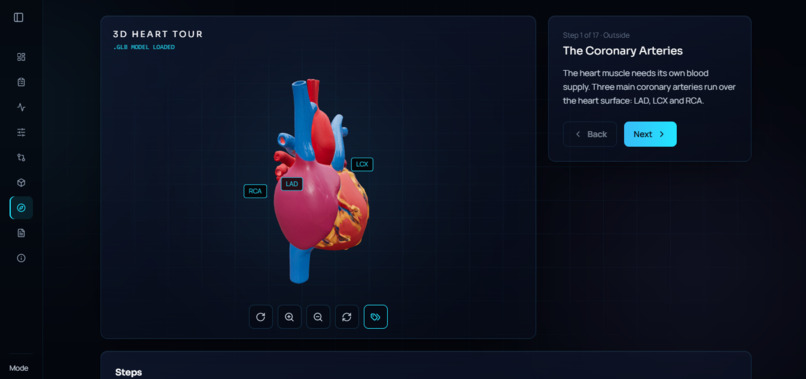
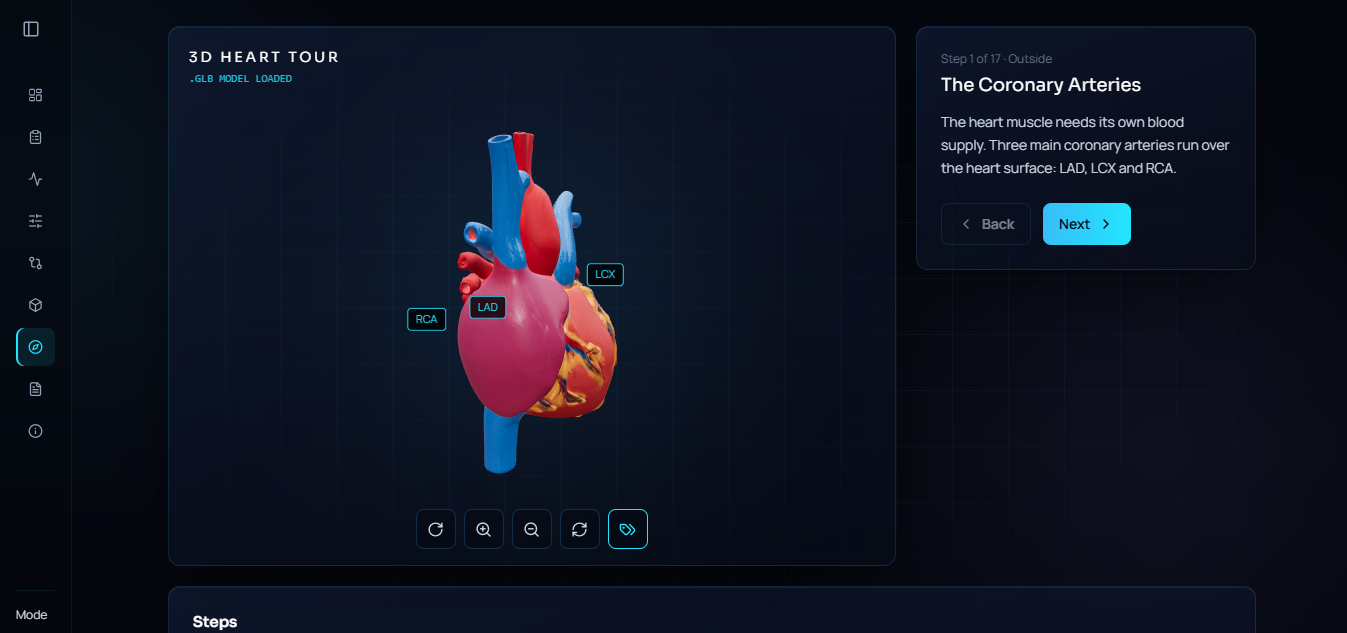
3D Visualization
-
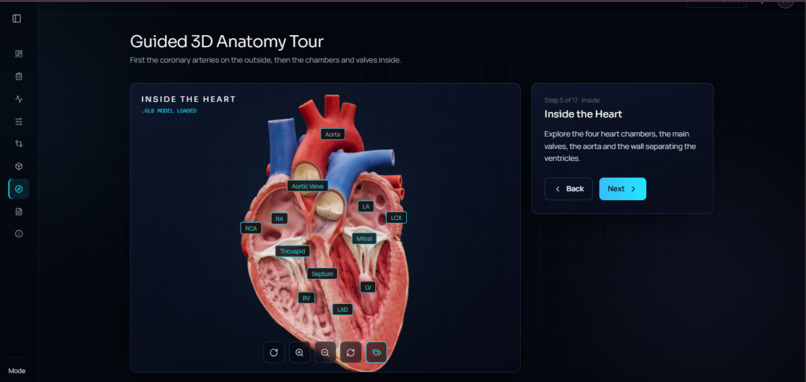
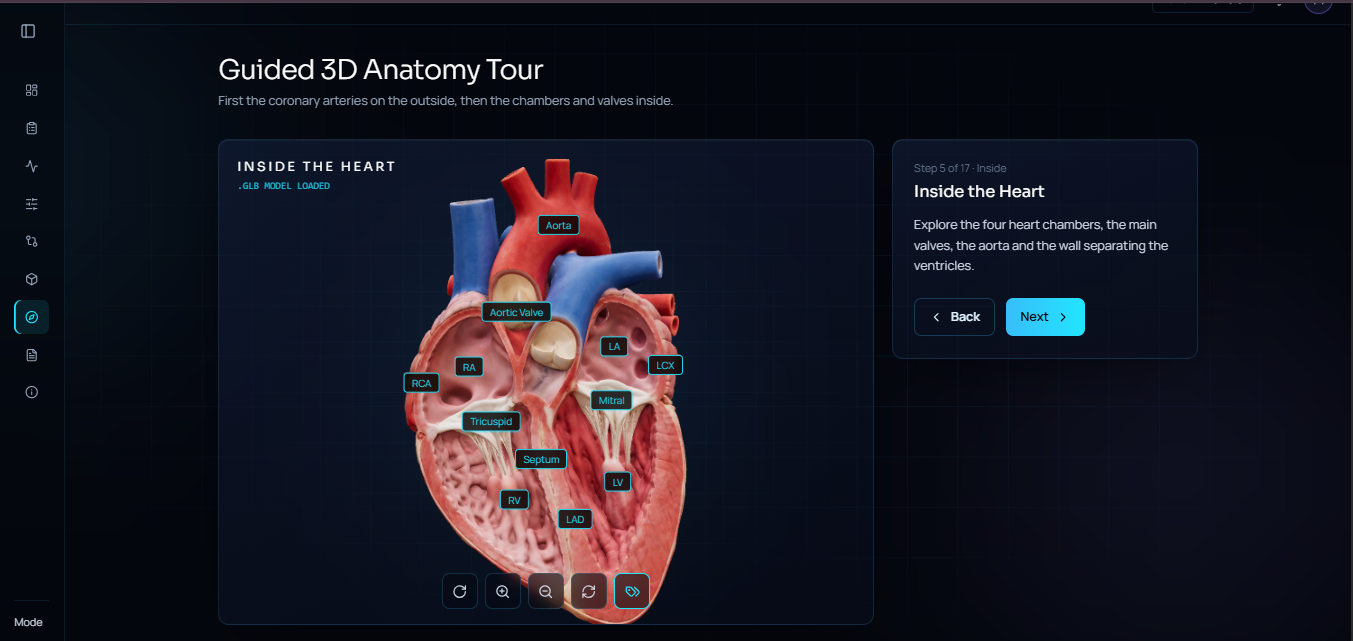
Guided Anatomy Tour
Inspiration
- The growing concern around heart diseases inspired us to explore how technology could make cardiac risk information easier to understand.
- We wanted to combine machine learning and 3D visualization to present cardiac insights in a more interactive way.
- This idea led us to build CardioLens — ML-Powered Cardiac Intelligence.
- CardioLens is our team's first properly planned and implemented project, making it a significant milestone for Team Nexus.
What it does
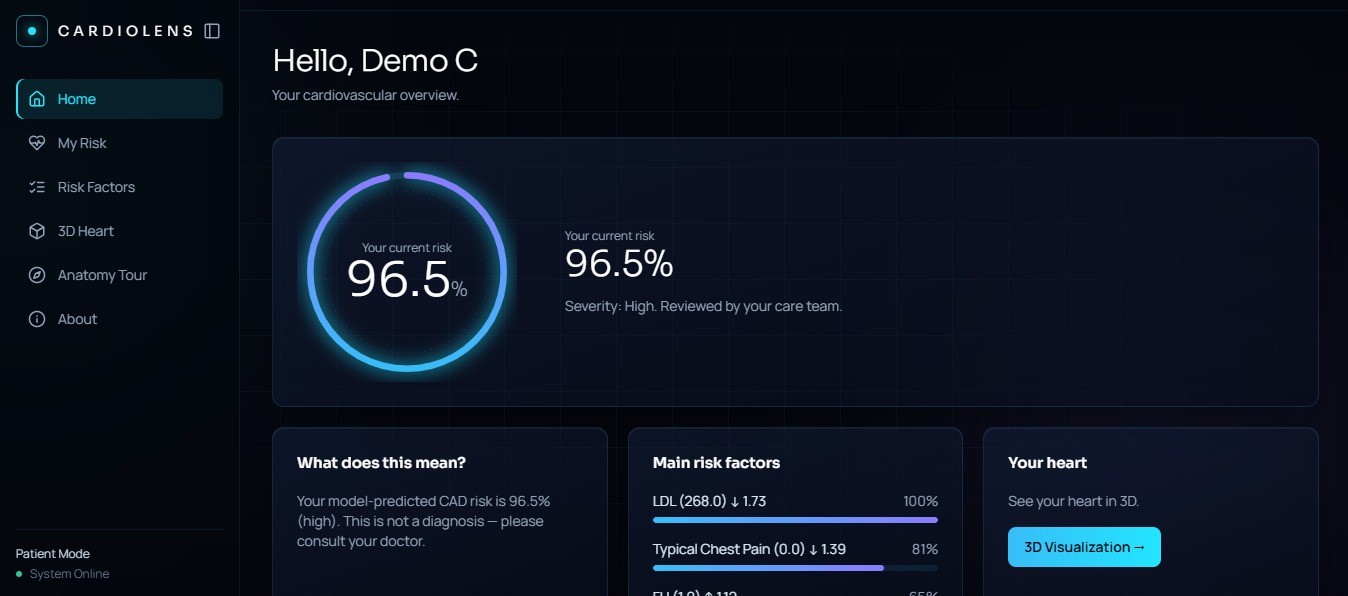
- Cardiac Risk Prediction: Uses Logistic Regression and Random Forest for cardiac risk classification.
- Vessel-Specific Analysis: Focuses on three major coronary arteries: LAD, LCX, and RCA.
- Interactive 3D Visualization: Enables users to explore a 3D heart model.
- Guided Anatomy Tour: Provides a structured visual exploration of heart anatomy.
- Risk Factor Exploration: Presents relevant cardiac risk factors through a dedicated interface.
- Model Interpretability: Explores SHAP-based feature explanations to help understand model predictions.
How we built it
- Frontend: React for the user interface.
- Backend: Python and FastAPI for backend development.
- Machine Learning: Scikit-learn with Logistic Regression and Random Forest.
- Data Processing: Pandas and NumPy.
- Model Interpretability: SHAP for exploring feature contributions.
- 3D Visualization: Three.js-based technologies for interactive heart visualization.
- We divided responsibilities across frontend, backend, ML, and project coordination to develop the prototype collaboratively.
Challenges we ran into
- Preparing and processing the dataset for machine learning.
- Evaluating different models and understanding their performance.
- Representing heart anatomy through interactive 3D visualization.
- Exploring meaningful explanations for model predictions.
- Coordinating different components and managing time within the hackathon deadline.
Accomplishments that we're proud of
- Developed our team's first properly planned and implemented project.
- Built a dedicated frontend for cardiac risk exploration.
- Implemented two machine learning approaches: Logistic Regression and Random Forest.
- Created an interactive 3D heart visualization and guided anatomy tour.
- Explored SHAP-based model interpretability.
- Completed our project presentation and created our Devpost project page.
What we learned
- Practical experience in data processing and machine learning.
- The importance of model evaluation and explainability.
- How 3D visualization can support interactive exploration.
- Better project planning, task distribution, and teamwork.
- The importance of coordinating different software components during development.
What's next for CardioLens
- Complete the remaining backend and ML features.
- Integrate the frontend and backend and test the complete workflow.
- Push the final code to GitHub.
- Deploy the application.
- Record the project demonstration video.
- Improve the 3D visualization and model explanation experience.
CardioLens — Your Heart Through a Smarter Lens.
Built With
- 3d-visualization
- css
- data
- data-science
- explainable-ai
- fastapi
- healthcare
- html
- javascript
- logistic-regression
- machine-learning
- medical-technology
- numpy
- pandas
- python
- random-forest
- react
- scikit-learn
- shap
- three.js


Log in or sign up for Devpost to join the conversation.